

Industry: Real Estate
Product: ModelRisk
Application: Evaluating Uncertainty in Infrastructure Project Feasibility
An "approved" transit project with a 1.27 business-case BCR has a 49% chance of destroying value
A public agency appraised a light-rail extension over a 30-year evaluation period. The business case looked safe: $640M of capital, $58M a year of steady-state benefit, a four-year ramp-up, discounted at 3.5%. The deterministic appraisal returned a benefit-cost ratio of 1.27 and an NPV of $170M — comfortably above the BCR = 1 hurdle, so the project was approved. Running the same business case through Monte Carlo, with realistic uncertainty on the capital overrun, the ridership benefit and the ramp-up, the headline collapsed: a mean BCR of 1.09, a median of 1.01, and a 49% probability that the project destroys value (BCR < 1). The point estimate did not just have error bars — it sat near the top of a distribution that was almost a coin-flip.
ModelRisk was used to turn "BCR = 1.27, approve" into "the distribution of the BCR, and the probability the project clears its hurdle."
Why a single BCR fails
A deterministic appraisal assumes the capital lands on budget, ridership lands on forecast, and benefits ramp in on schedule. Each of those is the optimistic end of a real distribution: infrastructure megaprojects systematically run over capital, transit ridership forecasts systematically over-promise, and ramp-ups systematically slip. Because the BCR is benefits divided by costs, those biases compound in the same direction — a denominator that drifts up while the numerator drifts down. The single 1.27 figure is the value you get only if every uncertain input behaves; it tells the decision-maker nothing about how often the project actually clears its hurdle.
A probabilistic appraisal
The model replaced three point inputs with distributions and discounted a full 30-year net-benefit stream per trial:
- Capital cost overrun — LogNormal, right-skewed, median around 12% over budget with a fat tail, reflecting ground conditions and scope creep.
- Peak ridership benefit — LogNormal around $58M, carrying a small optimism haircut at the median to reflect the well-documented ridership-forecast bias.
- Ramp-up length — a 2-to-8-year triangular draw, mode four years, that slips longer when conditions are weak; a longer ramp pushes benefits later and lowers their present value.
A shared regional growth and fuel-price macro factor links the benefit and cost sides: a strong environment lifts ridership and the per-trip benefit but also inflates input costs and the overrun. The model confirmed the intended structure — peak benefit and capex are weakly positively correlated through the macro factor (rank correlation 0.20), peak benefit drives the BCR up (rank correlation 0.66), and the capital overrun drives it down (rank correlation -0.56). No trial produced a negative capital cost or a negative benefit.
The BCR distribution the business case hid
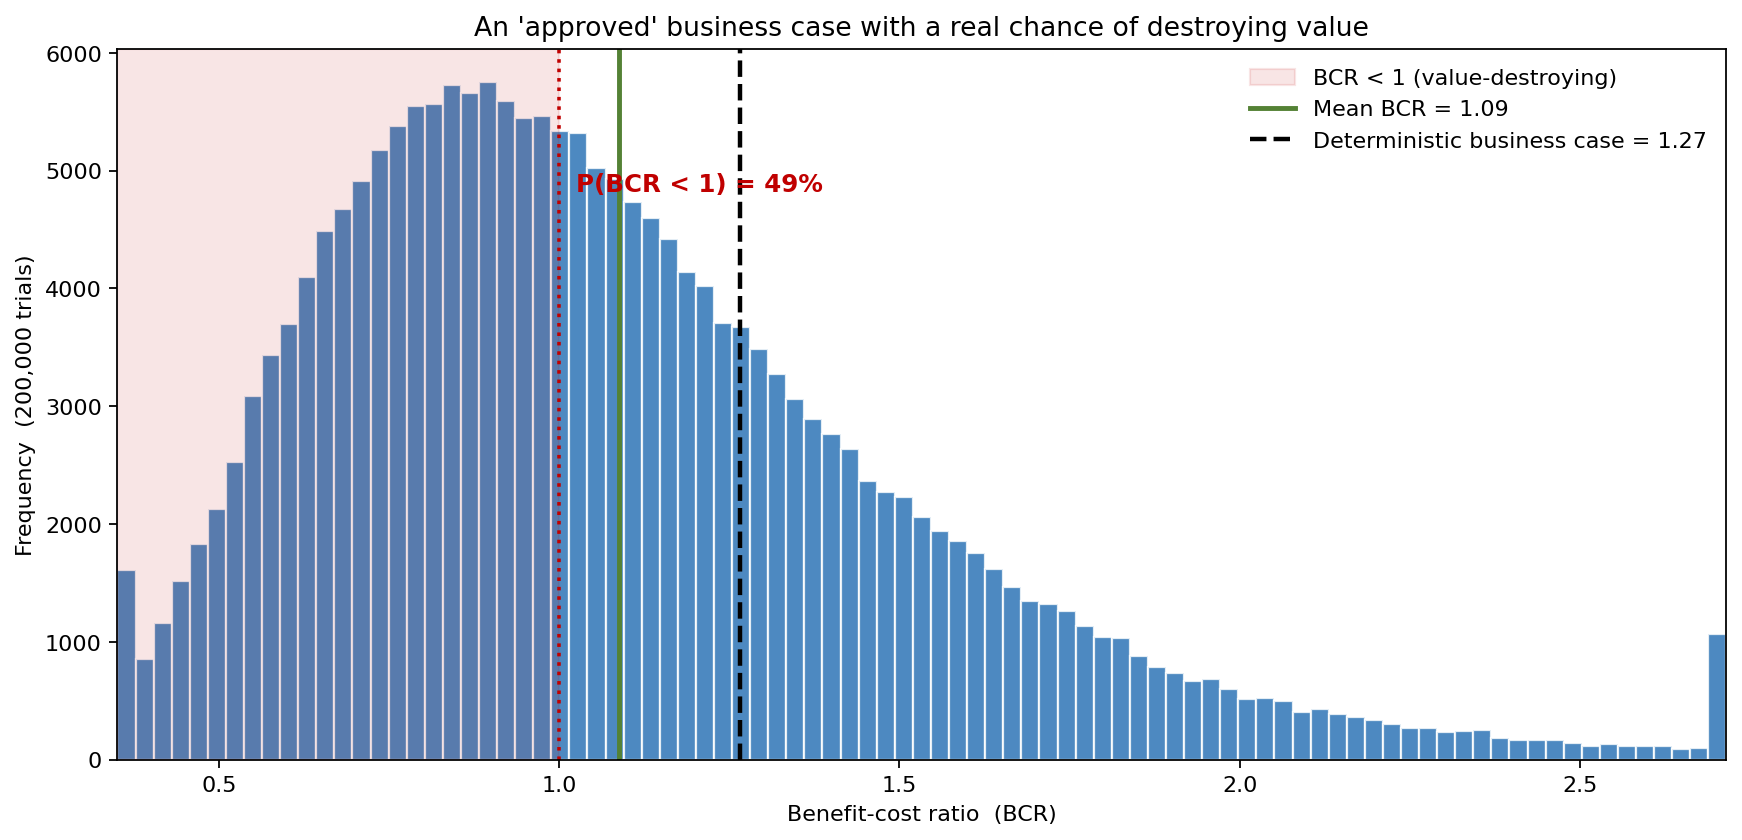
Against the deterministic 1.27, the simulated mean BCR is 1.09 and the median is 1.01 — barely above the hurdle. The 10th percentile is 0.60 and the 90th is 1.66. The shaded region below BCR = 1 holds 49% of the probability mass: the project is a near coin-flip to destroy value, a fact entirely invisible to the approved business case. The deterministic figure sits well into the favourable upper portion of the distribution.
The NPV is wide, skewed, and routinely negative
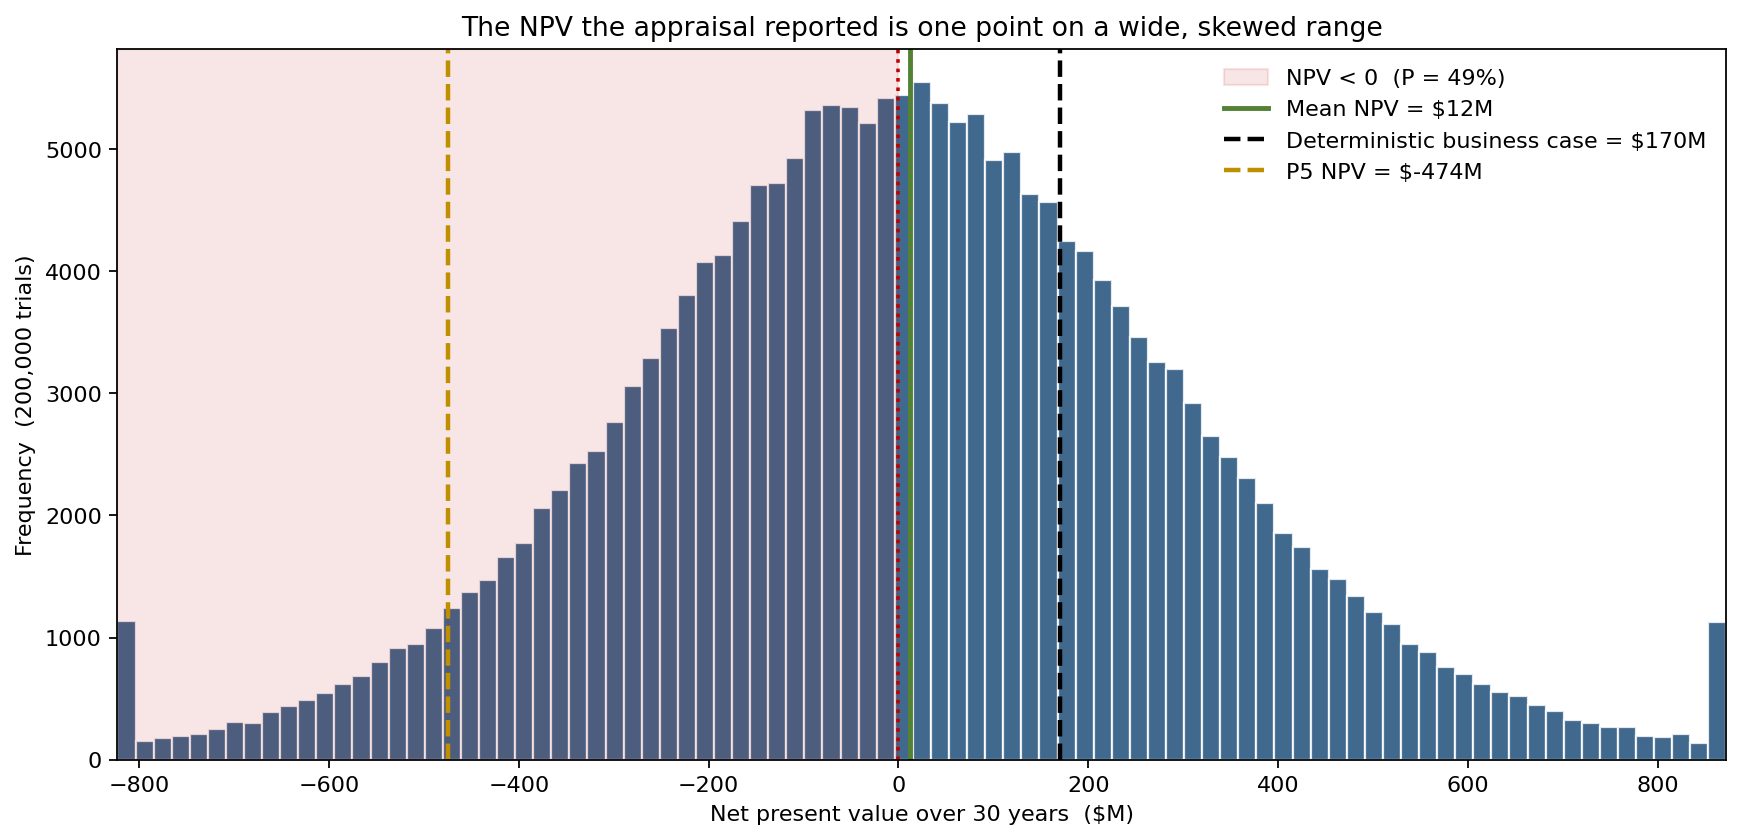
In money terms, the deterministic NPV of $170M dissolves into a mean of just $12M, a median of $9M, a P10 of -$359M and a P90 of $388M. The probability of a negative NPV is the same 49%. The downside is heavier than the upside: the 5th-percentile NPV is -$474M and the expected shortfall across the worst 5% of outcomes is -$626M — losses approaching the size of the capital budget itself. A symmetric "plus or minus" sensitivity band would have badly understated this skewed tail.
What drives the benefit-cost ratio
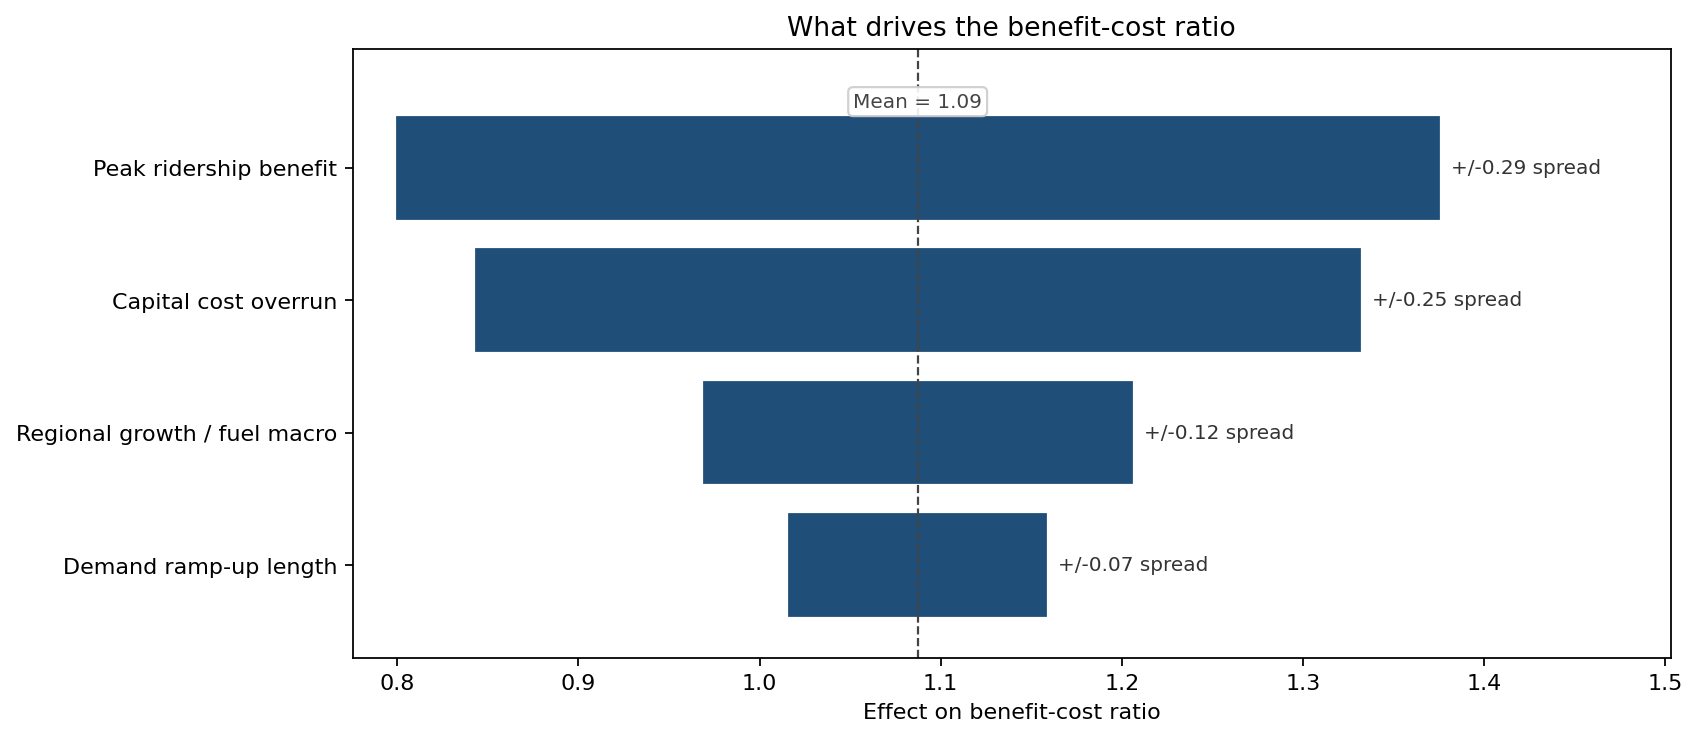
Against a mean BCR of 1.09, peak ridership benefit moves the BCR by about ±0.29 and the capital cost overrun by about ±0.25 — the two dominate and roughly balance. The regional growth/fuel macro factor adds ±0.12 and the ramp-up length ±0.07. The implication is direct: the project's fate turns on getting ridership right and capital controlled, so a ridership-demand validation study and a fixed-price or capped construction contract are the two mitigations that actually move the verdict.
How much overrun can the project absorb?
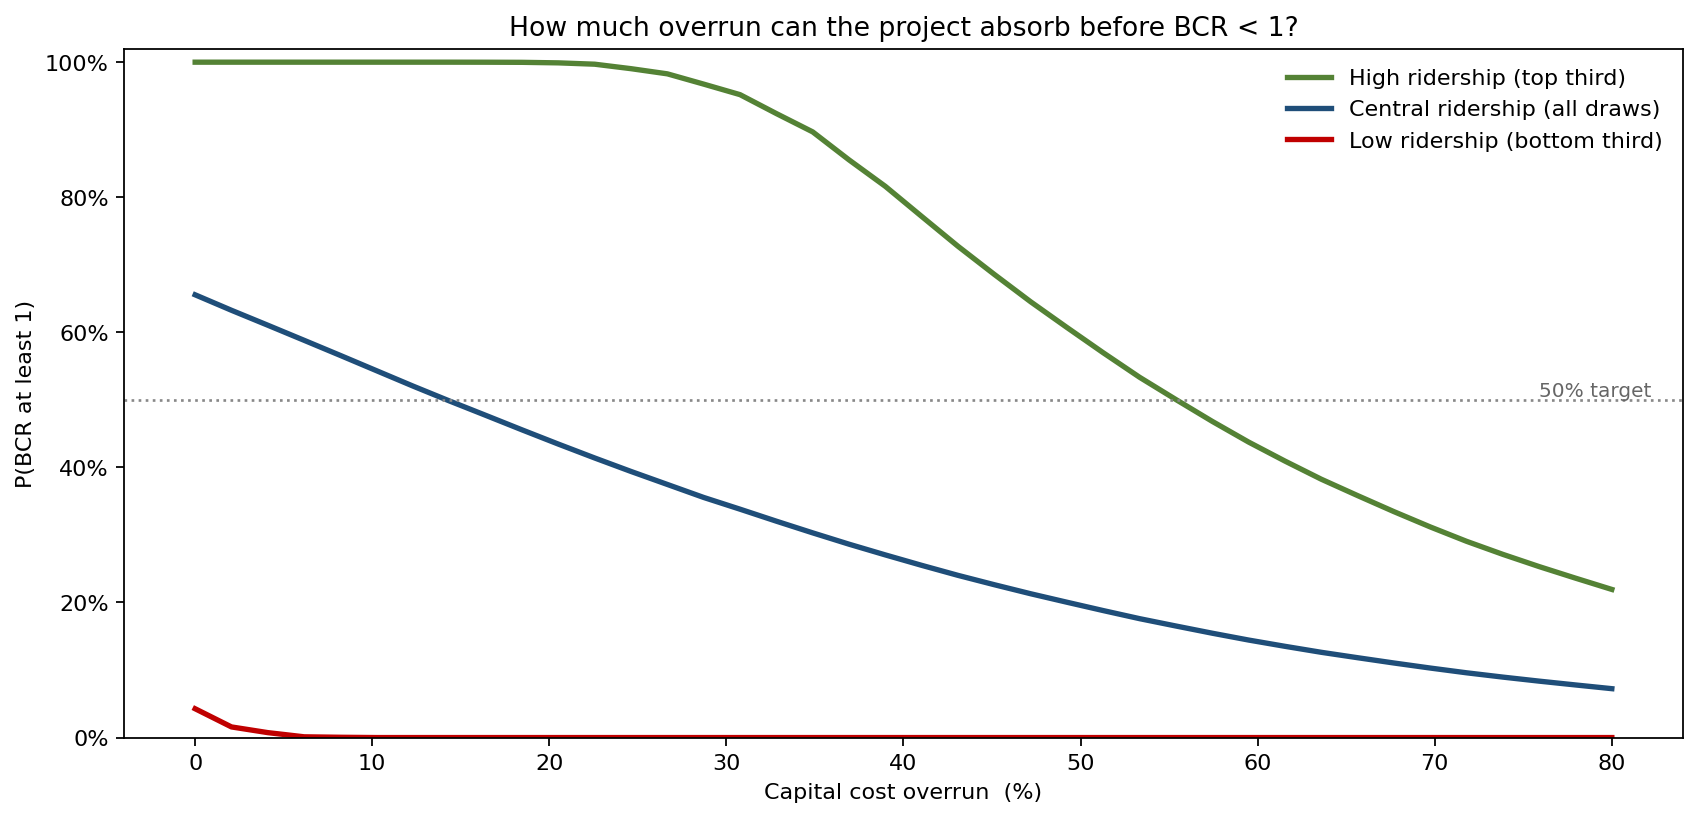
Sweeping the realised capital overrun against the probability of clearing BCR = 1 makes the project's fragility explicit. At zero overrun the probability of clearing the hurdle is 66% for the central ridership case — but only 4% if ridership lands in its bottom third, and 100% if it lands in its top third. At a 40% overrun those drop to 27% central, 0% low and 82% high. The central case holds the probability of clearing the hurdle at 50% only up to about a 12% overrun — and the median overrun the model expects is itself 12%. The project has essentially no margin: it needs both ridership to hold up and capital to stay near budget, and the appraisal had quietly assumed both.
What the model changed
The agency did not cancel the project — it re-scoped the decision. With a 49% chance of a negative NPV concentrated in two drivers, approval was made conditional on a fixed-price construction contract (closing most of the overrun tail) and an independent ridership demand study (testing the optimism haircut). The deterministic BCR was retained only as the upper, all-goes-well anchor of the distribution, not as the basis for a go decision.
ModelRisk functionality used
- LogNormal capital-overrun distribution captured the right-skewed cost tail that a symmetric sensitivity band would have understated, producing an expected shortfall of -$626M in the worst 5%.
- Shared macro factor linked ridership benefit and capital cost (confirmed correlation 0.20), keeping the benefit stream genuinely uncertain rather than collapsing it to a tight Normal.
- Monte Carlo simulation turned a 1.27 point BCR into a distribution with a mean of 1.09, a median of 1.01 and P(BCR < 1) = 49%.
- Sensitivity (tornado) analysis ranked ridership benefit and capital overrun as the dominant, roughly balanced drivers, directing mitigation to a demand study and a fixed-price contract.
- Threshold sweep mapped the probability of clearing BCR = 1 against realised overrun for low/central/high ridership, exposing that the project's breakeven overrun (12%) equals its expected overrun.
For a single public project, the business-case BCR is the value you get only if everything behaves. Monte Carlo turns "is the BCR above 1?" into "what is the probability the BCR is above 1, and what does it take?" — the only question an appraisal that has to defend public money can honestly answer.