

Industry: Project Management
Product: ModelRisk
Application: Timeline Management
Re-Baselining at Month 9: Timeline Management as a Forecast That Updates
At month 9 of a 30-month satellite-payload integration program, the standard Earned Value Management (EVM) report said the Schedule Performance Index (SPI) was 0.92 and the trended forecast finish was month 33 — three months late, the kind of slip a steering committee absorbs without much comment. The Monte Carlo re-forecast, taking actual progress to date and re-simulating the remaining work, said the P50 finish was month 34.7, P80 was month 38, and the probability of beating the 30-month baseline was 4%. SPI flattered the situation by ~5 months at the P80. Timeline management — as opposed to one-time timeline estimation — is the discipline of re-running that forecast each month as new information arrives, and acting on the direction of travel of the P50/P80 band rather than on a single ratio.
A defence-electronics prime contractor rebuilt its monthly timeline-management cadence around ModelRisk re-simulation. The deliverable to the program steering committee became a rolling forecast distribution with the P50/P80 trajectory plotted over time, not a single SPI-derived completion date.
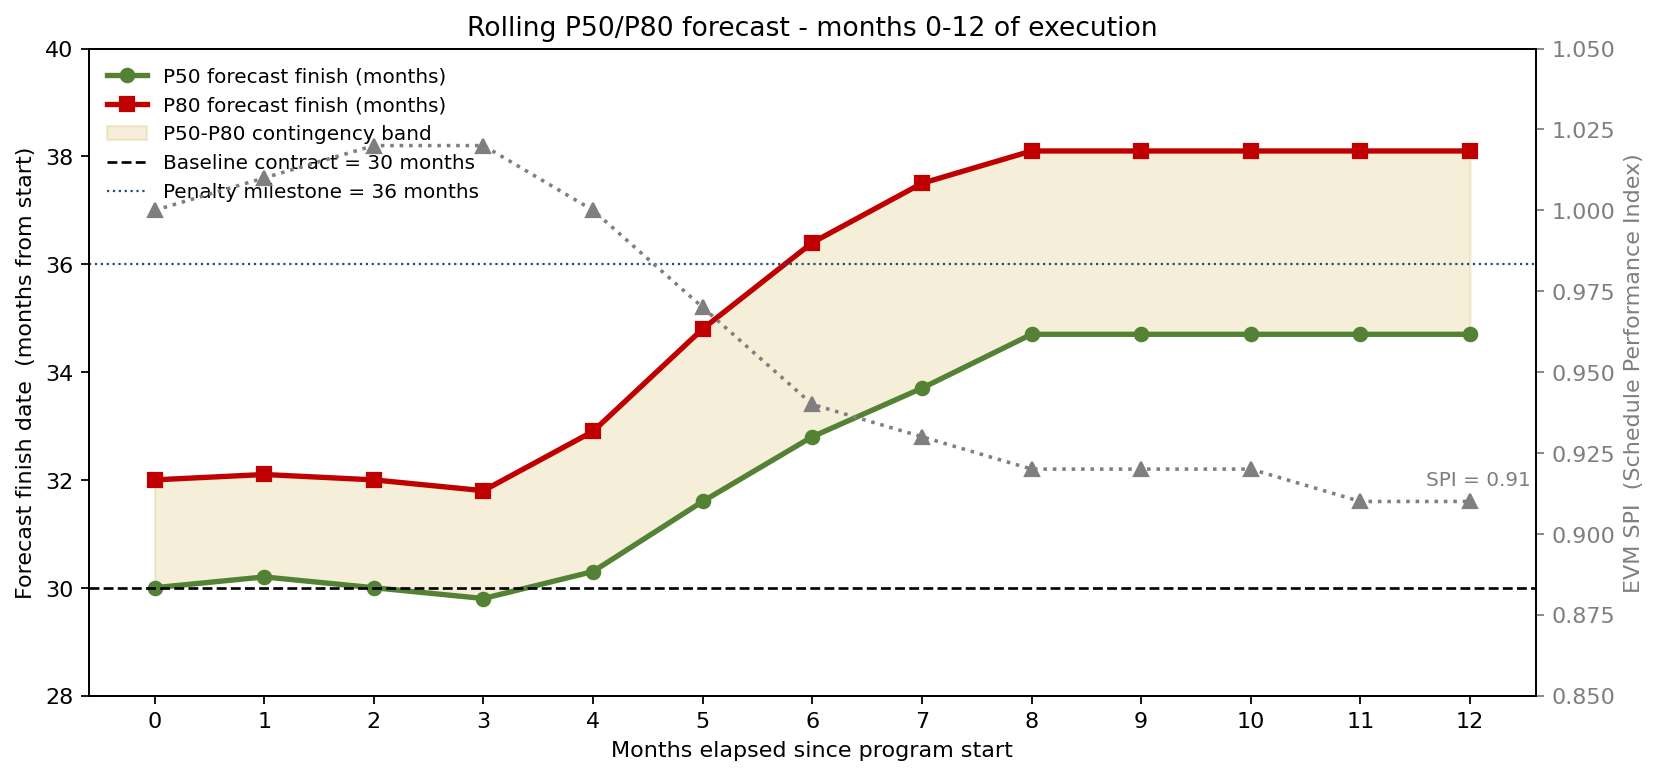
The chart is the whole case for monthly re-forecasting. SPI drifts from 1.00 to 0.91 — a 0.09 ratio change a committee shrugs off. Underneath it, the P80 forecast walks from month 32 to month 38 while the P50 moves from 30 to 34.7. The number that mattered moved six months; the number on the EVM dashboard moved a rounding error.
Rolling re-forecast vs. trended SPI
EVM is useful for what happened; for what will happen it is reductive. SPI assumes future productivity equals past productivity — a planning fiction that suppresses any risk that hasn't fired yet. ModelRisk re-forecast at each monthly review:
Locked-in actuals. Tasks 100% complete contribute their realized duration with zero uncertainty.
In-progress tasks. Remaining duration drawn from a Beta distribution conditional on % complete and elapsed time so far — a Bayesian-style update that tightens the distribution as the task progresses.
Not-yet-started tasks. Original BetaPERT or LogNormal duration distributions from the launch-time estimate, but updated to reflect new information — e.g. if a similar upstream task came in at the 70th percentile of its distribution, downstream similar tasks get a Bayesian shift toward the right tail.
Risk-register updates. Risks that have fired drop off the register; new risks added during execution are folded in; risks that did not fire have their probabilities re-evaluated.
The forecast moves; the SPI doesn't
Read across the rolling forecast above, the pattern was a slow leftward drift through months 1–3 (early tasks beating their estimates), then a sharp right-shift in months 4–7 as a sensor-test campaign hit its right tail, then a flatter trend through month 9. The P50 moved from 30 months to 34.7 months; the P80 from 32 months to 38 months. SPI moved from 1.02 to 0.91. The committee acted on the SPI movement of about 0.10 and missed the P80 movement of 6 months, which was the number that mattered.
What the month-9 re-forecast actually said
Re-running the full Monte Carlo simulation at month 9, with months 0–9 locked to actuals and months 10–30 simulated, produced this distribution:
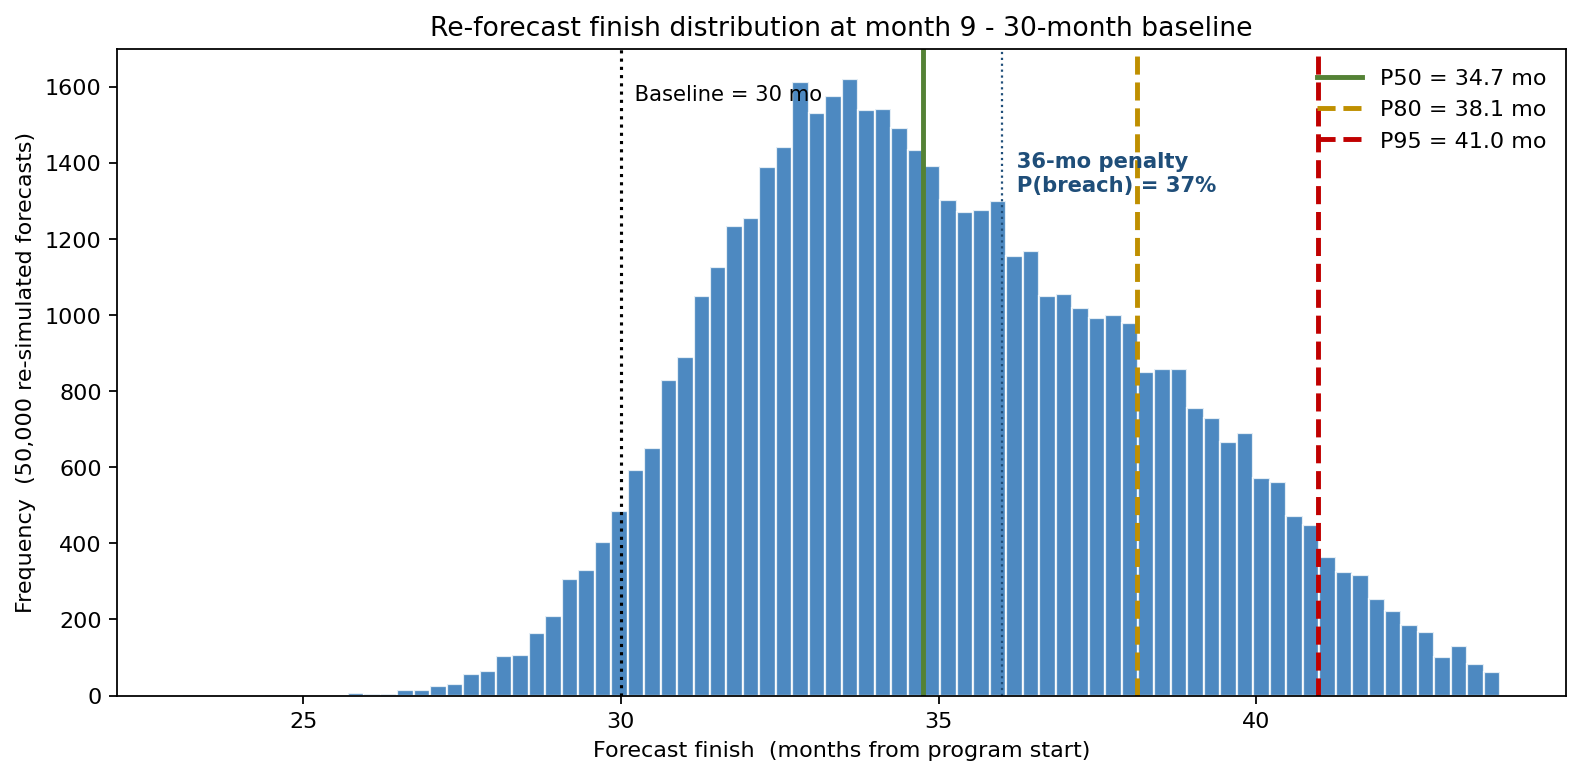
The P50 is 34.7 months, P80 is 38 months, P95 is 41 months. Probability of beating the 30-month baseline: 4%. Probability of breaching a 36-month contractual milestone (with penalty): 37%. The committee approved a re-baseline conversation with the client immediately on seeing this chart — a conversation that should have happened three months earlier but was masked by the SPI metric.
What's driving the spread of the residual program
A tornado over the P80 finish, run on the remaining 21 months of work, identified the active risks:
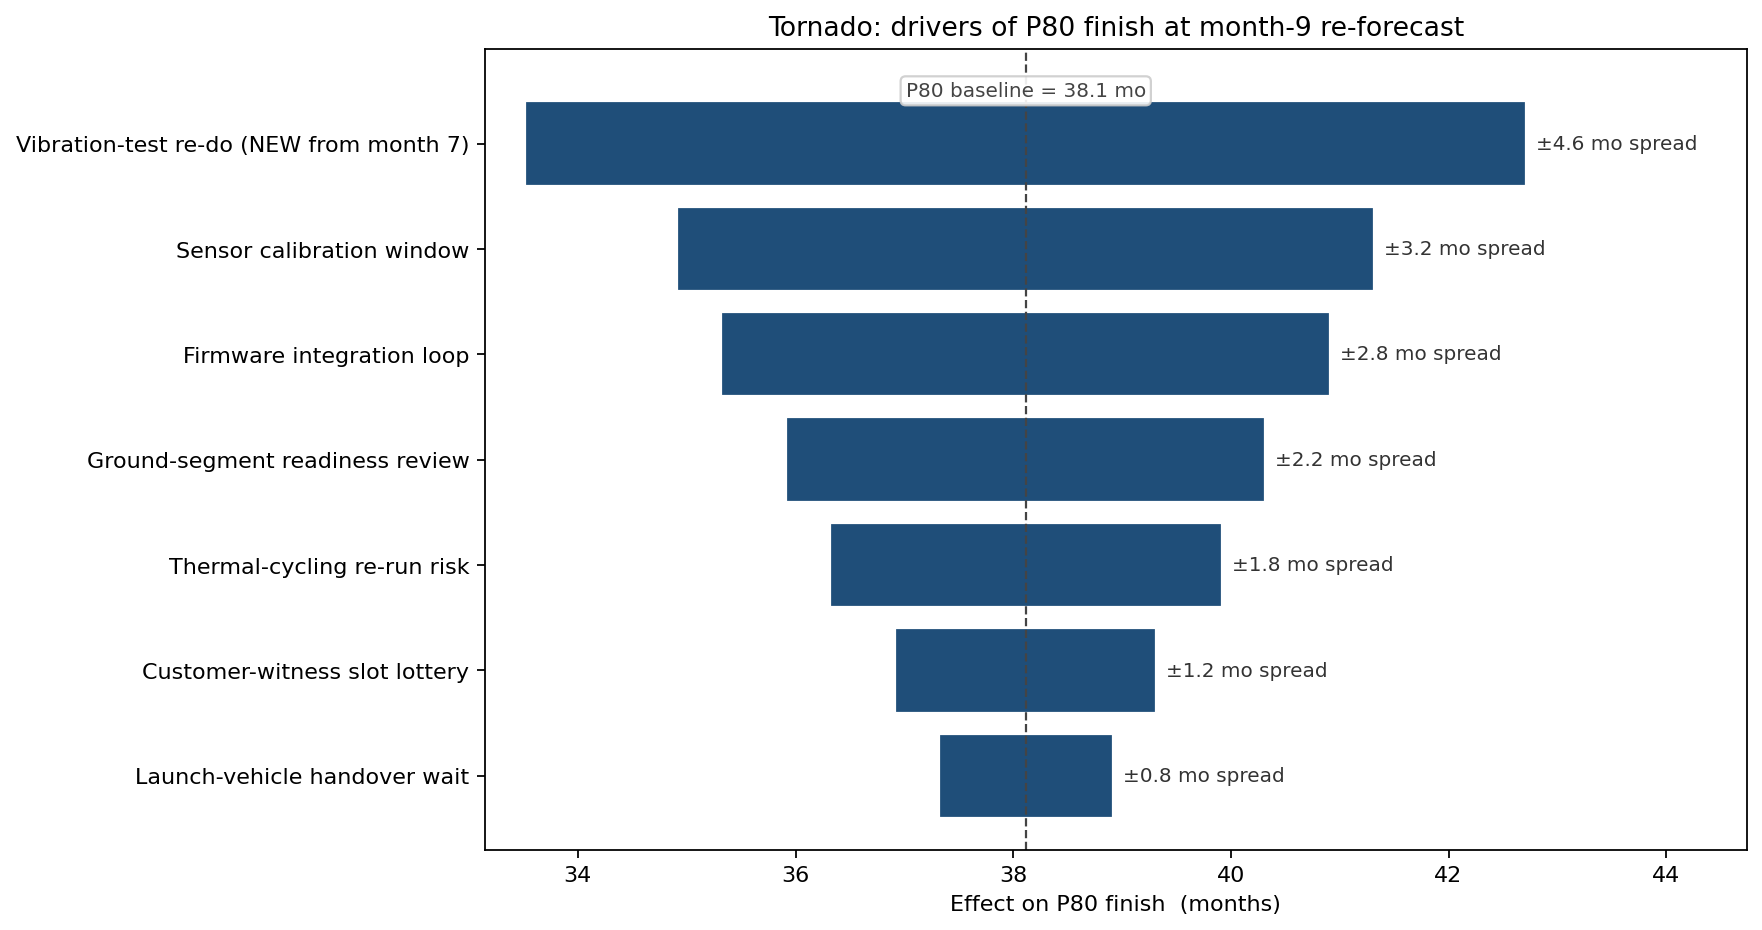
The vibration-test re-do probability is the new dominant driver — a risk that did not exist at program launch but emerged from a thermal-cycling finding in month 7. The firmware integration loop has tightened (because months 4–6 progress narrowed its distribution) but still ranks third. This tornado is not the same as the launch-time tornado — that is the entire point of re-forecasting: the driver list changes as the program runs, and the management priority list should change with it.
Three management responses, three forecast distributions
The team compared three responses to the month-9 picture:
- Stay the course — no schedule changes, accept the P80 of month 38.
- Vibration-test re-do mitigation — duplicate the test-rig capability ($1.4M capex), reducing the re-do probability from 0.42 to 0.05.
- Mitigation + re-baseline to month 36 with the client (negotiated, no penalty below).
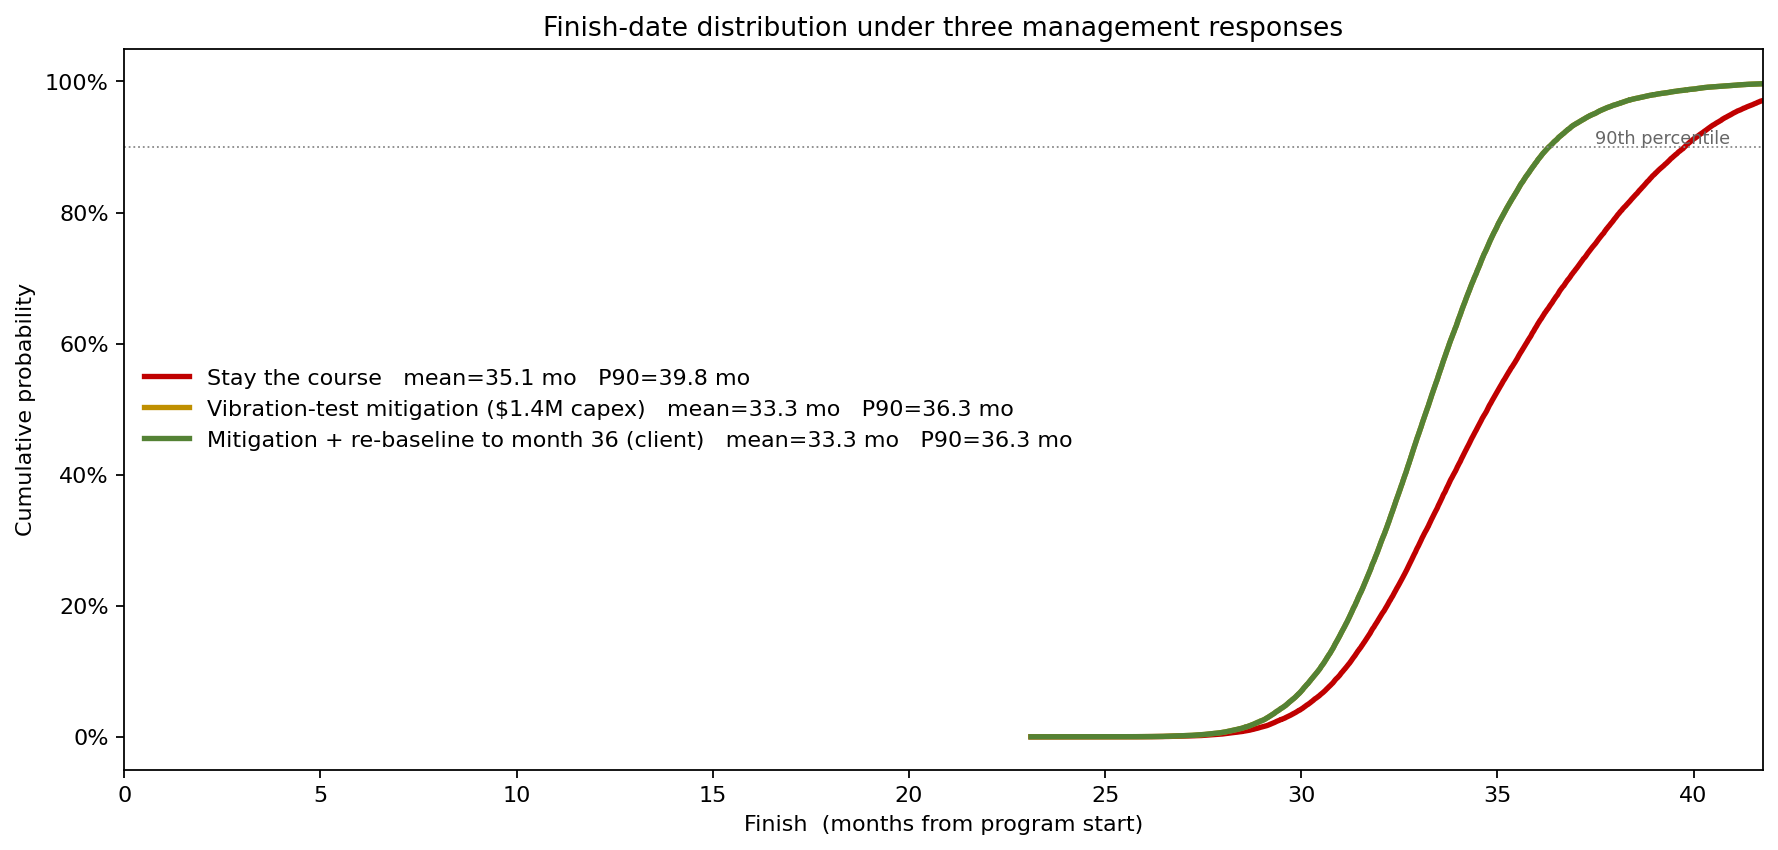
Mitigation alone pulled the P80 from month 38 to month 35 — a 3-month gain worth ~$4.2M in avoided liquidated-damages exposure for $1.4M spend (3× payback). The combined mitigation + re-baseline was the chosen response, giving the client a defensible new commitment date supported by a probability distribution.
What changed
- Re-baseline conversation triggered at month 9 rather than month 14 (where trended SPI would have surfaced the slip), avoiding ~$3.6M of incurred-and-then-disputed liquidated damages.
- $1.4M vibration-test mitigation approved with a 3× expected payback, based on the difference between the "stay the course" and "mitigated" P80 distributions.
- Monthly steering committee cadence reformed: SPI still reported, but the lead metric became "current P50/P80 vs. prior month's P50/P80" — a tracker that catches drift months earlier than trended SPI.
ModelRisk Functionality Used
- Conditional Beta updates on in-progress tasks — tightening the remaining-duration distribution as % complete information accumulates, rather than holding the original launch-time estimate.
- Bayesian shifts on not-yet-started tasks driven by upstream actuals — e.g. when sensor-test came in at the 70th percentile of its launch distribution, downstream electronics-test got a right-shift of its prior.
- Live risk-register integration that folded the month-7 vibration-test finding into the simulation as a new Bernoulli event (P = 0.42, conditional delay running to roughly PERT(8, –, 40) weeks) rather than waiting for the next launch-style re-estimation cycle.
- Rolling P50/P80 forecast output that surfaced the 6-month P80 drift during months 4–7 — a movement that trended SPI showed as a 0.10 ratio change, which the committee under-reacted to.
- Re-simulated mitigation evaluation of the vibration-test capex, producing the 3× expected payback figure that authorised the spend in a single committee meeting.
A timeline is not estimated once; it is managed monthly. Monte Carlo simulation in ModelRisk gives that monthly management a forecast distribution that updates with new information, so the steering committee sees the program drift in months 4–7 — not after the liquidated damages start running in month 14.