

Industry: Project Management
Product: ModelRisk
Application: Timeline Estimation
"18 Months" Has an 11% Chance of Being Right: Timeline Estimation as a Probability
A new vehicle-program launch was being pitched to the board at "18 months from kickoff." The deterministic Gantt added it up to 18.2 months. The Monte Carlo simulation said the P50 timeline was 19.8 months, the P80 was 21.6 months, and the P90 was 22.8 months — and that the probability of finishing within the pitched 18 months was only 11%. The same simulation said the probability of finishing within 24 months — the figure the board treated as the worst-case — was 95%. Both numbers belonged in the pitch. Only one was in it.
A Tier-1 automotive supplier rebuilt its program-timeline estimation process around the same simple idea: a timeline is not a number, it is a distribution. The deliverable to the board became a P50/P80 pair with the gap explicitly explained, not a single optimistic point estimate dressed up as a commitment.
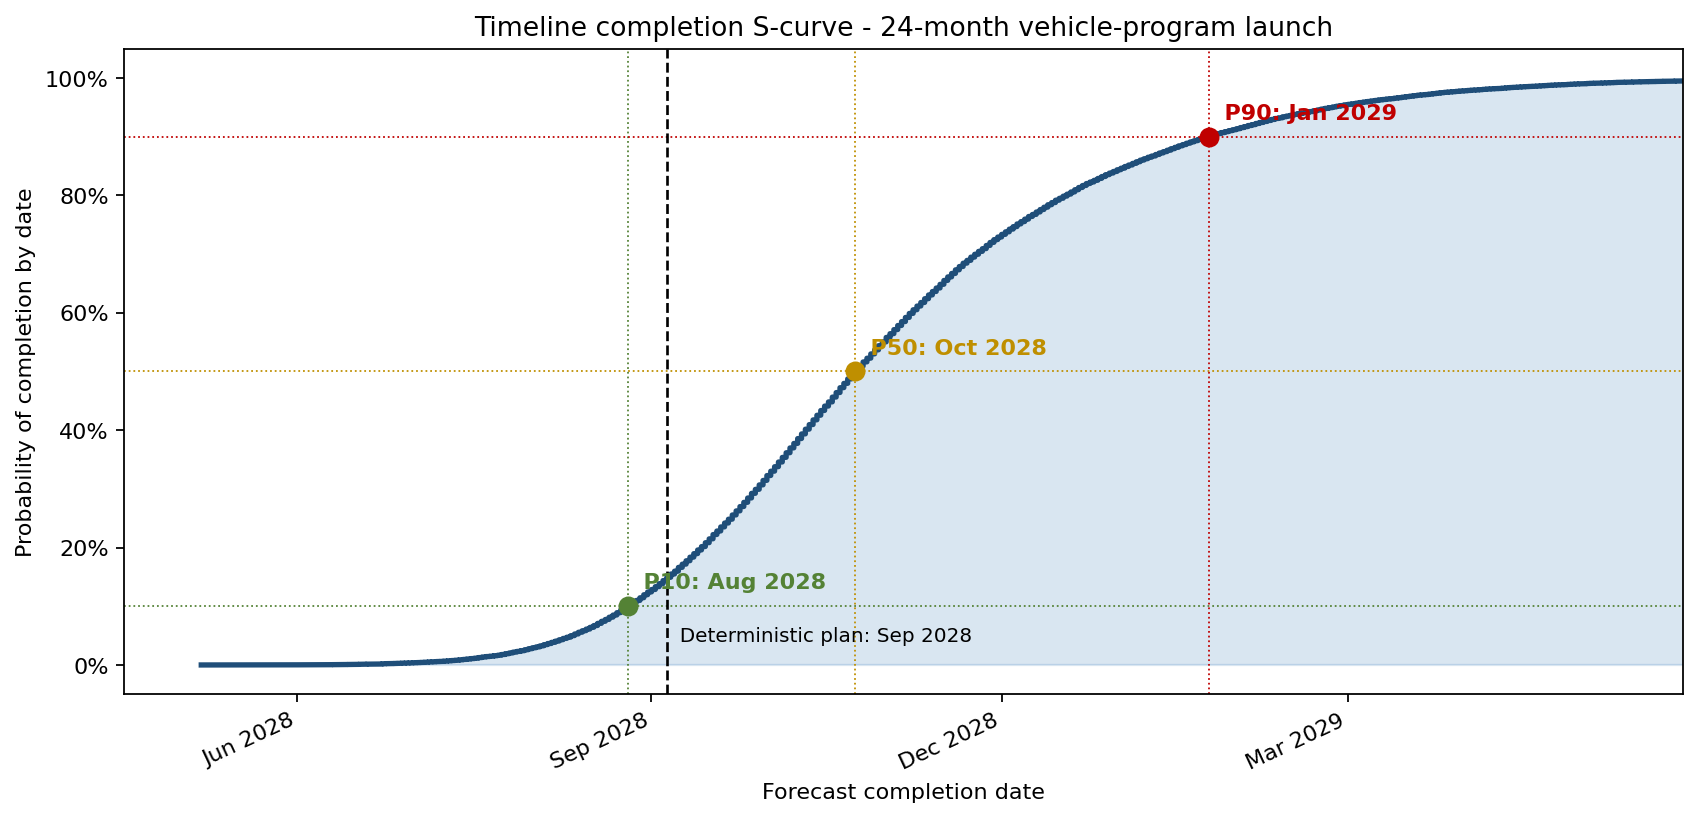
The S-curve is the only honest answer to "when will it finish?" The pitched 18-month date reads off at the 11th percentile — an aggressive bet dressed as a plan. The median lands at 19.8 months, the P80 at 21.6, and the right tail runs to 22.8 months at P90. The single point estimate has thrown all of that away.
Where the deterministic estimate goes wrong
Three systematic biases drive deterministic timelines low. A probabilistic estimate fixes all three:
Independent task durations are added arithmetically. In the deterministic plan, two parallel tasks of 6 months take 6 months. In reality, with both durations uncertain, the max of the two is what matters — and the max of two independent uncertain variables has a higher mean than the max of two point estimates. This "merge bias" alone added 0.8 months to the simulated P50.
Discrete risk events are ignored. The deterministic plan does not include a 12% probability of a tooling re-design, conditional delay PERT(8, 14, 24) weeks. Bernoulli + PERT-conditional treatment captured it.
Long right tails are flattened. Regulatory homologation was estimated at "12 weeks" — that was the mode, not the mean. The actual historical distribution is LogNormal(μ = log(13), σ = 0.4), mean ≈ 14.0 weeks, P90 ≈ 21.6 weeks. Mean ≠ mode for right-skewed distributions; using the mode in a deterministic plan systematically under-estimates by 15–25% per skewed task.
Together, these three corrections turned an 18.2-month deterministic plan into a 19.8-month P50 and a 21.6-month P80.
What the deterministic plan called "small risks"
A tornado over the P80 of the timeline distribution exposed which tasks earned active management. Tasks with low probability but high conditional impact dominate the ranking — the same blind spot that makes deterministic plans optimistic.
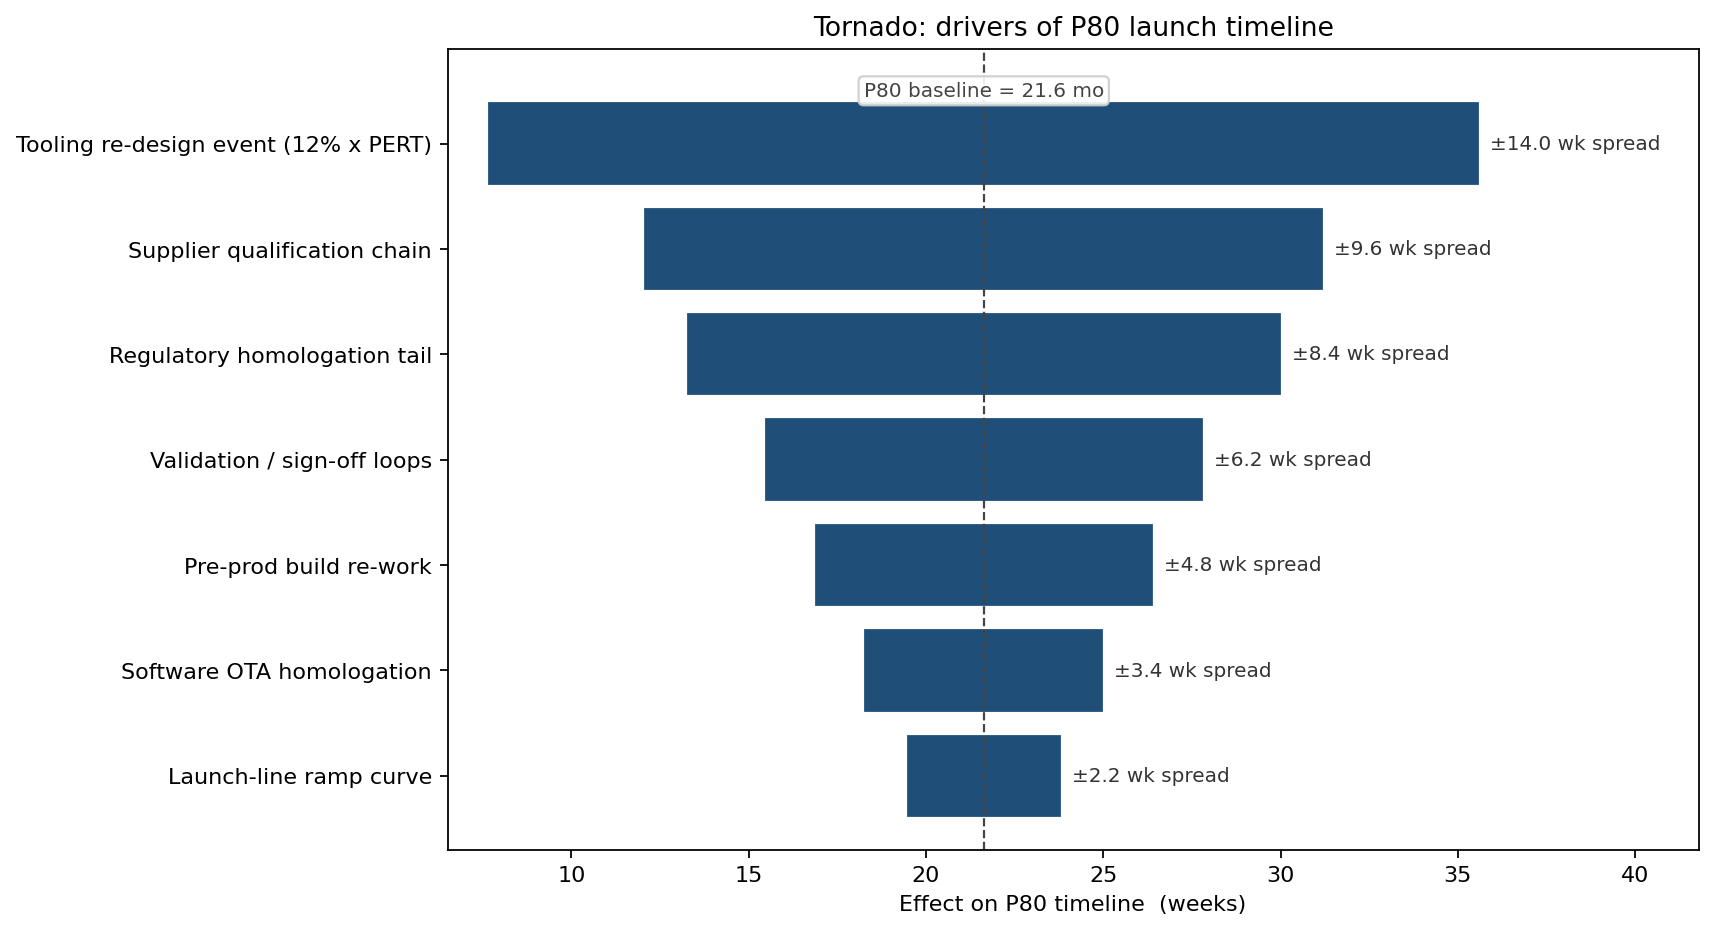
The tooling re-design event sits at the top — its 12% firing probability hides ~14 weeks of P10–P90 spread on the program. Supplier-qualification chain is second; regulatory homologation tail third. The first dollar of timeline-pull effort goes to a parallel-tooling proof-of-concept (cost ~$0.3M, EV impact ~5.2 weeks of pulled P80 finish).
Pull-in plans, evaluated by re-simulation
Two pull-in strategies were compared by re-running the full simulation under each:
- Parallel tooling proof-of-concept: cuts tooling re-design probability from 0.12 to 0.04 and trims its conditional delay PERT to (6, 10, 18) weeks.
- Pre-emptive supplier dual-source: cuts supplier-qualification chain mean from 14 wks to 9.5 wks and tightens the right tail.
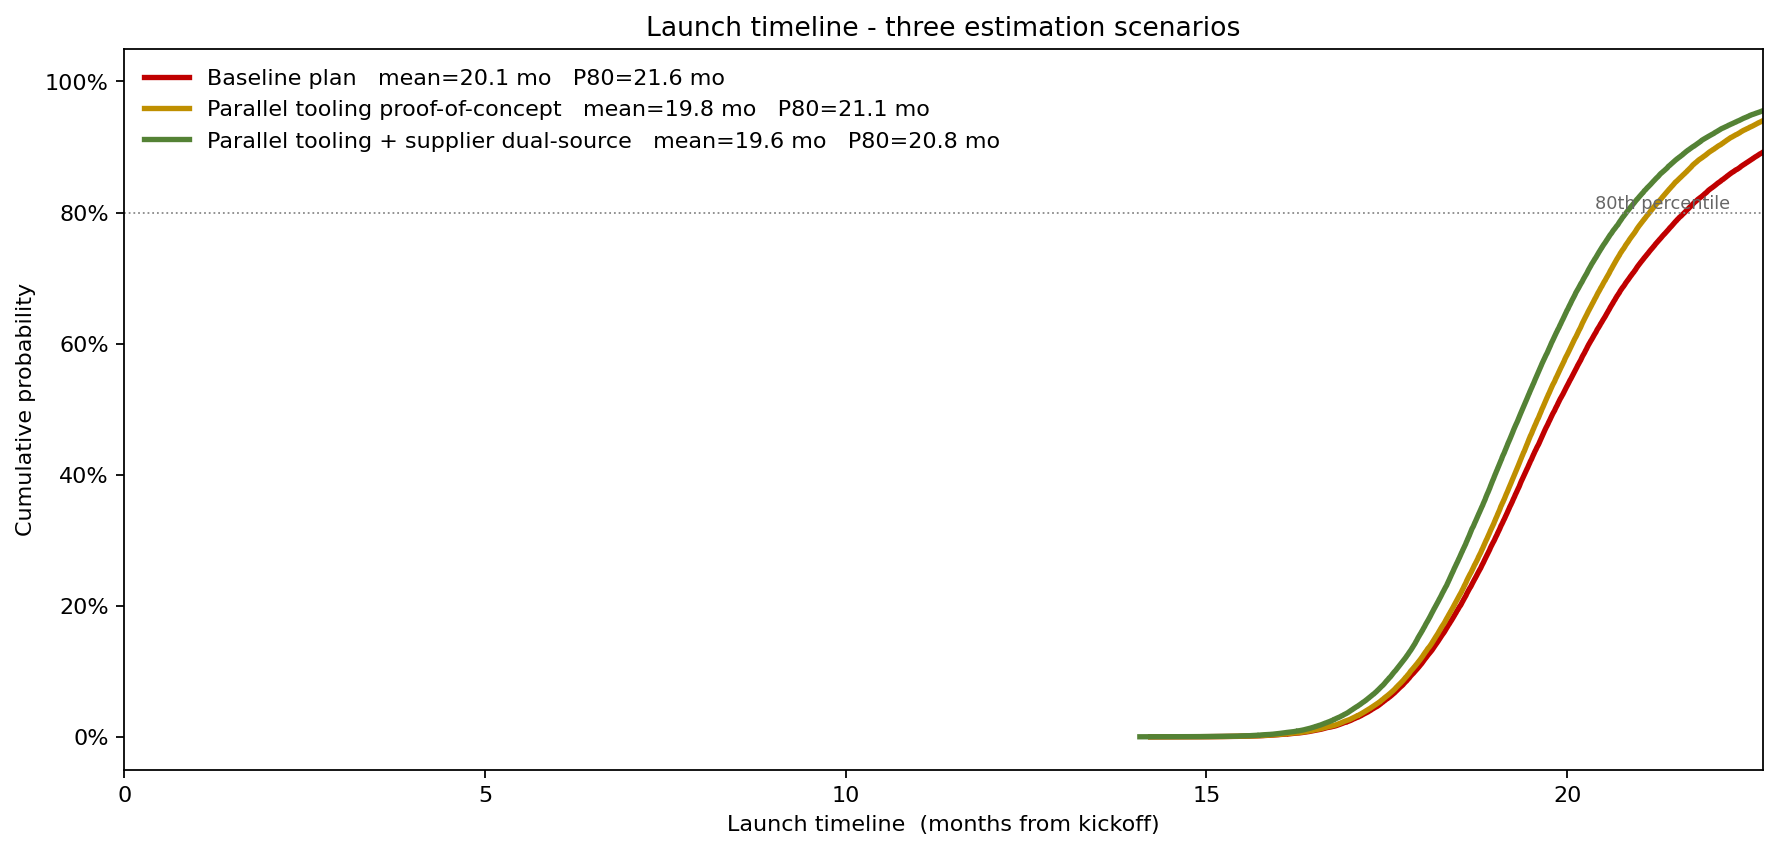
The combined plan pulled the P50 from 19.8 to 19.4 months and the P80 from 21.6 to 20.8 months. Total cost of the two pull-ins: $0.9M; expected avoided launch-slip exposure (at $1.2M per slipped month, board-approved cost-of-delay): $3.2M. Approved.
Pricing the contingency
The single number that matters most to the board is the gap between what you commit to and what you actually believe. Probabilistic timeline estimation makes that gap explicit:
| Committed date | Confidence | Contingency vs. P50 |
|---|---|---|
| 18 months (original pitch) | 11% | -1.8 months (negative) |
| 19.8 months (P50) | 50% | 0 |
| 21.6 months (P80) | 80% | +1.8 months |
| 22.8 months (P90) | 90% | +3.0 months |
The program manager committed externally to 22 months (≈P80) with a P50 internal target of 19.8 — a discipline that turned launch-slip surprises from "the program is late" to "the program is in its expected band."
What changed
- External commitment moved from 18 months (P11) to 22 months (P80) with an internal P50 target of 19.8 months, eliminating the systematic launch-slip pattern that had cost ~$1.8M/year in liquidated damages over the prior four programs.
- $0.9M in concentrated pull-in spend (parallel tooling + dual-source) cut the P80 by 0.8 months, an EV gain of $3.2M.
- Program-management dashboard restructured around current P50/P80 forecast vs. previous-month P50/P80, replacing the "% complete" measure that all four prior programs had hit 100% on while shipping six months late.
ModelRisk Functionality Used
- BetaPERT and LogNormal task duration distributions fitted from the firm's four-year program-launch historian — using mean = exp(μ + σ²/2) for the lognormal tasks, not the mode that the deterministic plan had been using.
- Bernoulli + PERT-conditional treatment for the tooling-redesign and homologation-resubmission risk events, with the conditional severity correctly captured rather than averaged into the base duration.
- Merge-bias-aware path aggregation computing the max of parallel uncertain paths rather than the max of their point estimates — alone responsible for ~0.8 months of P50 correction.
- S-curve output that surfaced the 11% confidence figure on the original commitment and re-framed the board conversation around the P80.
- Tornado over P80 timeline that prioritized parallel-tooling proof-of-concept ($0.3M cost, ~5.2 weeks P80 pull-in) as the highest-return pull-in investment.
A deterministic timeline is one realization out of many. Monte Carlo simulation in ModelRisk converts "18 months" into "P50 = 19.8 months, P80 = 21.6 months, with the gap and the dominant drivers named" — the only honest answer to the question "when will it finish?"