

Industry: Project Management
Product: ModelRisk
Application: Resource Allocation Under Uncertainty
Allocating 36 FTE-Years Across 6 Pharma Projects: A Portfolio NPV Problem
A drug-development portfolio with six active projects requires 47 FTE-years of chemistry, formulation, clinops and regulatory time over the next twelve months. The available pool is 36 FTE-years. The portfolio is over-subscribed by 30% — every allocation decision is a trade-off, every project that gets cut back loses NPV through delay-driven decay (roughly 6% of NPV per month of delay-to-market on protected indications), and the technical success probabilities range from 25% to 50%. The deterministic answer — "fund the highest-NPV projects first" — is intuitive, and it does post the highest expected NPV. What a single-number ranking hides is the price of that upside: concentrating resource in the two largest projects also produces the worst downside if either fails its technical-success gate. Whether that bet is worth taking is a question about the shape of the outcome distribution, not about a point estimate — and that shape only appears when the portfolio is simulated.
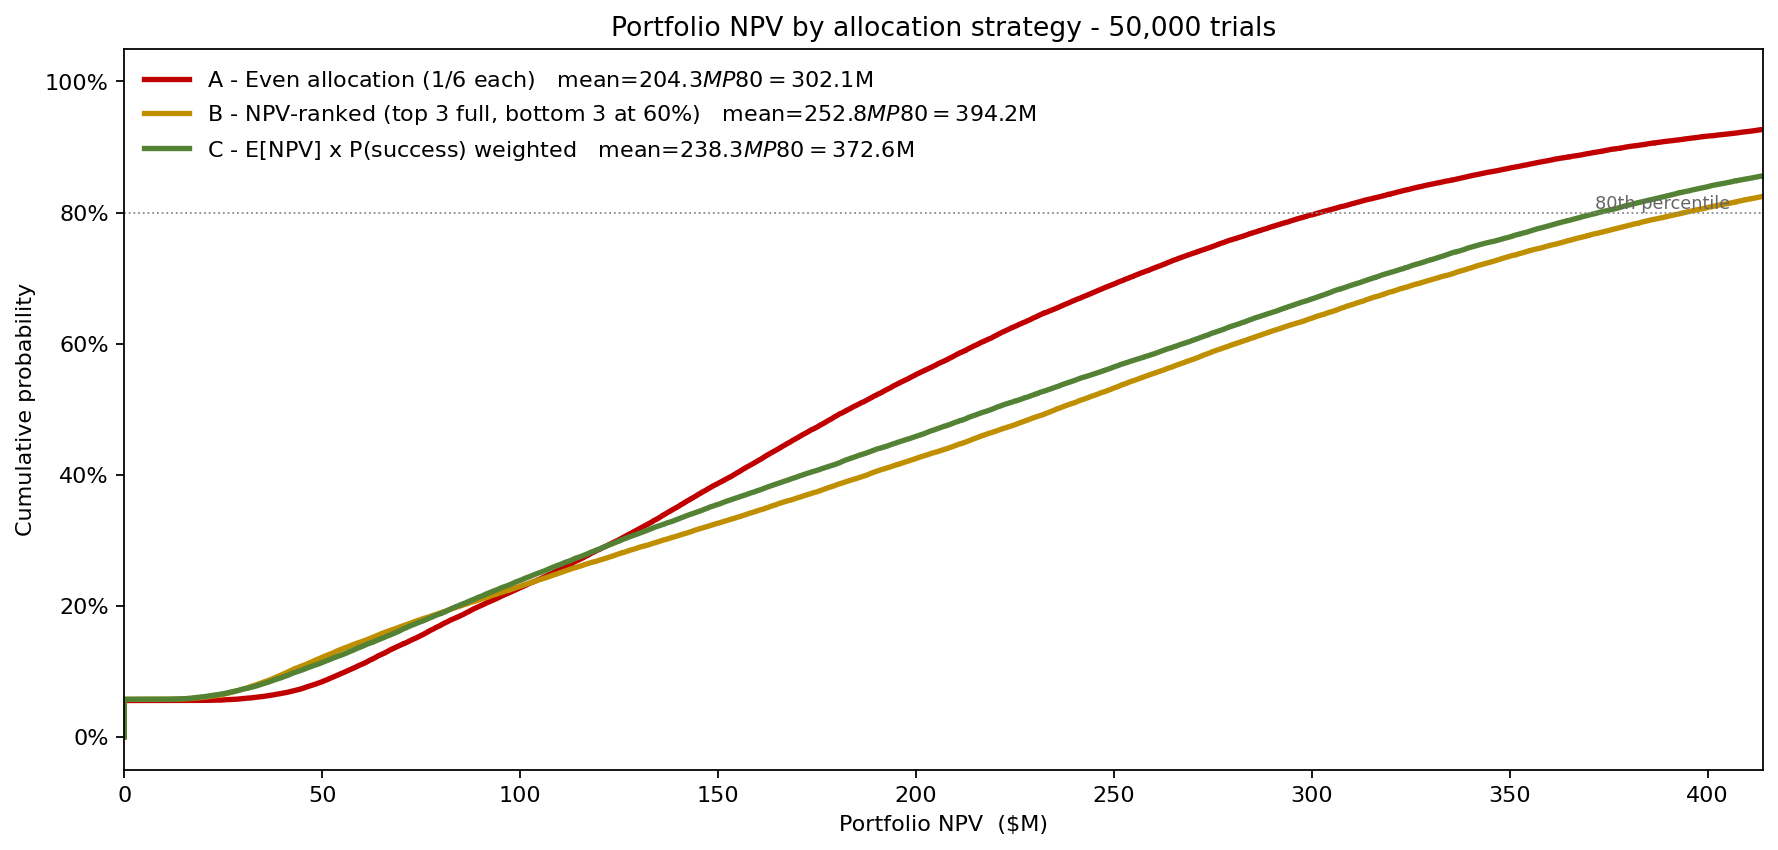
A mid-cap pharma R&D portfolio manager rebuilt the allocation decision in ModelRisk. Three strategies were simulated against the same uncertainty stack — even allocation, NPV-ranked, and E[NPV] × P(success) weighted — and the simulation produced portfolio-NPV distributions the executive committee could read against each other. The chart below is the whole argument in one frame: three allocation policies, three full distributions of portfolio NPV across 50,000 trials, with the P80 marked on each.
Six projects, three numbers each
| Project | Full-resourcing NPV ($M) | NPV sigma_log | P(tech success) | FTE need |
|---|---|---|---|---|
| Onc-A (oncology, late) | LogN(220, 0.30) | 0.30 | 0.45 | 12 |
| Onc-B (oncology, mid) | LogN(140, 0.40) | 0.40 | 0.30 | 9 |
| CV-1 (cardio, mid) | LogN(95, 0.35) | 0.35 | 0.50 | 7 |
| Resp-2 (respiratory) | LogN(70, 0.45) | 0.45 | 0.40 | 6 |
| Infl-3 (inflammation) | LogN(110, 0.40) | 0.40 | 0.35 | 8 |
| Rare-4 (rare disease) | LogN(180, 0.55) | 0.55 | 0.25 | 5 |
| Total FTE need | 47 |
NPVs are LogNormal because positive drug-NPV outcomes have a long right tail — a blockbuster doubles the NPV mode, a failed Phase III takes it to zero — and the Bernoulli technical-success draw handles the binary commercial failure. The shortfall mechanic is the modelling pivot: when a project gets less FTE than it needs, two things happen to its NPV at the same time. Scope scales by (allocation / need) ^ 0.5 (diminishing returns to FTE), and time-to-market slips by roughly 1.6 months for every FTE short, with NPV decaying at 0.94 per month of delay — the standard pharma erosion-of-patent-life heuristic.
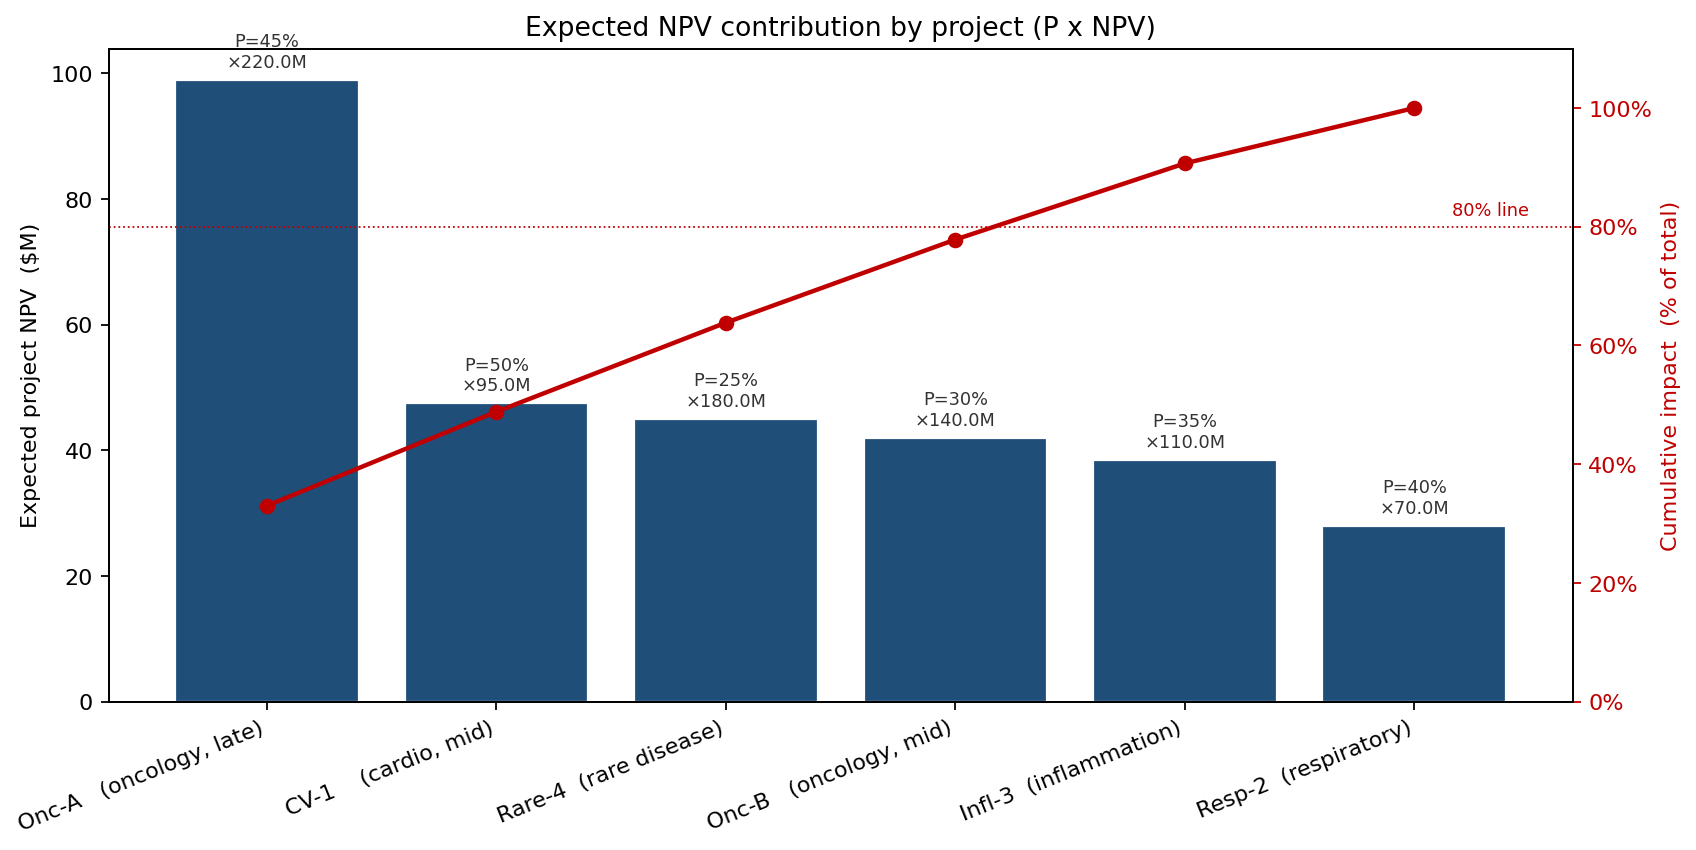
The expected-NPV Pareto shows that Onc-A alone carries about a third (33%) of the expected portfolio value, and the top three projects by expected contribution — Onc-A, CV-1 and Rare-4 — carry roughly 64%. Note the ordering: CV-1 ranks second on expected NPV despite having only the third-largest headline NPV, because its 50% success probability is the highest in the portfolio. The naive NPV-ranked strategy instead reads the face NPVs and locks in Onc-A, Rare-4 and Onc-B — over-prioritising Rare-4 without fully correcting for its 75% chance of zero NPV.
Three allocation strategies, three distributions
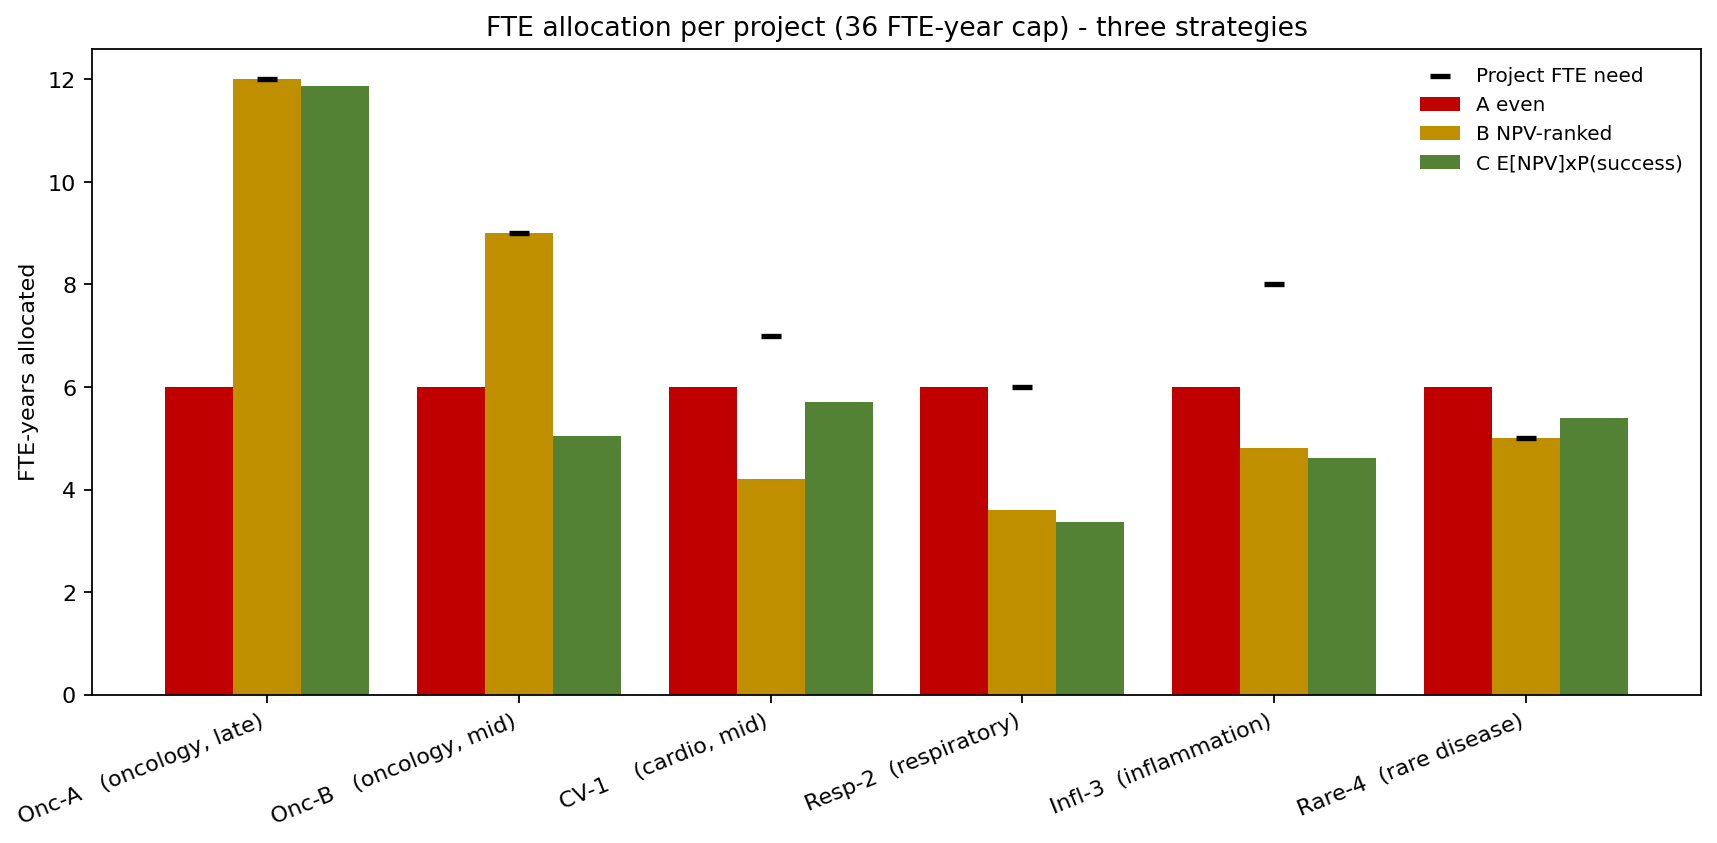
The chart marks each project's actual FTE need with a black tick. The even allocation (red) under-resources every project — Onc-A gets 6 FTE against a 12 FTE need; Rare-4 is over-resourced by 1 FTE. NPV-ranked (amber) fully resources the top three and starves CV-1, Resp-2 and Infl-3. The E[NPV] × P(success) strategy (green) tracks each project's expected contribution to the portfolio, allocating more to high-success-probability projects like CV-1 (P = 0.50) than the pure NPV ranking would.
What the simulations say
Reading from the CDFs:
- Strategy A (even) lands a P50 of about $183M and a P80 of about $302M, with a mean of $204M. It has the narrowest spread and — importantly — the best downside, with a P10 of $56M, because spreading the FTE thinly keeps every project partly alive. But under-resourcing all six applies the scope-and-delay penalty across the board, so it has the lowest central tendency and the thinnest upside.
- Strategy B (NPV-ranked) is the highest expected-value plan: a P50 of about $236M, a P80 of $394M, and a mean of $253M. Full resourcing of the three largest-NPV projects buys the most upside in the portfolio. The price is the worst downside of the three — a P10 of just $42M — because if Onc-A or Rare-4 fail their Bernoulli, the portfolio falls back on barely-funded second-tier projects.
- Strategy C (E[NPV] × P(success)) sits between them: a P50 of about $219M, a P80 of $373M, a mean of $238M, and a P10 of $44M. It gives up roughly $15M of mean NPV against the NPV-ranked plan in exchange for a marginally better floor and a more even spread of bets across higher-success projects.
The chart's most-informative reading is the tail: the probability of clearing $500M of portfolio NPV is 3% for the even strategy, 9% for NPV-ranked, and 7% for E[NPV] × P(success). There is no free lunch here — the plan with the most upside (B) also carries the most downside, and the plan with the best floor (A) gives up the most expected value. That trade-off is invisible to a deterministic ranking and only legible once the three policies are simulated against the same uncertainty.
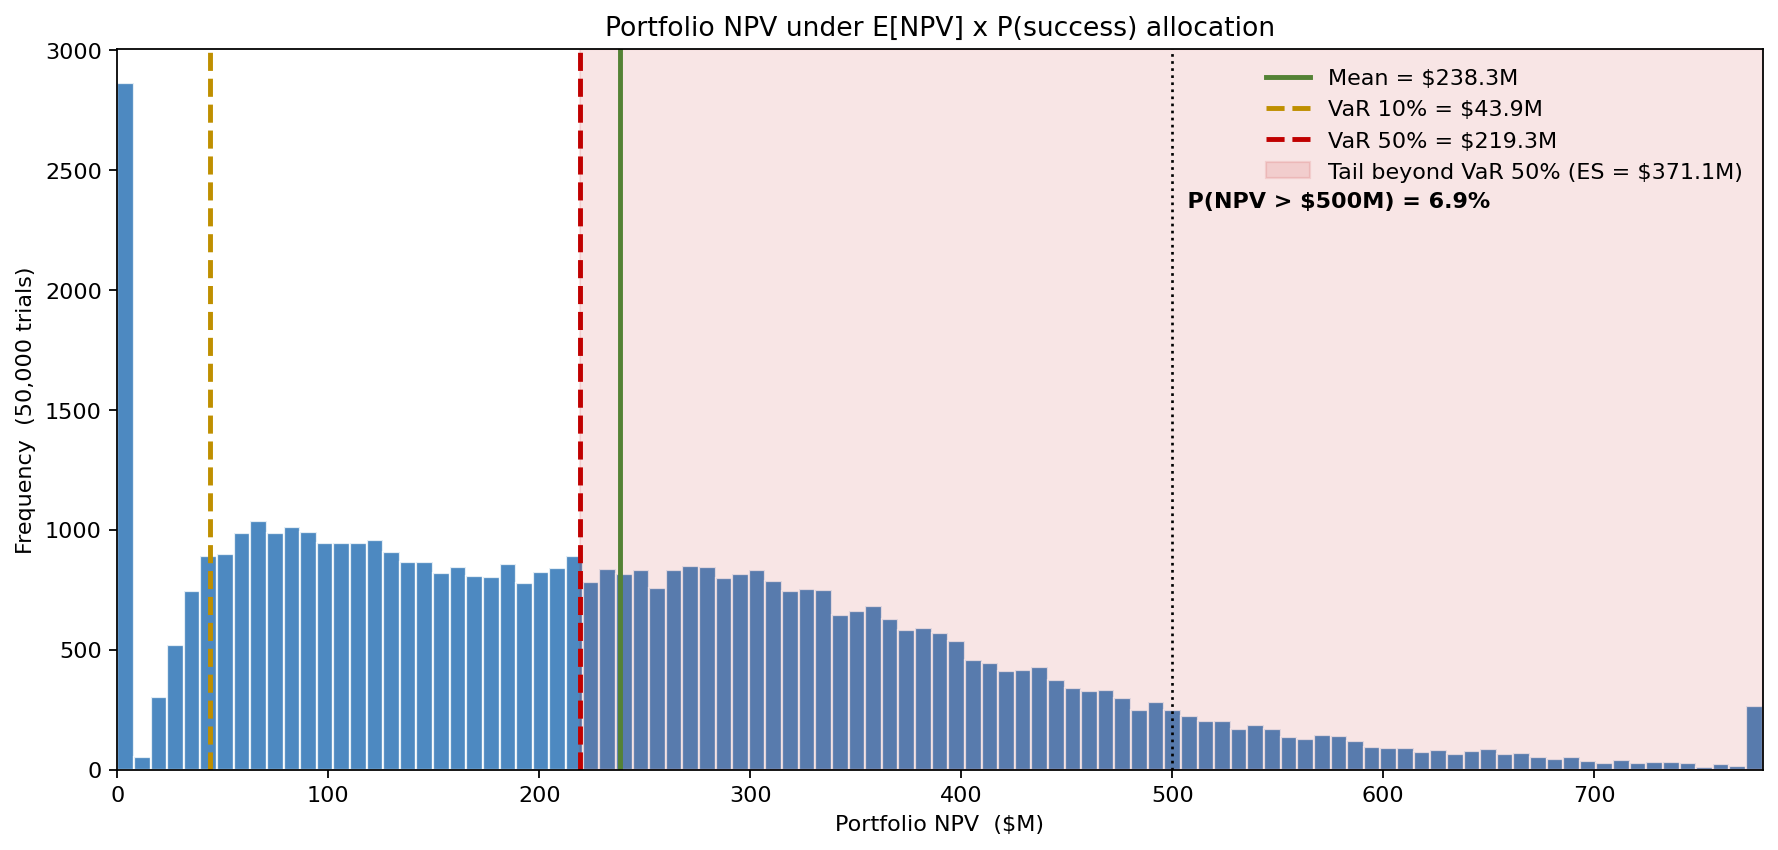
The distribution for Strategy C is multimodal — visible humps from the technical-success Bernoulli draws across the six projects — and the mean ($238M) sits well above the median ($219M) because of the LogNormal upside captured by the small-probability success of Rare-4 and the long right tail on Onc-A.
What the model changed
- The allocation was approved as Strategy C — a deliberate trade of expected value for a better floor. The executive committee was shown the three CDFs side by side. The NPV-ranked plan posted the highest mean ($253M) and the fattest upside, but its P10 of $42M — driven by the concentration of resource in two projects with sub-50% success gates — was judged too exposed for a portfolio carrying the firm's near-term pipeline. Strategy C gave up about $15M of mean NPV for a marginally better floor and a more even spread of bets.
- The "go all-in on the two biggest" instinct was challenged, not endorsed. The CFO had been advocating Strategy B on first-principles NPV grounds, and the chart confirmed it does maximise expected value — but it also made the concentration risk explicit: the steepest left tail of the three, the portfolio falling back on barely-funded second-tier projects whenever Onc-A or Rare-4 missed.
- CV-1 was upgraded from second-tier to top three by expected contribution. Its 0.50 success probability — the highest in the portfolio — made it carry more expected value than Onc-B despite the lower headline NPV. Under Strategy C it received near-full resourcing (5.7 of 7 FTE); under the face-NPV ranking of Strategy B it was starved to 4.2.
- An FTE-flexibility buffer was approved. The committee reserved 3 FTE-years of contract clinops capacity as an in-year reallocation buffer, sized against the gap between the P50 and P80 portfolio outcomes in the simulation — a contingency on the contingency.
ModelRisk functionality used
- Per-project NPV as LogNormal × Bernoulli — separating commercial size (long right tail) from technical success (binary failure), which a single Normal cannot represent.
- Scope-and-delay penalty function on resource shortfall —
(alloc/need)^0.5for scope,0.94^delay_monthsfor time-to-market decay — applied per iteration per project. - Strategy comparison on a shared seed so that the difference between the three CDFs is attributable to allocation choice, not to Monte Carlo noise.
- Joint portfolio rollup — six per-project NPV draws summed per iteration, producing the full portfolio NPV distribution.
- Pareto of expected contribution that ranked projects by E[NPV] (P × NPV) rather than by face NPV — the input that elevated CV-1 above Onc-B in the allocation.
- P50, P80 and probability-threshold outputs in the format the executive committee reads — the chart that replaced a single-number portfolio-NPV recommendation.
Resource allocation in an oversubscribed portfolio is not a sorting problem. It is a stochastic trade-off where the rank of a project depends on its success probability as much as on its NPV, and where the highest-expected-value plan is not automatically the right one once its downside is on the table. The chart that lets a committee weigh expected value against the floor exists only when the portfolio is simulated, not when it is ranked.