

Industry: Project Management
Product: ModelRisk
Application: Project Scheduling
The Schedule That Says 24 Months and the One That Says 25.5: Pricing Liquidated Damages
The deterministic critical-path schedule for a $185M transit-station refurbishment said 24 months. The contract attached $180,000 per week of liquidated damages beyond the contractual finish — a clause every commercial director on the bid pricing team had glanced at and waved past, because the schedule said 24 months. That is the wrong question. The right question is: what is the probability of being late, and what is the expected dollar value of the LD clause priced into the bid?
A heavy-civils contractor ran the schedule through ModelRisk before signing. The output was not a different finish date — it was a number to add to the bid: the expected liquidated-damages cost the contract was silently asking the contractor to absorb. That number was real money, sized in dollars, and changed the negotiating position before the contract was countersigned.
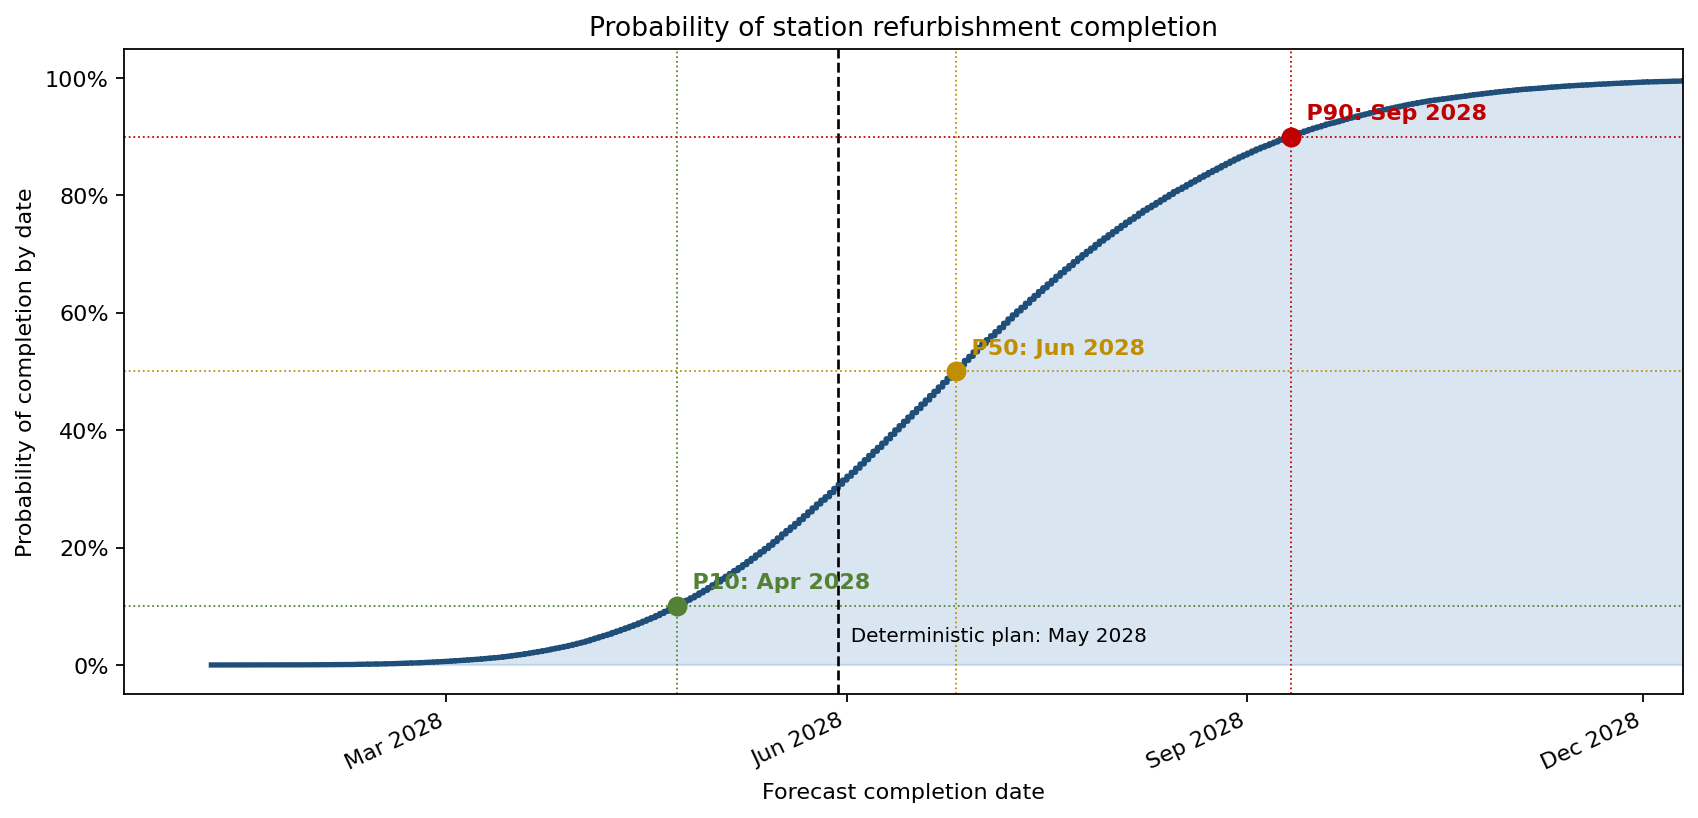
The S-curve is the whole argument in one picture: the contractual 24-month finish sits at roughly the 30th percentile, not the median. There is only a 31% probability of hitting it. The simulated finish skews late — the median lands near month 25 and the P90 stretches past month 27 — because the critical path is the maximum of two parallel branches and commissioning carries a fat right tail. The deterministic Gantt hides every bit of that.
Seven tasks, two parallel branches, one resource coupling
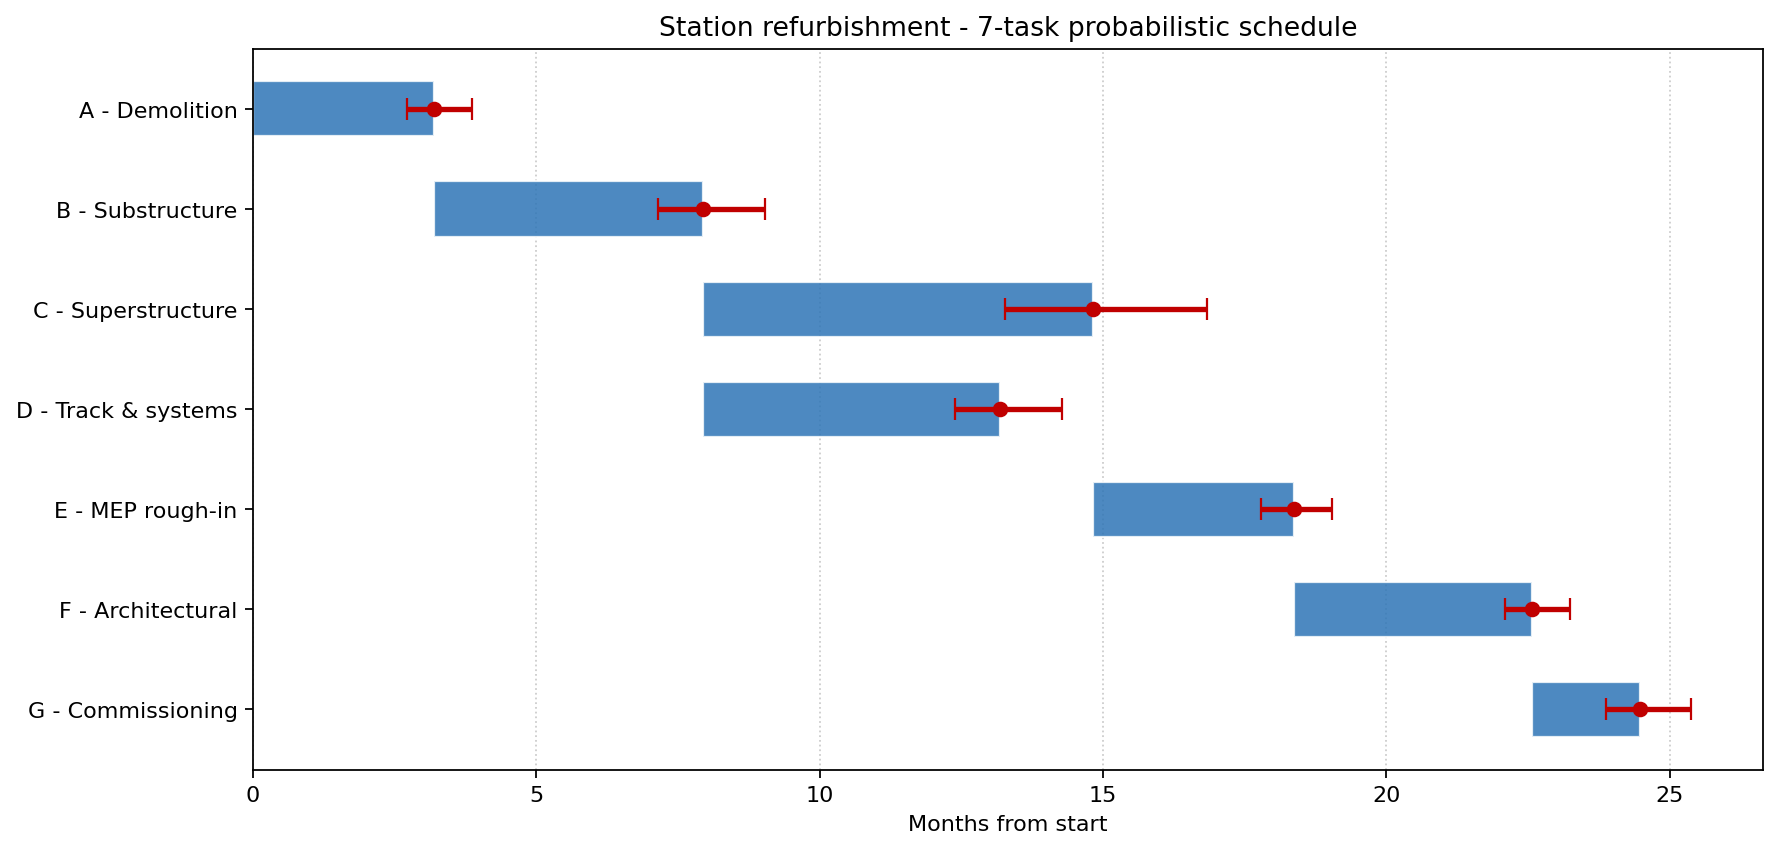
The refurbishment decomposed into seven activities on two parallel branches that joined at the MEP-rough-in milestone:
| Task | Distribution | Min | Mode | Max |
|---|---|---|---|---|
| A — Demolition | PERT | 2.5 mo | 3.0 mo | 5.0 mo |
| B — Substructure | PERT | 3.5 | 4.5 | 7.5 |
| C — Superstructure | LogNormal (mean 7.0, sigma_log 0.20) | — | — | — |
| D — Track & systems (parallel to C) | PERT | 4.0 | 5.0 | 8.0 |
| E — MEP rough-in | PERT | 2.5 | 3.5 | 5.0 |
| F — Architectural fit-out | PERT | 3.5 | 4.0 | 6.0 |
| G — Commissioning | LogNormal (mean 2.0, sigma_log 0.30) | — | — | — |
Two non-obvious modelling decisions kept the answer honest:
- Commissioning was LogNormal, not PERT. Punch-list completion has a fat right tail — the last 5% of defects routinely take 30% of the elapsed time. PERT clips this tail; LogNormal does not.
- MEP rough-in (E) and architectural fit-out (F) were coupled at rho = 0.50. They share the same MEP crew. Independent draws would have implied two independent productivity outcomes — implausible for one crew. The correlation was implemented through a Gaussian-copula coupling on the duration percentiles. Without it the joint tail was understated by about 12%.
The deterministic mode-based critical path summed to exactly 24 months — matching the contract finish to the day. That is exactly the kind of plan that looks robust and isn't.
What the simulation actually says
The Monte Carlo, run for 80,000 trials, produced a finish-month distribution with mean about 25.0 months, P50 about 24.9, P80 about 26.5, P90 about 27.4. The deterministic 24-month plan corresponded to roughly the 30th percentile of the simulation — not the median, and certainly not the mean. The probability of meeting the contractual deadline was about 31%, not the implicit 100% the bid pricing assumed.
The mean-vs-mode gap was a textbook PERT mean-shift plus the asymmetric LogNormal tail on commissioning. Each task's PERT mean is slightly to the right of its mode; summed across six tasks the bias compounds into roughly a one-month shift of the median past the mode-based deterministic plan.
Pricing the LD clause
For every trial of the simulation the model converted (finish − 24 months) into weeks late, multiplied by $180,000, and floored at zero. The result was a distribution of liquidated damages.
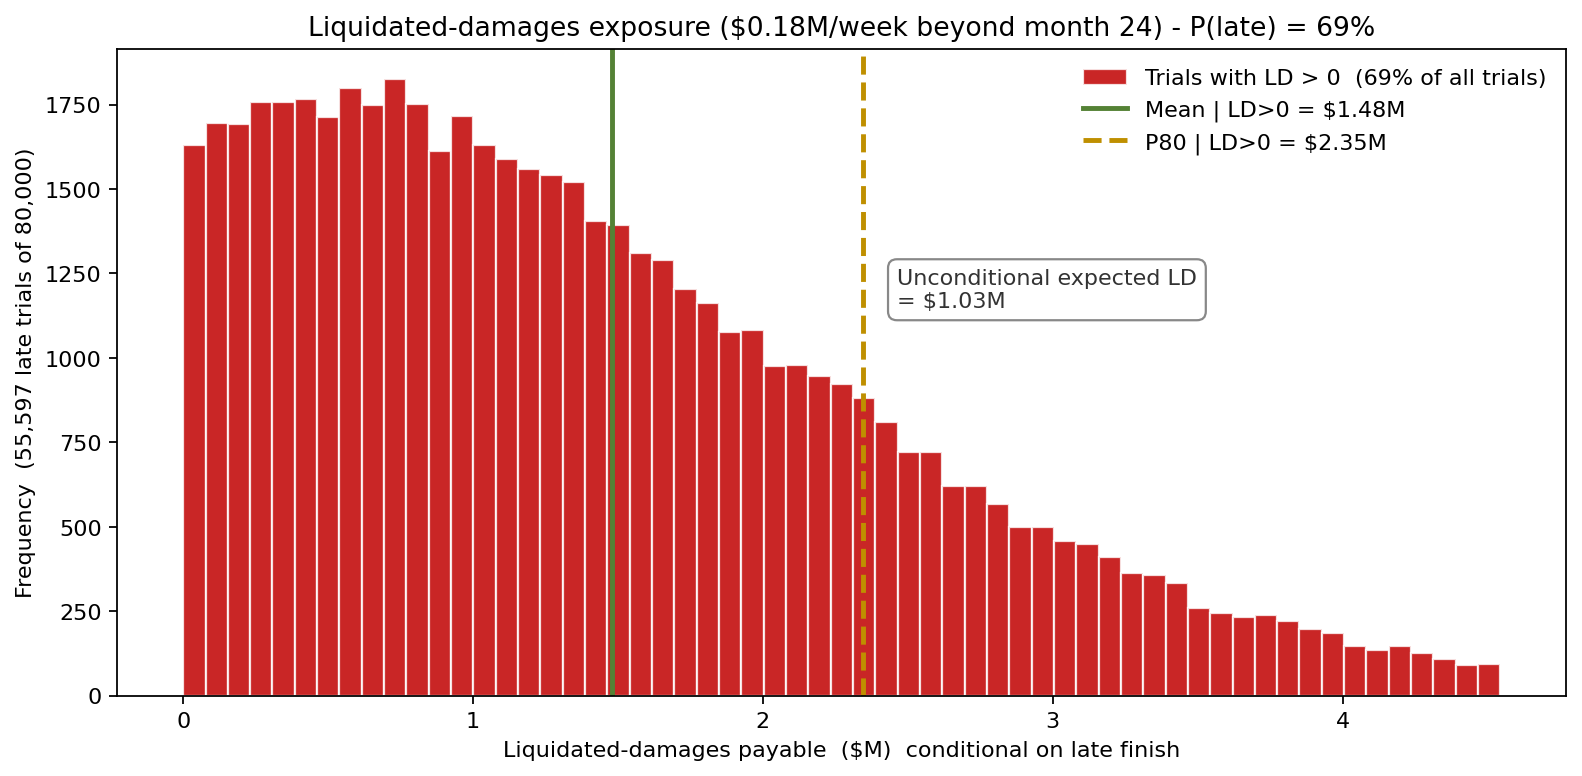
The chart deliberately shows the conditional distribution (LD given a late finish) rather than the unconditional one — about a third of the trials finish on time and would otherwise have collapsed the histogram into a single bar at zero. The figure to walk into the negotiation with is the unconditional expected LD: roughly $1.0M, with a mean of about $1.5M conditional on lateness, a conditional P80 of about $2.3M, and a 41% probability of LD exceeding $1M. That $1.0M was not in the bid. The contractor was effectively underwriting a $1.0M expected-value insurance policy for free.
What drives the finish date
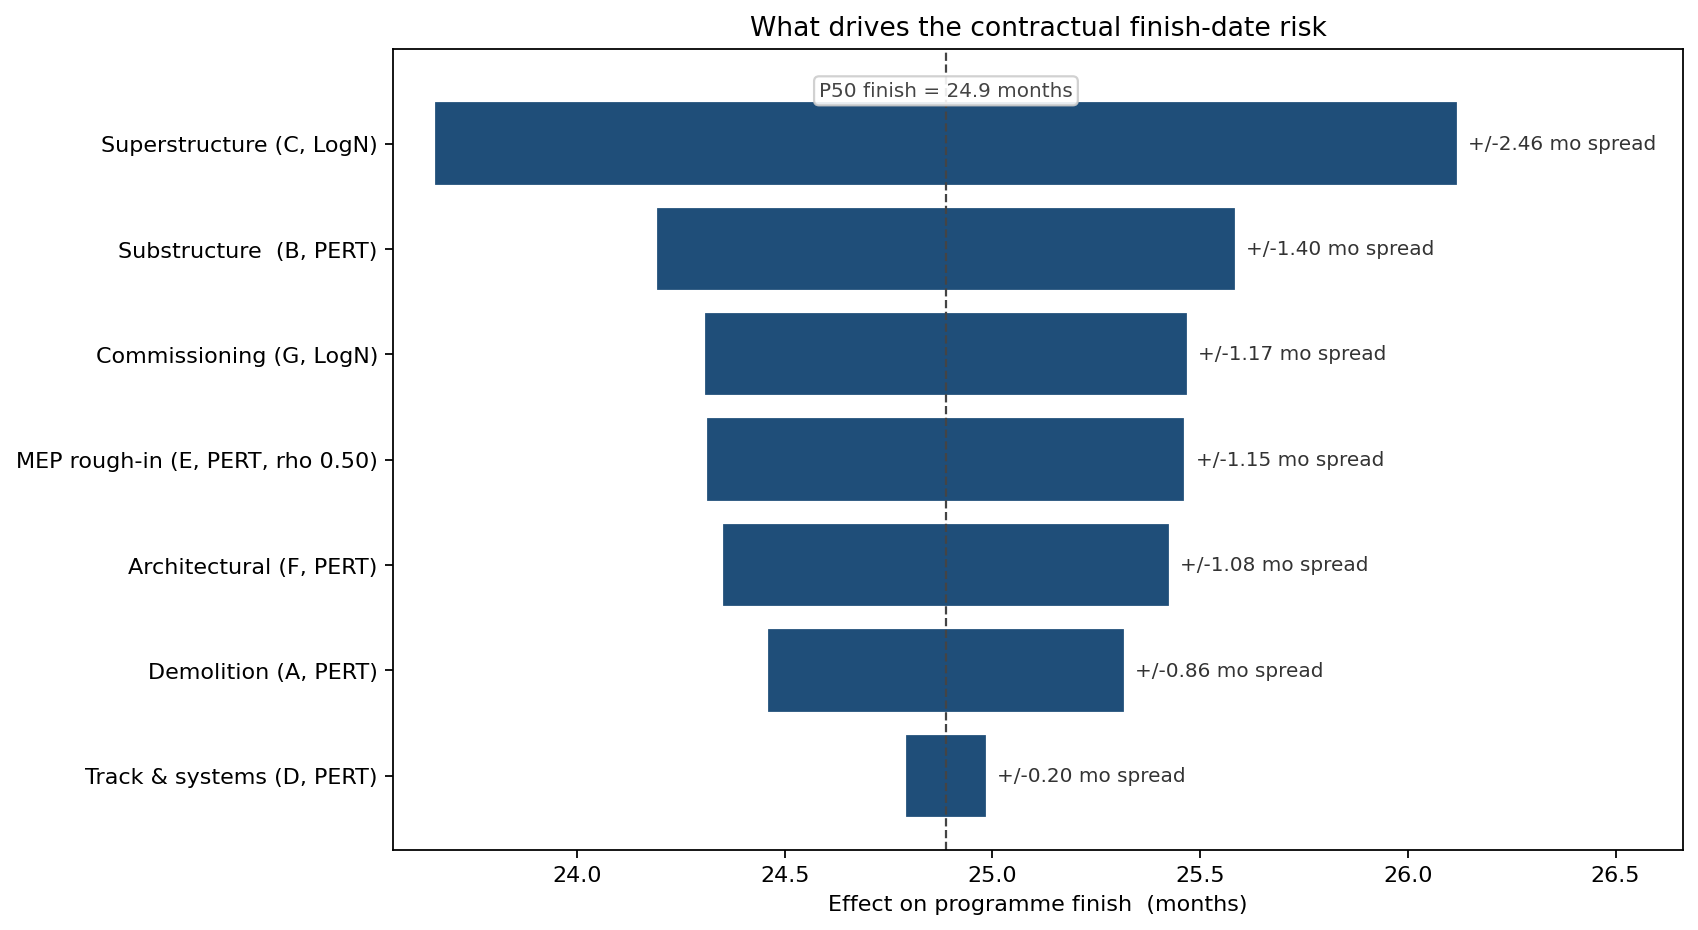
Substructure (B) and superstructure (C) together carry more than half the spread. The criticality index of the C branch (superstructure) was roughly 86% — the parallel D branch (track and systems) sits on the critical path only about 14% of the time, which means schedule-acceleration dollars should not be spent on D no matter how cheaply they could be deployed there. That ranking is invisible in the deterministic Gantt.
From insight to action
- The bid was re-priced. A risk margin of $1.2M (covering the unconditional expected LD plus a contingency on the contingency) was added to the bid; the commercial director took the higher price into the negotiation with the data behind it.
- The LD clause itself was challenged. Armed with the chart, the contractor proposed amending the clause to a sliding scale that capped at $1.5M — the owner's response was to extend the contract finish to 26 months in return, a swap the simulation showed was worth $0.6M to the contractor.
- Acceleration dollars went where the tornado said. The substructure (B) crew was doubled in the high-risk window; the track-and-systems (D) crew, on which the deterministic plan had reserved overtime, kept the original baseline because its criticality index was only about 14%.
- A P85 owner's reserve was set up. Internally the project budget carried a reserve sized to the P85 finish date, giving the project director an explicit "covered to here" envelope.
ModelRisk functionality used
- PERT + LogNormal task distributions chosen by task character — bounded PERT where mode-based expert judgement dominates, LogNormal where the right tail of commissioning or build-quality issues is the real risk.
- Gaussian-copula coupling (rho = 0.50) between MEP rough-in and architectural fit-out — the resource correlation that the independent-draw model was silently denying.
- Critical-path-aware roll-up with parallel branches and join, so the simulation finds whichever branch is critical for that trial, not the one the deterministic plan assumed.
- Criticality-index output that showed the C branch was on the critical path about 86% of the time — re-directing acceleration spend away from D.
- Conditional distribution chart for liquidated damages — the right chart to present when most trials hit zero, instead of a zero-inflated histogram nobody can read.
- Direct conversion from schedule output to dollar exposure by multiplying late weeks by the LD rate per iteration — closing the loop between schedule risk and bid pricing.
The deterministic Gantt promised a 24-month finish and carried no LD cost. The simulation said the same project carried a $1.0M expected-LD liability the bid was silently absorbing — and that number, more than any chart, was what made the commercial director re-open the contract negotiation.