

Industry: Project Management
Product: ModelRisk
Application: Project Phasing
Sequential or Overlapped? Phasing a $2.4B Transit Programme Under Uncertainty
Transit megaprojects run 20–50% over their announced schedules — that is the published track record across the last two decades of urban-rail builds. The question every programme director asks at the front-end is not whether the schedule will slip but which phasing strategy will absorb the slip best: sequential phases that take longer in the deterministic plan but isolate failures, or overlapped phases that look faster on paper but couple resource constraints across phases. The deterministic Gantt cannot answer the question, because the deterministic Gantt assumes durations are durations rather than draws from distributions.
A municipal authority planning a $2.4B four-phase metro extension rebuilt its scheduling model in ModelRisk. The output was not a recommendation of one strategy over the other; it was a chart of two cumulative distributions, with the P50 and P80 finishes for each strategy plotted on the same axis. The board chose the strategy by reading the whole curve, not a single milestone.
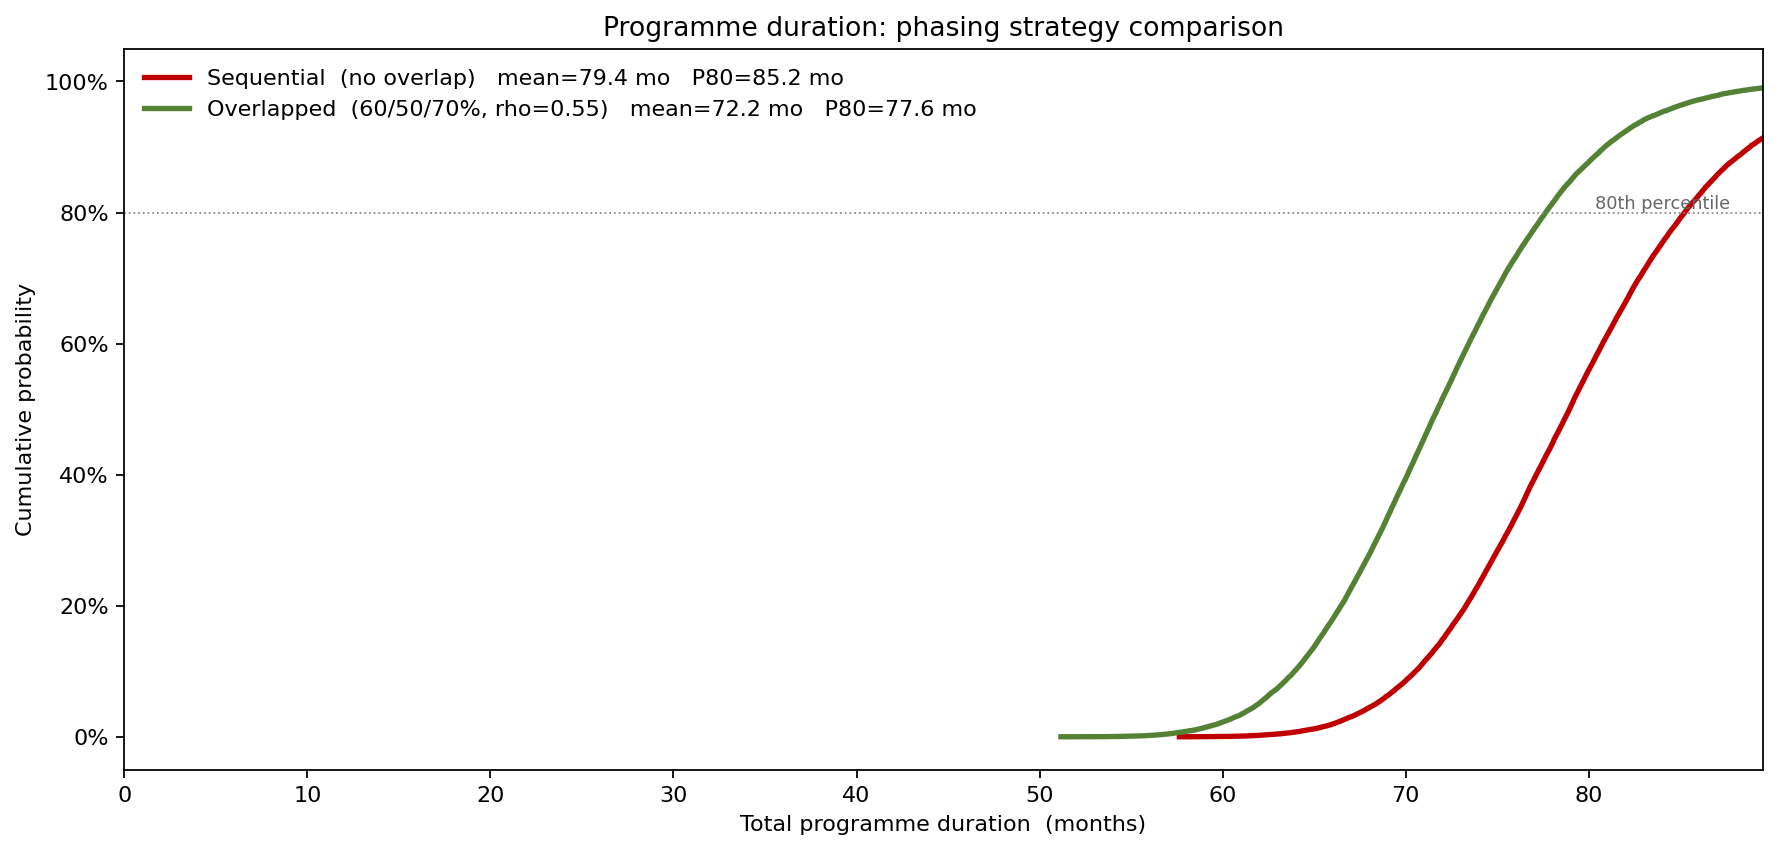
Against a 78-month contractual commitment to opening day, the two curves separate cleanly. The overlapped strategy lands a P50 of about 72 months and a P80 of about 78 months; the sequential strategy lands a P50 of about 79 months and a P80 of about 85 months. The overlapped plan carries an 81% probability of meeting the 78-month commitment against 45% for sequential — a gap the deterministic Gantt, which shows only a flat six-to-seven-month difference, cannot express. The rest of this study is how that chart was built and what it changed.
The four phases and their distributions
The programme decomposed into four phases, each with a distribution defended against historical transit-build data:
- Phase 1 — Tunnel boring: LogNormal, mean 30 months, sigma_log = 0.20. Geotechnical surprises produce a right tail (delays from a stuck TBM, dewatering complications); nothing systematic accelerates a tunnel below its base rate.
- Phase 2 — Track and systems install: PERT (14, 18, 26) months. Bounded above by an absolute maximum the technology imposes; expert elicitation gives a clean mode at 18 months.
- Phase 3 — Stations and finishes: PERT (18, 22, 30) months.
- Phase 4 — Commissioning and handover: LogNormal, mean 8 months, sigma_log = 0.30. Punch-list completion has a fat tail — the last 5% of defects can carry 30% of the elapsed time.
The non-obvious modelling decision was the coupling between Phase 2 and Phase 3 in the overlapped strategy. The two phases share the same MEP crews and the same off-peak track-access windows; when Phase 2 runs long, Phase 3 runs long too. The model used a rank-correlation of rho = 0.55 between Phase 2 and Phase 3 durations during the overlap window — equivalent in spirit to a Gaussian copula on the duration percentiles. The coupling is the mechanism that turns the Phase-2/Phase-3 overlap from a free schedule saving into a managed risk: it is precisely the dependency a sum-of-independent-durations model would miss.
Two strategies, same uncertainty
The sequential strategy starts each phase only when its predecessor finishes. Programme duration = P1 + P2 + P3 + P4. Deterministic finish = 78 months.
The overlapped strategy starts each phase when its predecessor is 90% complete — a modest 10% overlap on each handover. Programme duration = max of the four staggered finishes. Deterministic finish = 71 months — seven months faster, on paper.
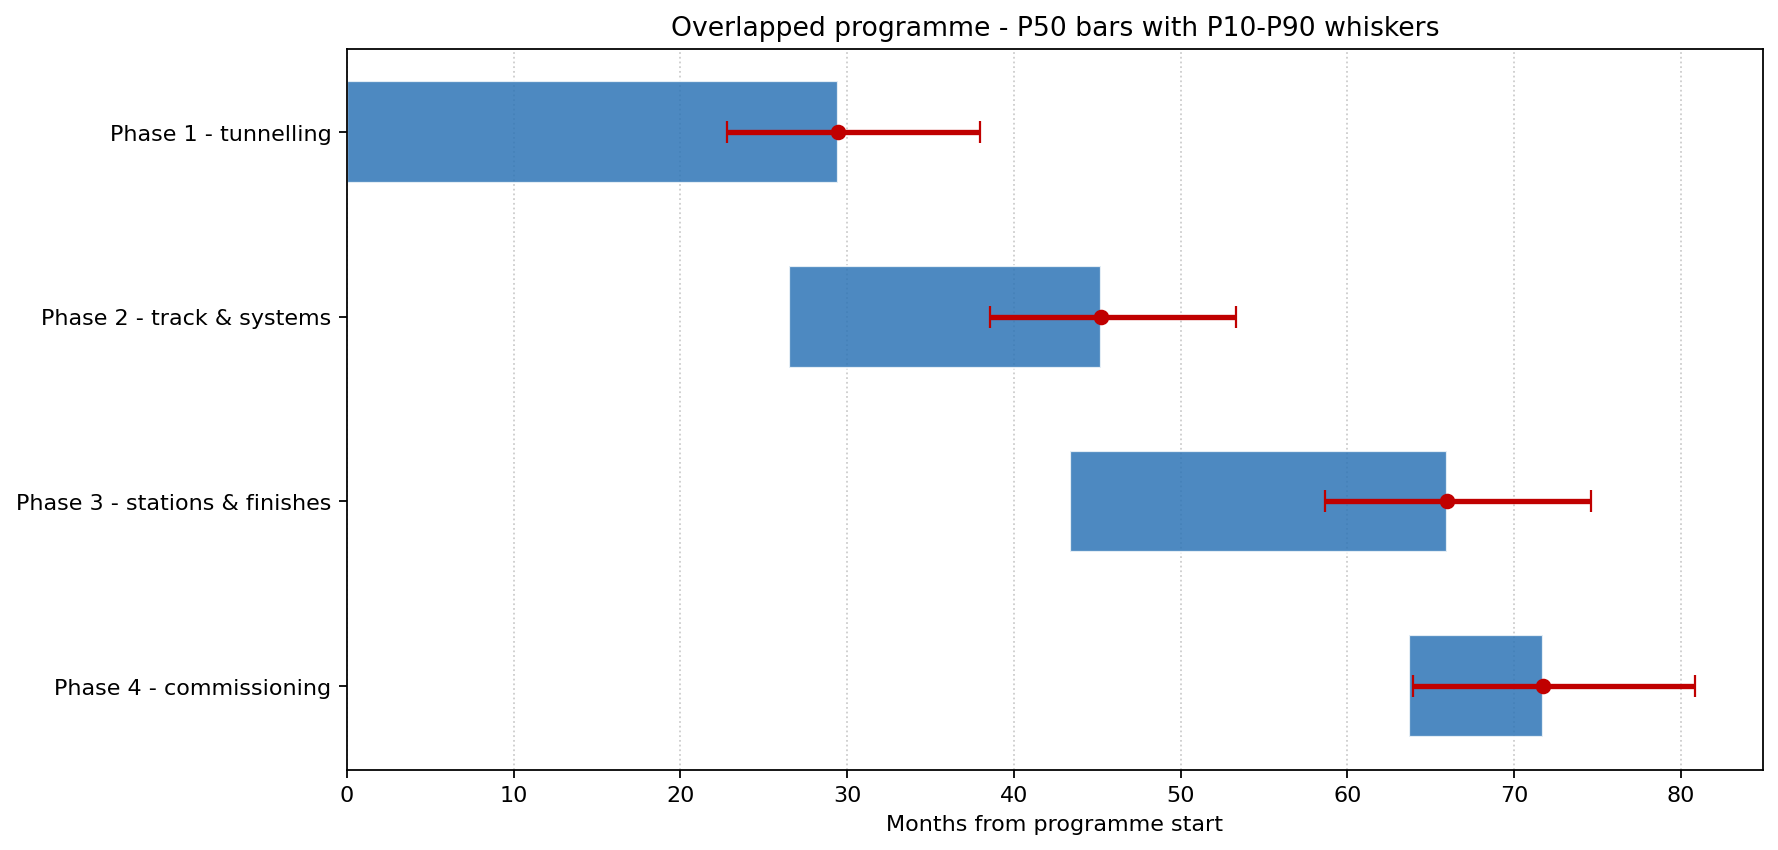
The Gantt shows where the uncertainty actually lives in the overlapped plan: the Phase-3 and Phase-4 finish whiskers are the widest in the programme — about 16 months of P10–P90 spread each — a direct consequence of the coupled Phase-2/Phase-3 risk that propagates into the commissioning start.
What the simulation says
The strategy-comparison CDF above told the board the headline: overlapped P50 ≈ 72 months versus sequential ≈ 79 months — a 7-month saving on the mean, exactly what the deterministic plan promised. But the value of the simulation is in the part the Gantt cannot show. The sequential strategy's P10-to-P90 gap is about 18 months; the overlapped strategy's is about 17 months — barely tighter, even though the overlap couples two phases that were otherwise independent. The resource contention very nearly cancels the certainty advantage that a naive overlap would have promised.
The board's actual question — "given a 78-month contractual commitment to opening day, which strategy gives the highest probability of meeting it?" — answered: overlapped strategy delivers 81% probability, sequential delivers 45%. Overlapping is the right call, but conditional on the Phase-2/Phase-3 resource contention being actively managed — without that management the coupled tail erodes the margin.
What drives the programme finish
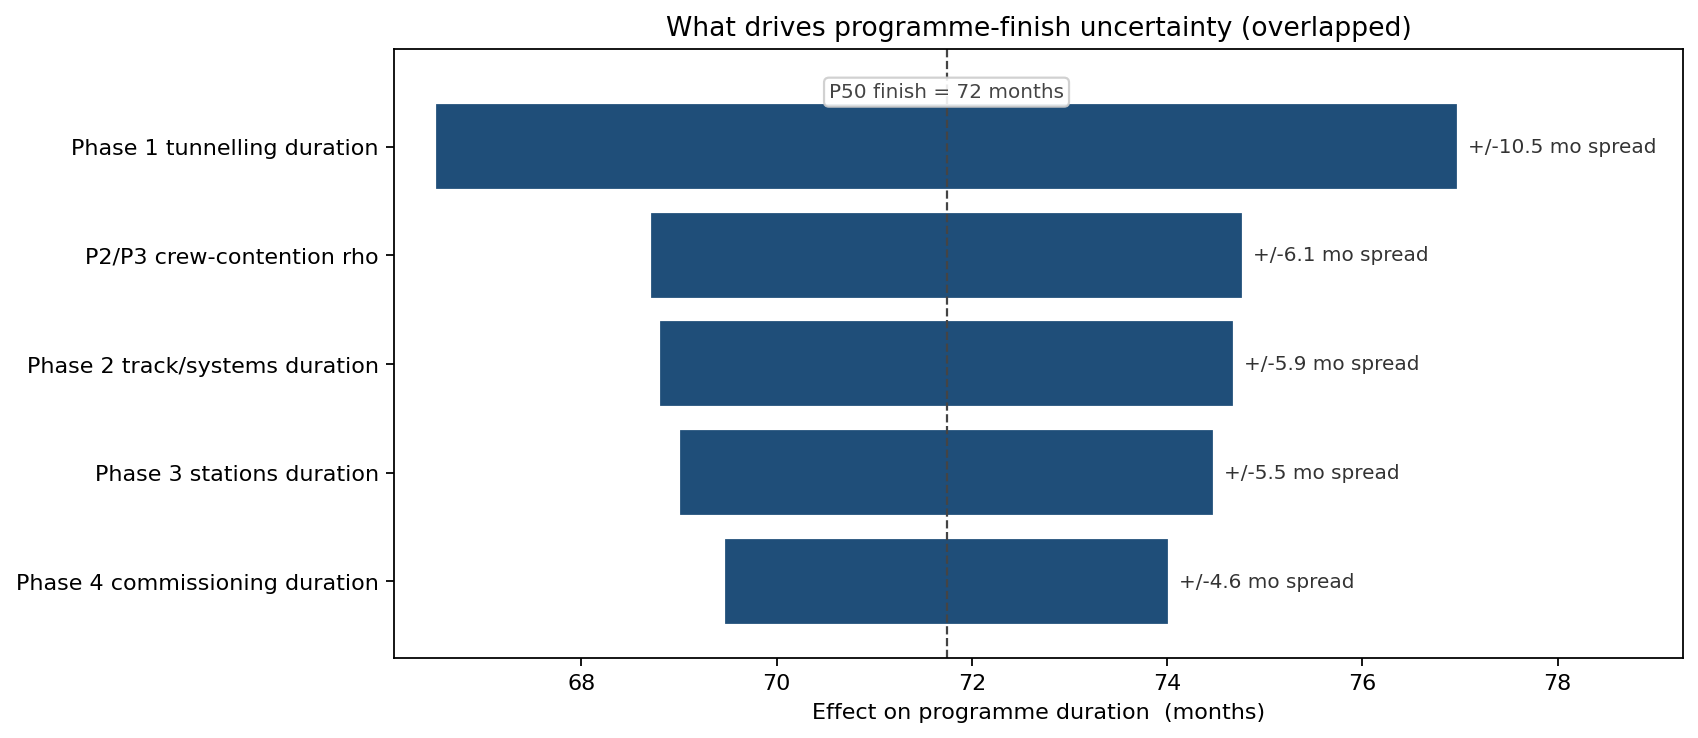
Phase 1 tunnelling is the single largest mover — its LogNormal sigma of 0.20 contributes about 5 months of half-spread to the programme finish, well clear of the field. The Phase-2/Phase-3 crew-contention coupling is the second-largest contributor, ahead of any single phase's own duration: the rho = 0.55 link turns two moderate uncertainties into one amplified joint risk. The chart re-directed the programme-management attention: instead of putting equal owners on each phase, the director assigned the most experienced delivery lead to tunnelling and a dedicated resource-contention manager to the Phase-2/Phase-3 overlap window.
What the model changed
- Strategy chosen with eyes open. The overlapped strategy was approved, but explicitly conditioned on the appointment of a Phase-2/Phase-3 resource-contention lead funded at $4M over the overlap window — sized to drop the correlation rho from 0.55 toward 0.35, tightening the coupled tail.
- The contractual opening date had a probability. The 78-month commitment was reported to the city council with an "81% confidence under the overlapped plan, 45% under sequential" tag — a number a councillor can interrogate, not a date that was either "on track" or "behind."
- Phase 1 contingency dollars were re-prioritised. The board released an additional $30M of front-end TBM contingency because the tornado said tunnelling spread dominated everything else.
- Phase 4 commissioning was de-risked early. Recognising the LogNormal tail on commissioning, the team scheduled a six-week dress rehearsal in month 70 — a cost of $6M to compress the P90 of Phase 4 by about 3 months.
ModelRisk functionality used
- PERT and LogNormal phase-duration distributions chosen by phase character — bounded for installation, right-skewed for tunnelling and commissioning.
- Rank-correlation coupling (rho = 0.55) between Phase 2 and Phase 3 in the overlapped strategy, equivalent to a Gaussian copula on the duration percentiles — the dependency a sum-of-independent-durations model cannot represent.
- Two-strategy parallel simulation on a shared seed so that the difference in P50 and P80 was attributable to phasing, not to Monte Carlo noise.
- Stochastic Gantt outputs with P10–P90 whiskers — the chart the programme board read every month.
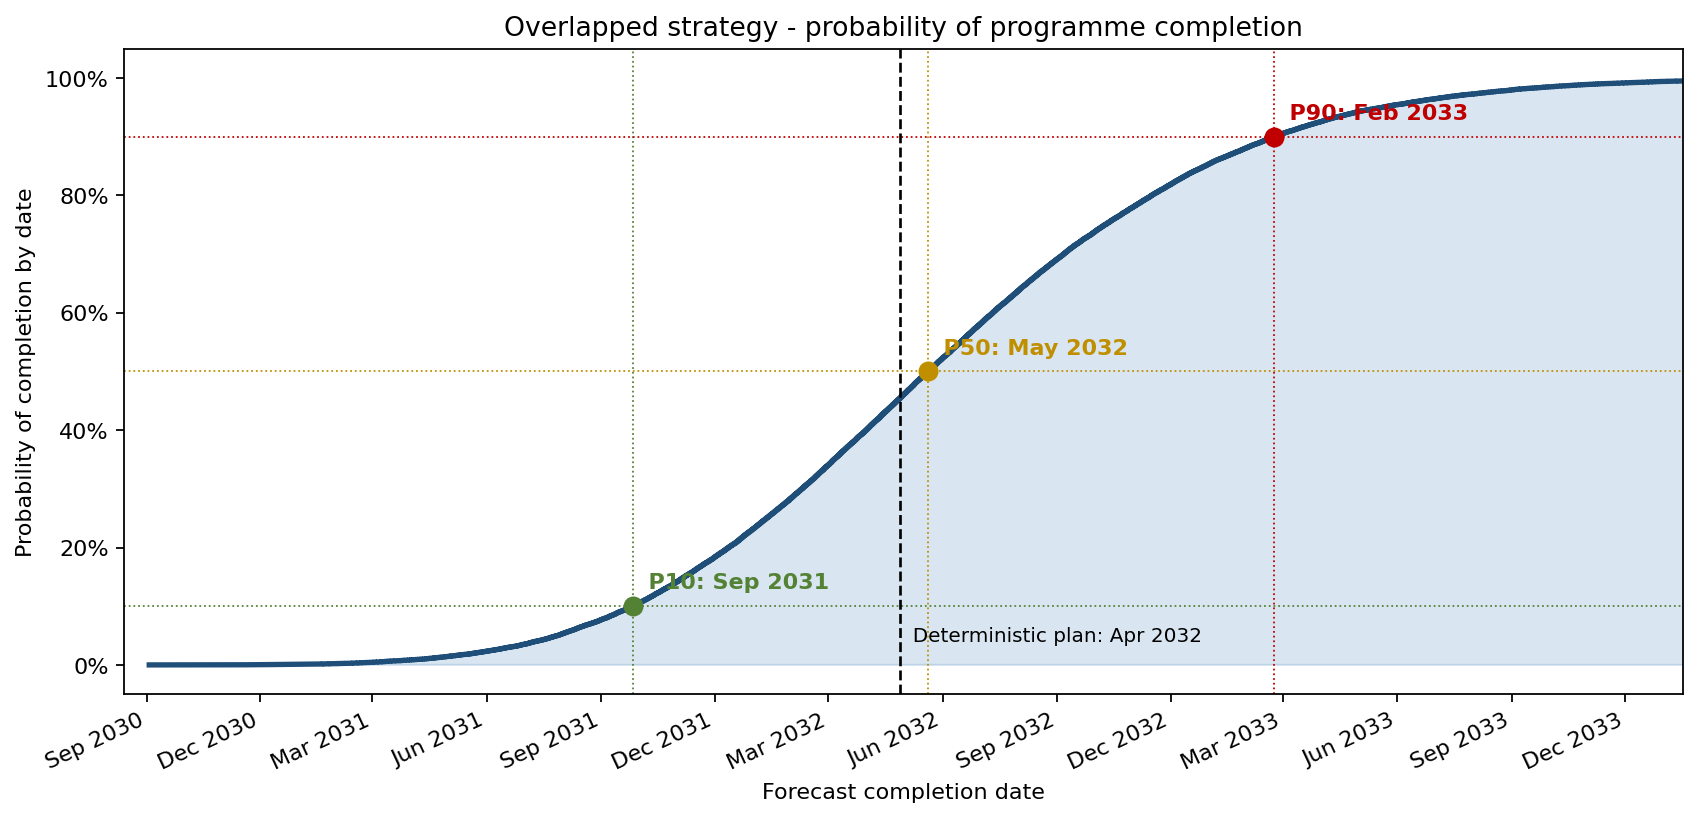
- S-curve completion-probability output that converted the strategy-CDF into the form the city council asks for: "probability of opening by date X."
- Tornado on programme-finish output that ranked Phase 1 ahead of every other contributor and directed contingency dollars accordingly.
Phasing decisions used to be made on whether the bars on a Gantt chart looked feasible. The probability distributions of those bars overlap in ways the chart cannot show — and the difference between an 81% opening-day confidence and a 45% confidence is exactly what Monte Carlo simulation puts on the page.