

Industry: Project Management
Product: ModelRisk
Application: Cost Estimation
From Class 5 to Class 1: Cost Estimation as a Shrinking Distribution
The AACE 18R-97 cost-estimate classification is explicit about what accuracy you are buying. A Class-5 concept estimate is −50% / +100% accurate at 80% confidence; a Class-1 definitive estimate is −10% / +15%. The numbers exist because EPC owners learned the hard way that a single dollar figure is meaningless without knowing the band around it. Yet most contractors still hand over a single number per class, with the band relegated to a footnote on the cover sheet.
A midstream gas-processing project — a $1.2B capital-investment decision — was estimated five times in ModelRisk, once per AACE class. The output at each gate was the same chart: a cumulative cost distribution with the P50 baseline and the P80 commit number marked. The point estimate stayed the cover-page headline; what the board approved was the P80 reading off the chart — and the value of front-end engineering became visible as the distribution physically tightening from one class to the next.
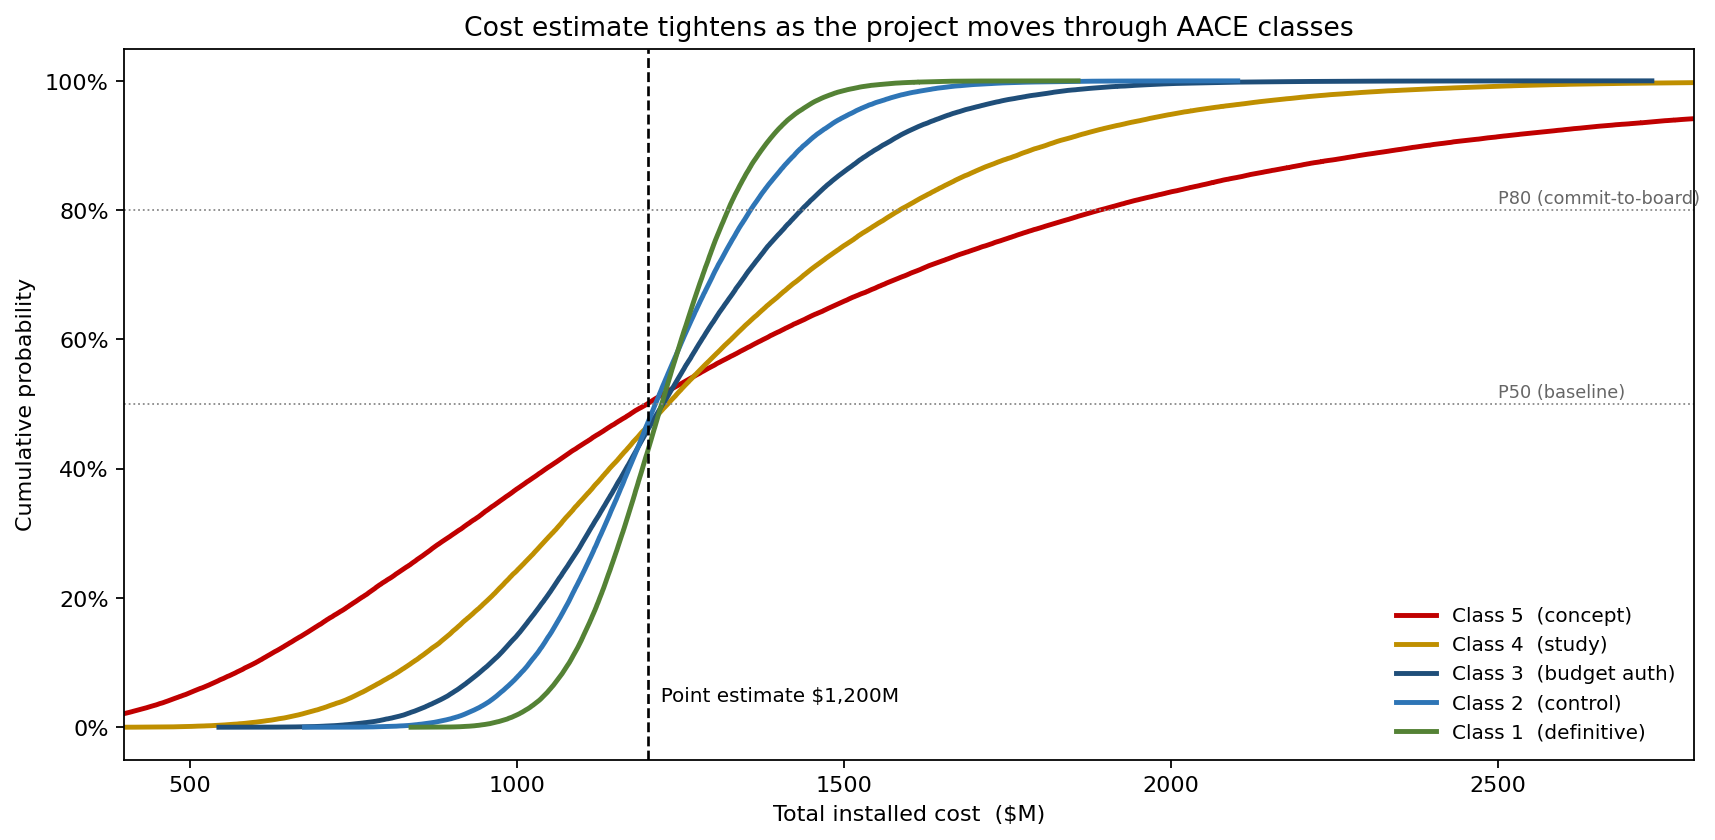
Every curve passes through the same $1,200M point estimate at the P50, but the spread collapses as the estimate matures: the Class-5 concept curve is almost flat across a $600M-to-$2.4B band, while the Class-1 definitive curve is nearly vertical. The board does not commit to the point estimate — it commits to where each curve crosses the P80 line, and that reading marches from $1.89B at Class 5 down to $1.32B at Class 1.
Turning AACE accuracy bands into distributions
Each AACE class maps to a low/high accuracy percentage at 80% confidence. The simulation translates that band into a LogNormal whose P10 and P90 hit the class endpoints. LogNormal — not Normal — because:
- Cost is strictly positive.
- Construction-cost data is right-skewed at every WBS level (commodity spikes, scope creep, rework events all push up; nothing systematic pushes down).
- The published AACE bands are themselves asymmetric (Class 5 is −50% / +100%, not ±75%), which only a skewed distribution can honour.
| AACE class | Accuracy band | P10 ($M) | P50 ($M) | P90 ($M) |
|---|---|---|---|---|
| Class 5 (concept) | −50% / +100% | 600 | 1,200 | 2,400 |
| Class 4 (study) | −30% / +50% | 840 | 1,200 | 1,800 |
| Class 3 (budget auth) | −20% / +30% | 960 | 1,200 | 1,560 |
| Class 2 (control) | −15% / +20% | 1,020 | 1,200 | 1,440 |
| Class 1 (definitive) | −10% / +15% | 1,080 | 1,200 | 1,380 |
The figures hold for any single point estimate of $1.2B; what varies as the project moves left-to-right on the AACE classes is the width of the distribution, not its centre.
Reading the opening chart more closely: at Class 5 the P80 sits at $1.89B — a 58% premium on the point estimate — and the curve is flat through a wide region, meaning the board cannot reasonably commit to any number narrower than that band. By Class 3 the P80 has tightened to $1.44B, and by Class 1 to $1.32B. The dollar value of progressing two classes is the difference between two P80s, which for this project was about $460M between Class 5 and Class 3 — easily justifying the front-end engineering spend that bought it.
Where the spread actually lives at Class 3
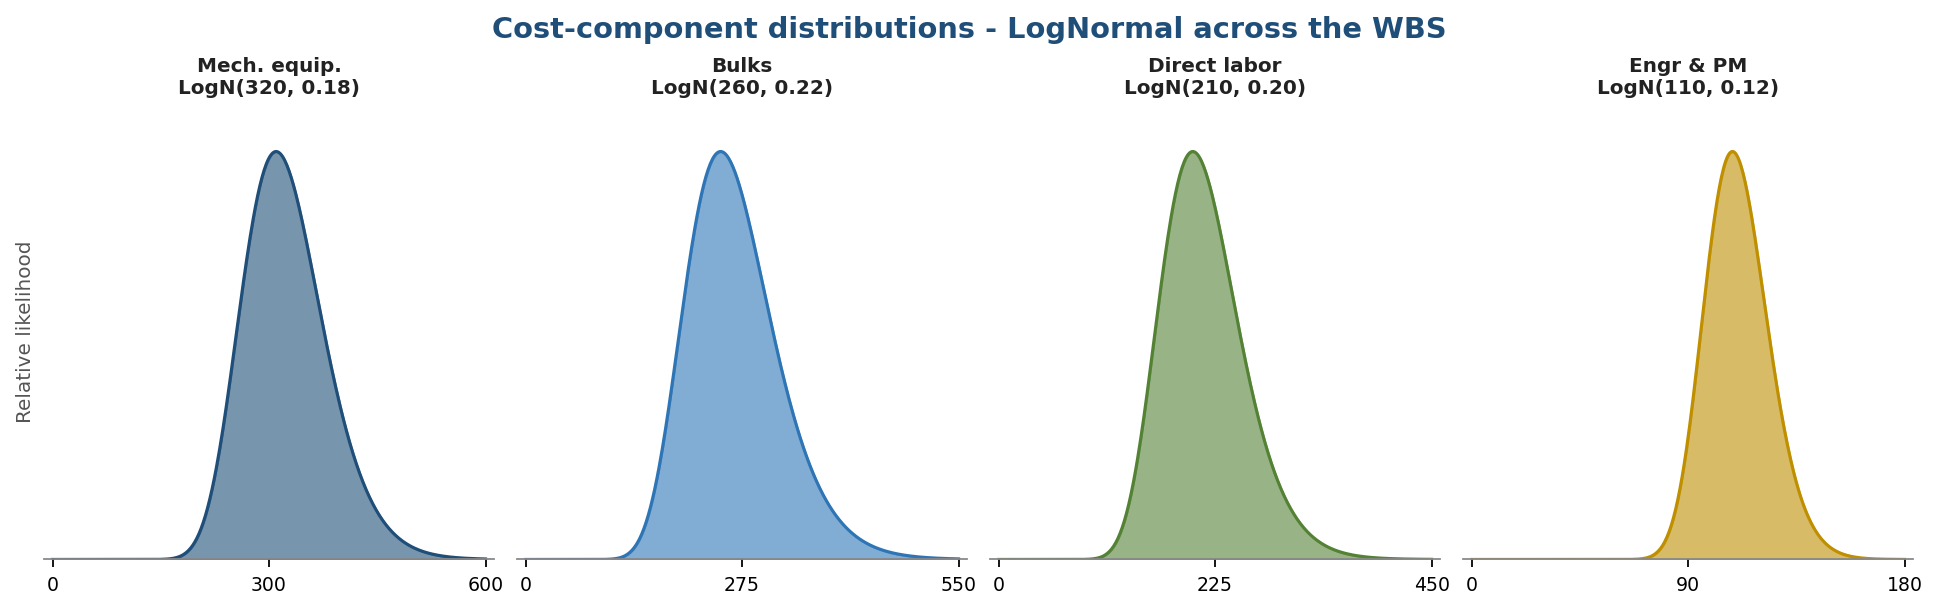
For the Class-3 budget-authorisation estimate, the WBS was rebuilt bottom-up — seven cost-component LogNormals plus three discrete risk-register events — and the full simulation was rerun.
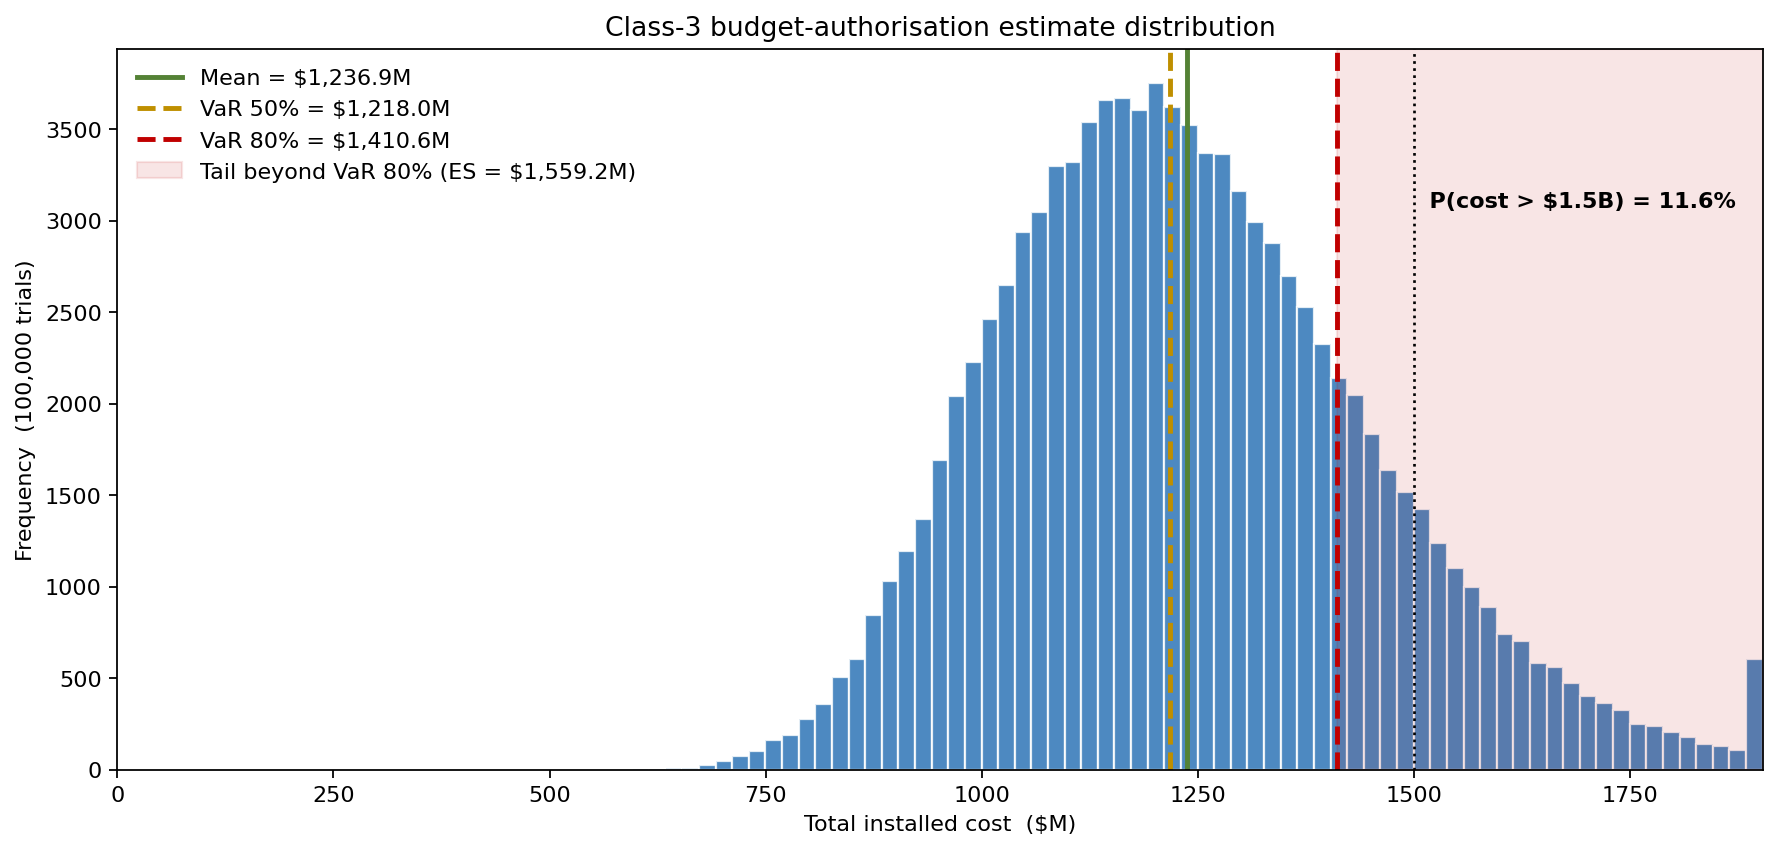
Class-3 P50 lands at $1.22B, P80 at $1.41B, P90 at $1.52B. The probability of breaching $1.5B is about 12% — the chart marks it directly. That number went straight into the board paper as "contingency is sized to hold the P80 at $1.41B, with a $50M strategic reserve lifting cover toward the P90."
What drives the spread
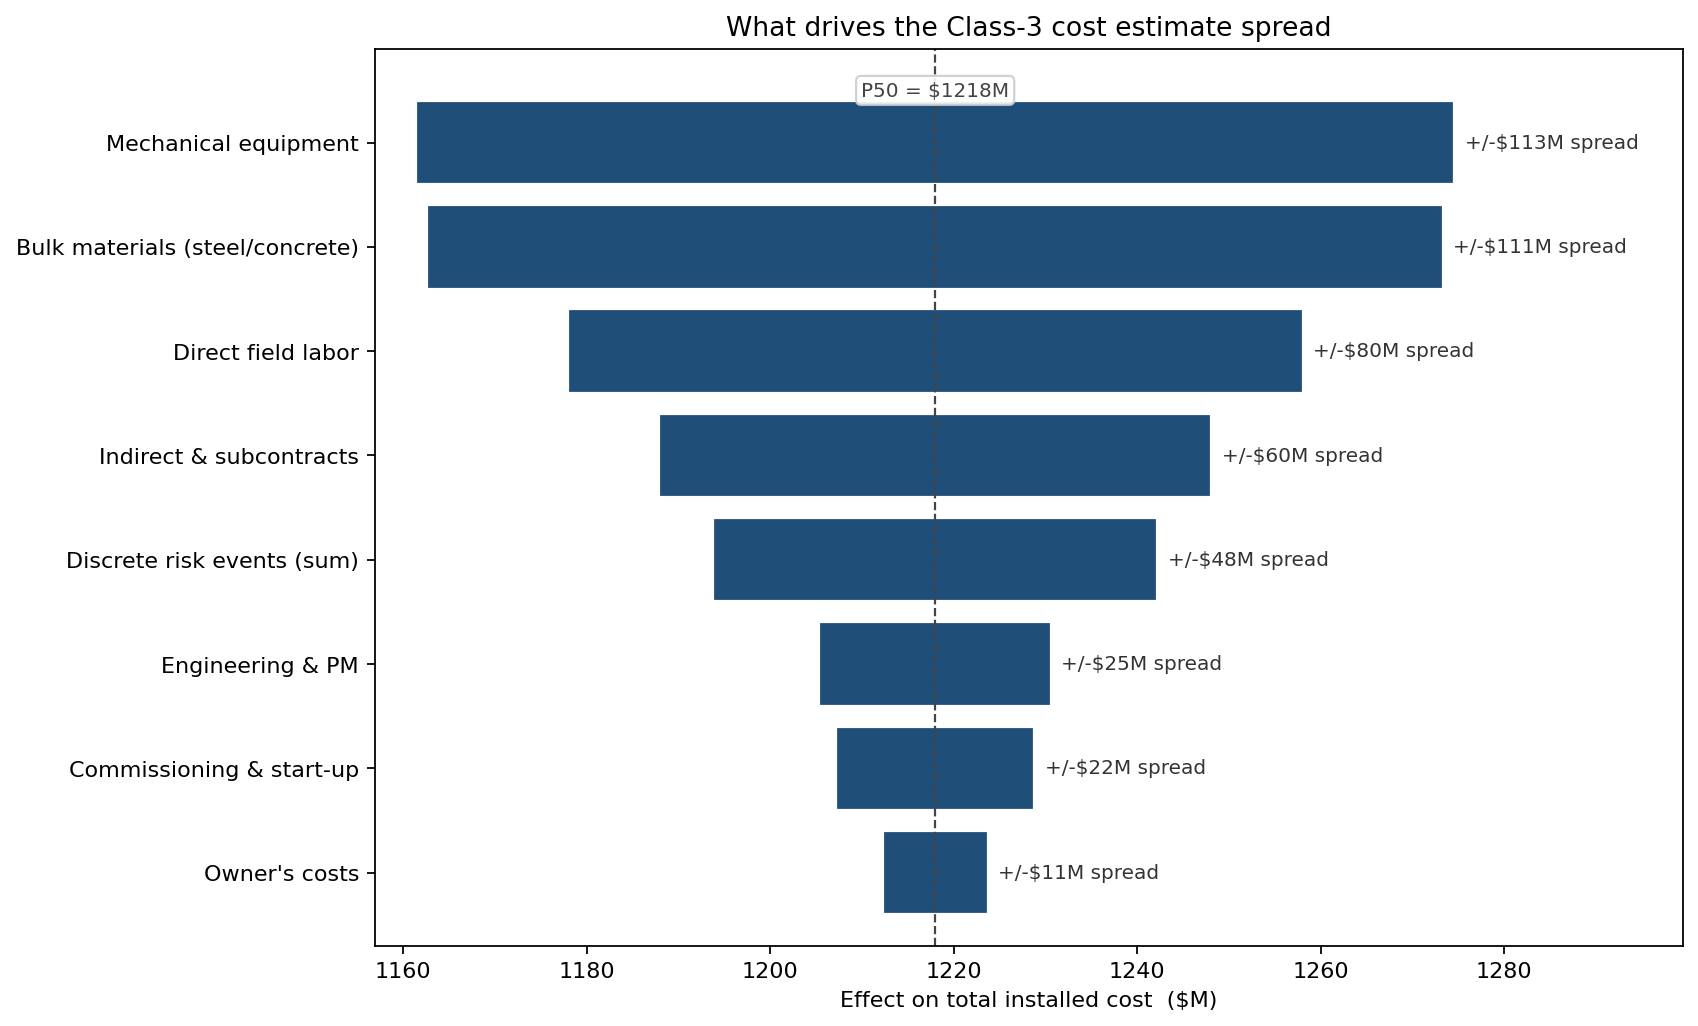
Mechanical equipment and bulk materials are the two largest drivers, near-tied at about ±$56M and ±$55M of half-spread, with direct field labour close behind at ±$41M — those three continuous WBS elements together dominate the at-completion spread. That ranking re-directed the Class-3-to-Class-2 engineering investment toward an equipment-package re-quote, MTO (material take-off) refinement and a labour-productivity study, rather than the lower-leverage line items. Discrete risk events rank below the top continuous drivers because their expected impact is folded into the central tendency; their spread contribution is smaller than the continuous-distribution width on the largest WBS elements.
What the model changed
- The board approved against a P80 of $1.41B, not a $1.2B point estimate. The published authorisation was "$1.41B with a P50 expected outcome of $1.22B" — and the AACE accuracy claim was backed by a chart, not a footnote.
- Class-progression spend was sized economically. The Class-3-to-Class-2 engineering work was budgeted at $14M because the simulation said it would narrow the P80 by about $40M of committed-but-undrawn contingency — a 2.8× return calculated before the work started.
- Component-level contingency replaced blanket percentages. The 11% blended contingency was redistributed onto the high-spread WBS elements — mechanical equipment, bulks and direct labour — while engineering & PM, which the tornado showed was almost noise-free, was held near 8%.
- The risk register became fundable. Three discrete events — scope creep, permitting drag, commodity squeeze — had expected costs above $5M apiece. Each got a named mitigation owner and a budget line.
ModelRisk functionality used
- AACE-class-to-distribution mapping that translates the −50% / +100% style accuracy bands into fitted LogNormals whose P10/P90 match the class endpoints — the band becomes a distribution, not a footnote.
- Bottom-up WBS rollup of seven cost-component LogNormals into a simulated total, with rank-correlation tornado isolating the largest individual driver.
- Discrete risk-register integration with Bernoulli × LogNormal events summed into the WBS rollup.
- Class-progression visualisation — the same simulation rerun at five accuracy bands, plotted as a single CDF set, so the narrowing of the distribution itself becomes the board's decision support.
- P50 baseline and P80 commit-number outputs in the format the AACE TCM Framework calls for and that EPC owner organisations actually use in their stage-gate paperwork.
- Rank-correlation driver ranking that re-prioritised the Class-3-to-Class-2 engineering investment toward the highest-spread WBS elements — mechanical equipment, bulk-material take-off and labour productivity.
The AACE estimate classes were never really about a number — they are about how confident you are entitled to be in that number. Monte Carlo simulation makes the entitlement explicit, and turns "Class 3, +30%/−20%" from a cover-sheet disclaimer into a curve the board reads off.