

Industry: Pharmaceutical
Product: ModelRisk
Application: End-to-End Supply Chain (API → DS → DP → cold-chain)
End-to-end mAb supply chain simulation: where the stockout actually comes from
A monoclonal antibody supply chain stacks four uncorrelated sources of stochastic loss. Drug substance (DS) yield at fermentation/purification typically lands between 75% and 92% of nominal titer recovery, with batch-to-batch variation driven by raw-material lots and column performance. DS + drug product (DP) total lead time is a LogNormal of 90 to 130 days from fermentation start to finished-pack release, with the tail driven by deviation investigations. DP fill contamination wipes a small fraction of batches outright — typically 2–5% per lot at a well-run sterile-fill site. And finally, cold-chain excursions on the 2–8°C distribution leg destroy 0–100% of a shipped lot's value, with a per-shipment probability of 5–10% and a Beta-distributed loss fraction conditional on excursion. Each link has its own deterministic plan number and its own real distribution; the supply-chain stockout is the joint distribution of all four, not the multiplication of their means.
A specialty biologic manufacturer with a four-link supply chain — DS in India, DP fill in Switzerland, secondary packaging in Belgium, cold-chain distribution to US/EU/JP — used ModelRisk to simulate the end-to-end quarterly supply against forecast demand. The output was not "expected supply" but the distribution of vials delivered per quarter, the stockout-vial distribution given supply falls short, and the cold-chain lot-value loss distribution — three numbers the deterministic plan could not produce.
The single picture that reframes the planning conversation is the delivered-supply distribution laid over the demand distribution. The deterministic plan computes delivery as 4 lots × 5,000 vials × 83% DS yield × 95% DP yield ≈ 15,770 vials and sets demand at a flat 14,500 — a comfortable cushion on paper. The simulation tells a different story: delivered supply averages ~12,500 vials per quarter, well below the plan, and its left tail overlaps demand on the wrong side of the planning line.
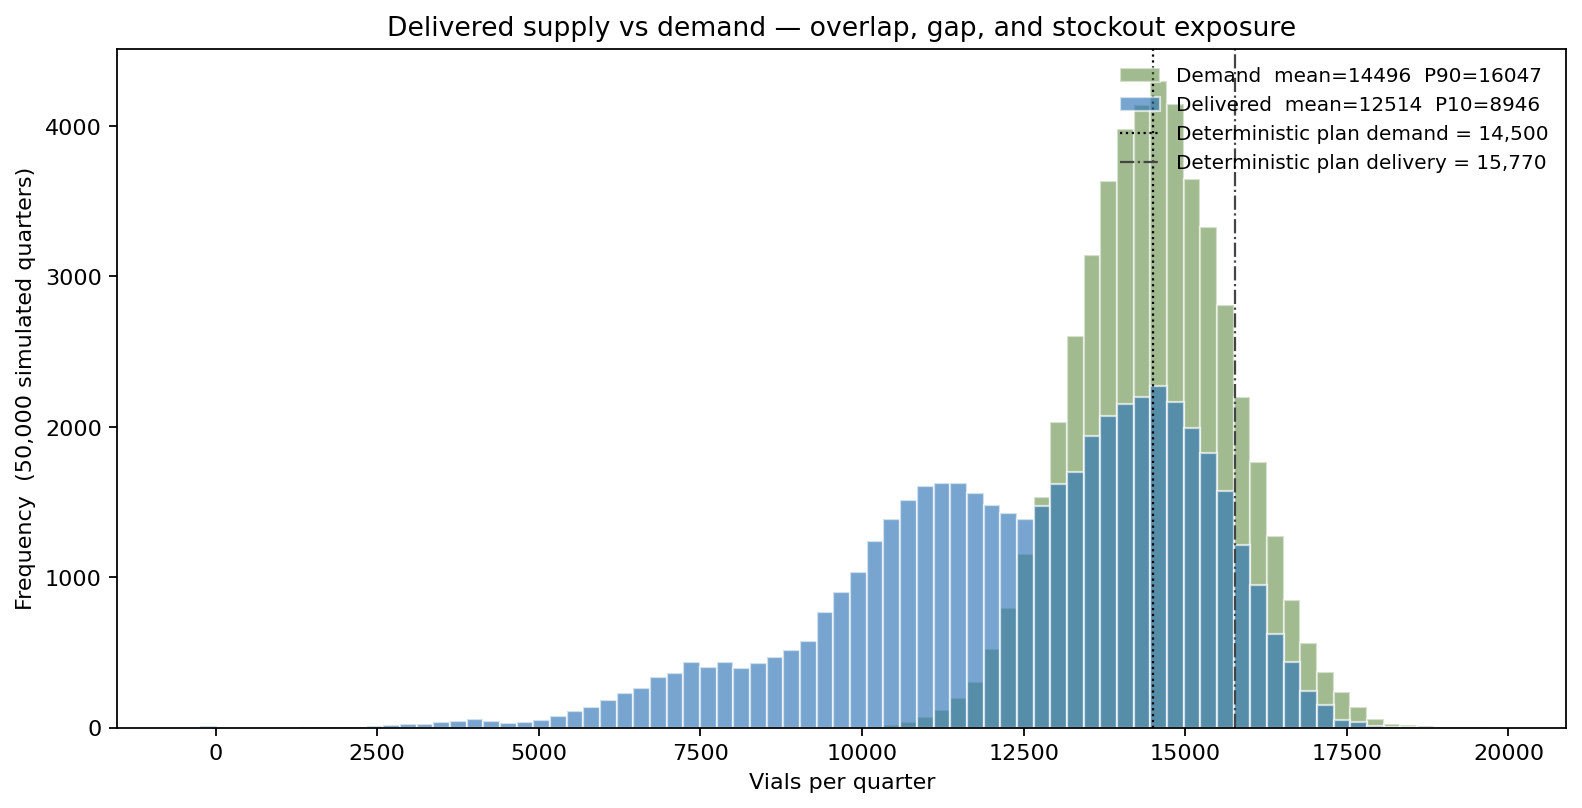
The delivered distribution has a long left tail, driven mostly by lots whose lead times run long enough to slip out of the quarter and deliver zero vials into it at all. The deterministic plan number sits up near the right edge of the distribution, not near its mean — supply averages well below the plan because of the asymmetric impact of lead-time excursions. Demand sits on average right where the plan said it should, but the demand and supply histograms overlap meaningfully on the wrong side of the planning line.
What each link contributes
Per quarter the company launches four DS lots, each with nominal 5,000-vial capacity. Per lot:
- DS yield — Beta(8, 2.5) on [0, 1], mean ~76%, fitted to three years of internal batch records. Beta is the correct family for a bounded yield fraction; using truncated Normal, as the prior workbook did, was clipping rather than modeling the actual distributional shape.
- DS lead time — LogNormal with median 88 days and σ(log) = 0.22, accommodating the deviation-investigation right tail.
- DP yield — Beta(40, 2.0), mean ~95% in the body of the distribution. A 3% per-lot Bernoulli for contamination zeroes the lot when it fires.
- DP lead time — LogNormal with median 20 days and σ(log) = 0.28.
- Cold-chain excursion — 7% per-shipment Bernoulli (typical for 2–8°C distribution at scale), conditional Beta(2.5, 5.5) loss fraction on excursion. Mean conditional loss fraction is ~31%.
A lot only counts toward the quarter's delivered supply if it clears the full DS+DP cycle within the in-flight pipeline window (~140 days) — lots whose combined lead time runs longer slip into a later quarter and deliver zero vials into this one. The composite delivered-vial count per quarter is then the sum over the four lots, each weighted by its yield product and reduced for excursion loss.
The stockout distribution — the question the plan cannot answer
About 18% of simulated quarters experience a stockout (supply < demand, after counting the 4,500-vial safety stock). The unconditional mean shortfall is small because most of the mass is at zero; the conditional distribution given a stockout is the right view:
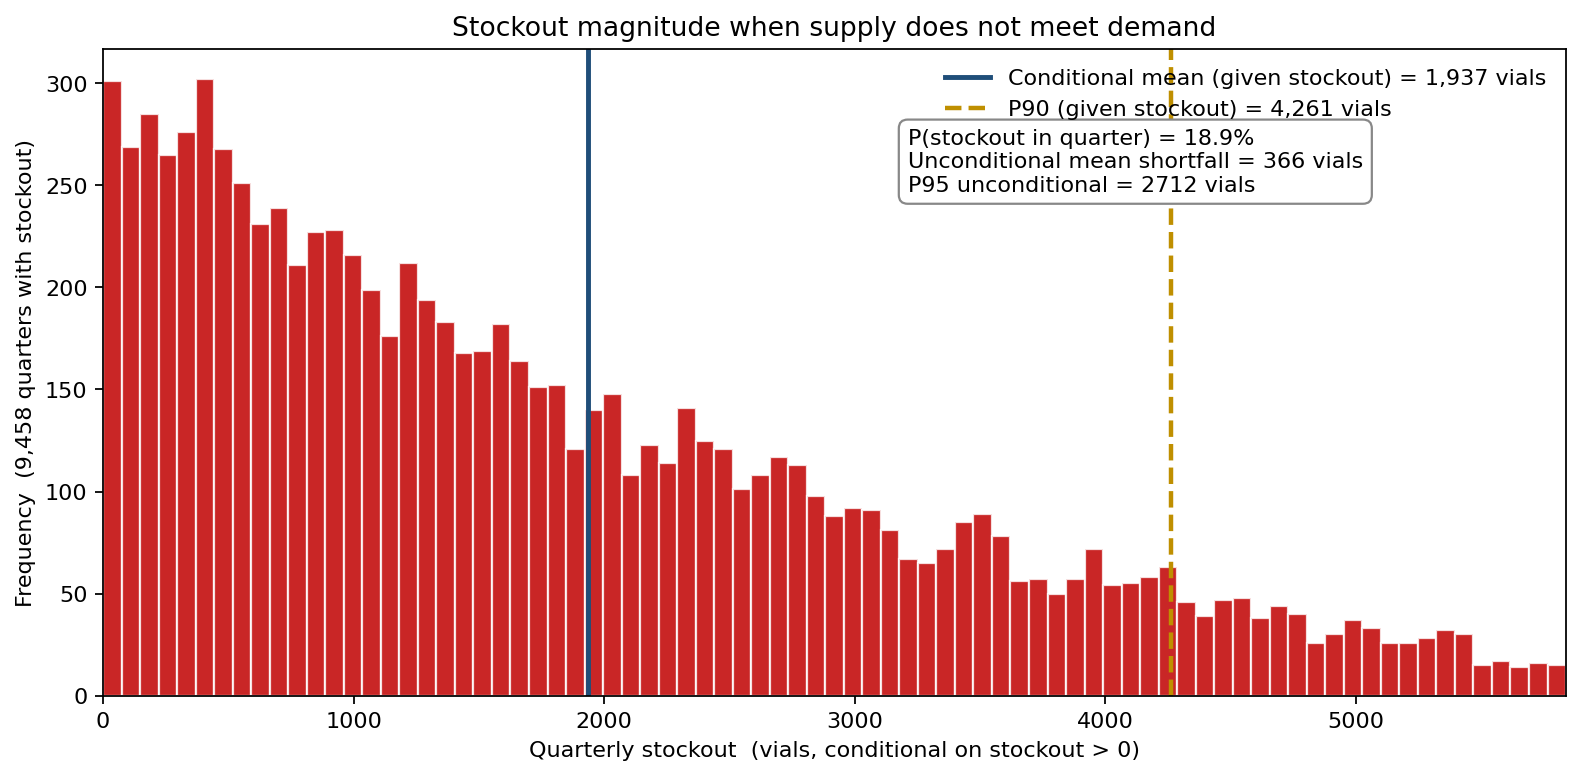
Given a stockout occurs, the median shortfall is around 1,500 vials; the P90 given stockout is roughly three times that, near 4,300 vials. For a therapy under contract delivery commitments with penalty clauses, the conditional P90 is what the contract performance team cares about — the unconditional mean tells them nothing about how bad a bad quarter looks.
What drives the P95 stockout
A tornado over the four links isolates which contributes most to the P95 stockout-vial number:
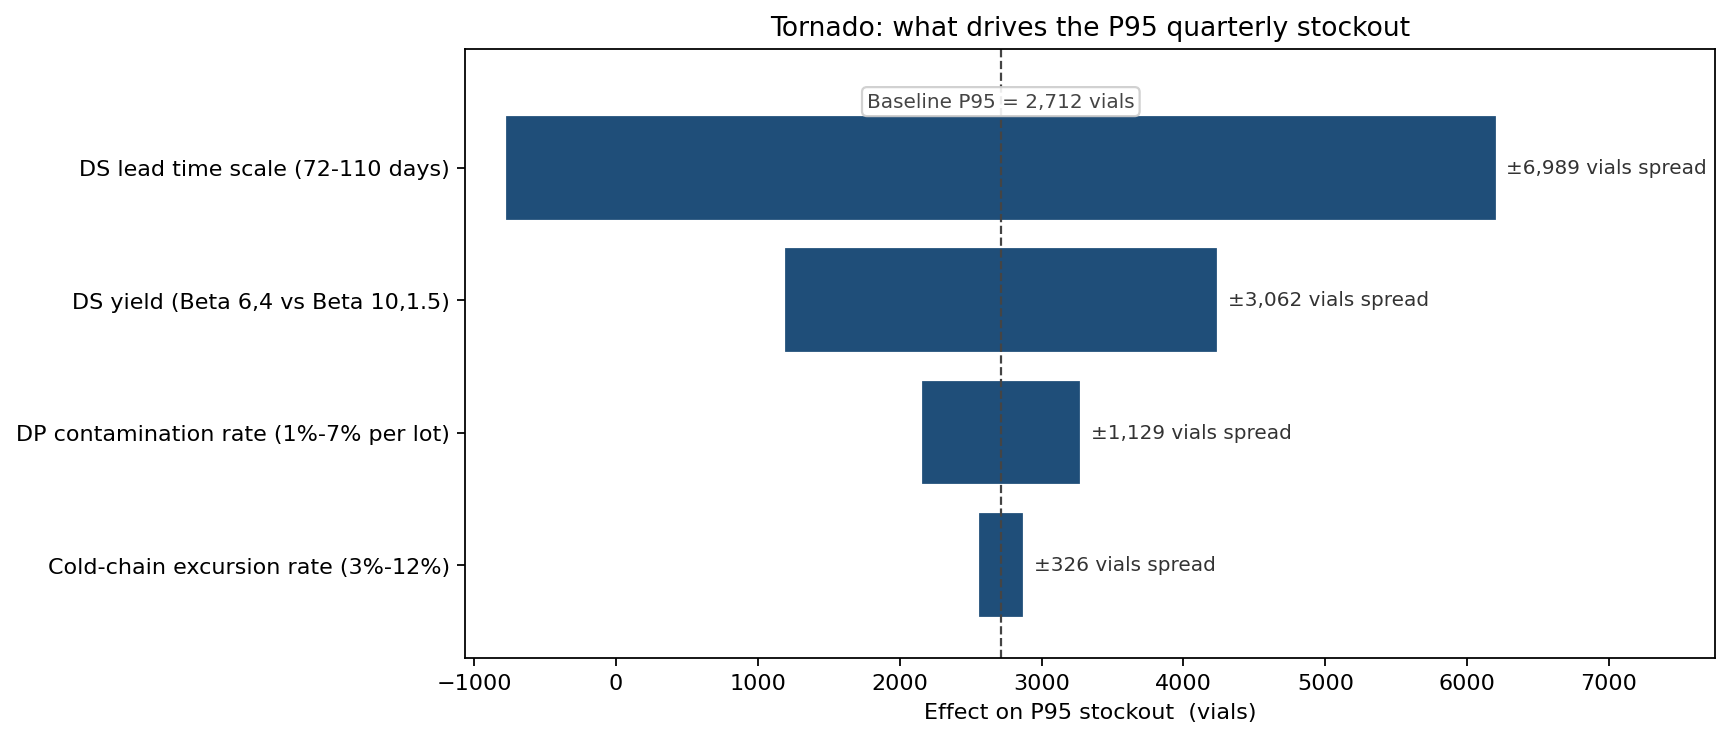
DS lead-time scale dominates — long lead times push whole lots past the pipeline cutoff and out of the quarter entirely, which is the single most damaging thing that can happen to in-quarter supply. DS yield follows closely: each percentage point of mean DS yield translates roughly linearly into delivered vials, and the roughly 7-point gap between the body of the yield distribution (mean ~76%) and the deterministic plan's 83% point estimate accounts for much of the structural shortfall against plan. DP contamination and cold-chain excursion are smaller contributors but, importantly, they are disproportionately tail-shaping even when their mean contribution is small — both being binary events with severe conditional outcomes.
Three mitigation strategies, three CDFs
The substantive decision was a $14M investment in a qualified second DP source (parallel-capacity, lower expected contamination rate, plus active-temperature shippers reducing the cold-chain excursion rate from 7% to 4%). The cheaper alternative was a $4.5M one-off to lift safety stock from 4,500 to 7,000 vials. Both relative to the current SC:
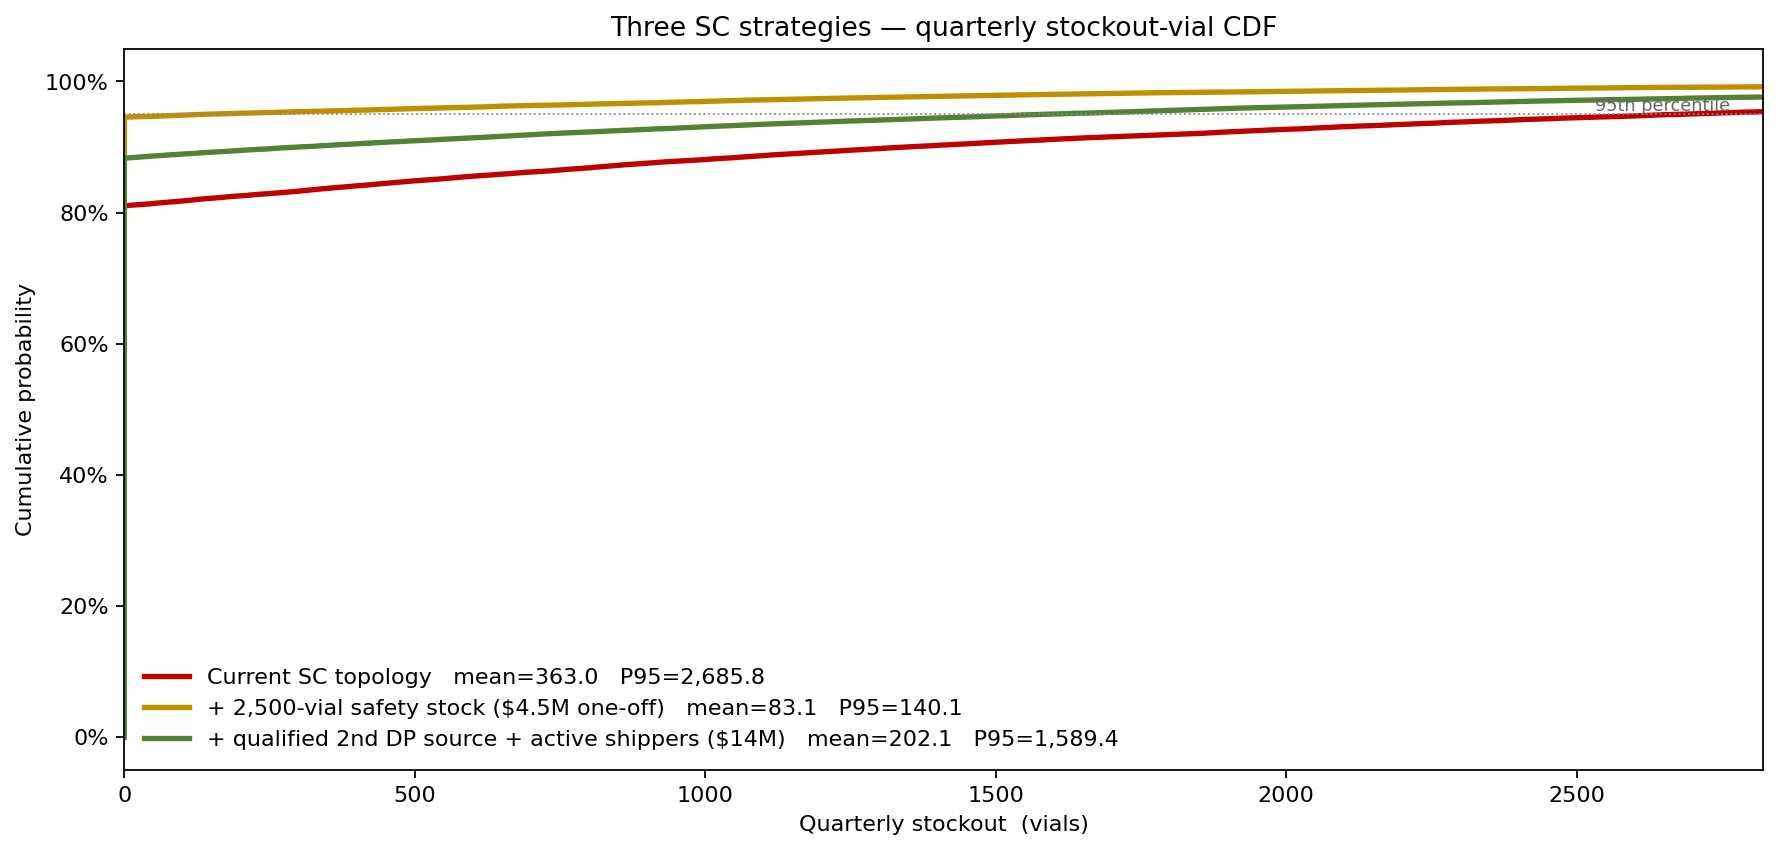
The chart makes the trade clear. Adding 2,500 vials of safety stock shifts the entire stockout distribution sharply to the left — it directly offsets the shortfall, cutting the probability of any stockout from ~19% to ~6% and pulling the P95 stockout from roughly 2,700 vials to a few hundred. As a buffer it is remarkably effective per dollar against this quarter's exposure. The second-DP-source-plus-active-shippers strategy attacks the underlying contamination and excursion probabilities instead of buffering their consequences; it cuts the stockout probability to ~12% and the P95 to ~1,600 vials, but it leaves the dominant lead-time driver untouched, so it does not match the buffer's headline reduction.
The buffer's limitation is structural, not visible in a single quarter's CDF: safety stock has carrying cost, scales with demand growth, and does nothing about the root-cause lead-time and contamination events — it just absorbs them quarter by quarter. The second source de-risks the network permanently. The $14M strategy was approved on that durable-risk-reduction basis, with the cheaper safety-stock action implemented immediately as a bridge until the second source qualifies.
What the model changed
- $14M second-source-plus-active-shippers programme approved — for durable, root-cause reduction of the contamination and excursion events rather than per-quarter buffering of their consequences.
- Safety stock increased to 7,000 vials immediately as a low-cost, high-impact bridge that on its own cuts the stockout probability from ~19% to ~6% until the second source qualifies (12-month lead).
- DS lead-time and yield-improvement programme funded at India site — the tornado's top two movers, addressing both the lot-disqualifying lead-time tail and the roughly 7-point gap between the body of the yield distribution and the deterministic plan.
- Contract delivery performance now reported on the simulated conditional P90 stockout, not the unconditional mean — aligning internal KPI with what the contract penalty clause actually measures.
ModelRisk Functionality Used
- Beta-distributed yields for both DS and DP, replacing truncated Normal — bounded on [0, 1] as a yield fraction must be, and properly skew-shaped against historical batch data.
- LogNormal lead times for both DS and DP, with the right-tail capturing the deviation-investigation regime that the prior Normal model had truncated away.
- Bernoulli-with-conditional-Beta cold-chain loss, modeling excursion as a composite event with a meaningful conditional severity distribution.
- Vectorised four-lot-per-quarter aggregation in Excel, with the in-flight pipeline lead-time gate evaluated per lot per trial — 50,000 quarters in a few seconds.
- Conditional stockout distribution plotted given stockout > 0, avoiding the zero-inflated histogram that the unconditional view would have produced.
- CDF comparison of three SC strategies, used to defend the larger investment against the cheaper safety-stock alternative.
A pharmaceutical supply chain is not a flow rate; it is a stack of bounded yield distributions and long-tailed lead-time distributions composed across four serial links. Monte Carlo simulation in ModelRisk is what makes the full delivered-supply distribution visible — and once it is visible, the right safety-stock level, second-source decision, and contract-performance KPI become the visible answer rather than a deterministic guess.