

Industry: Pharmaceutical
Product: ModelRisk
Application: Regulatory Compliance (GMP / FDA inspection risk)
What does a Form 483 actually cost? Modeling six manufacturing sites against the FDA escalation ladder
A typical FDA inspection of a major sterile-fill site generates between one and five Form 483 observations. Most observations are minor and close out inside a 30-day CAPA cycle at $20k–$50k each. But a single observation classified as "critical" — a sterility-assurance gap, a data-integrity finding, an unaddressed deviation pattern — has roughly a 45–65% probability of escalating to a Warning Letter, and a Warning Letter that does not close inside 12 months has a tail probability of escalating to a Consent Decree that runs $50M to $500M and idles or constrains production for 18–36 months. The deterministic compliance budget — usually built as "expected observations × average CAPA cost per observation" — captures the body of the distribution and entirely misses the tail.
A specialty pharmaceutical company with a six-site global manufacturing network — two sterile-fill sites, one biologic drug-substance site, two oral solid sites, and an API site — used ModelRisk to put a defensible distribution around its annual compliance exposure and, more importantly, to price pre-emptive remediation programs at each site against the tail risk they reduced. The result is a single picture the deterministic budget could never produce: the full distribution of annual network compliance cost, with a long right tail driven by the rare-but-real Consent Decree draw.
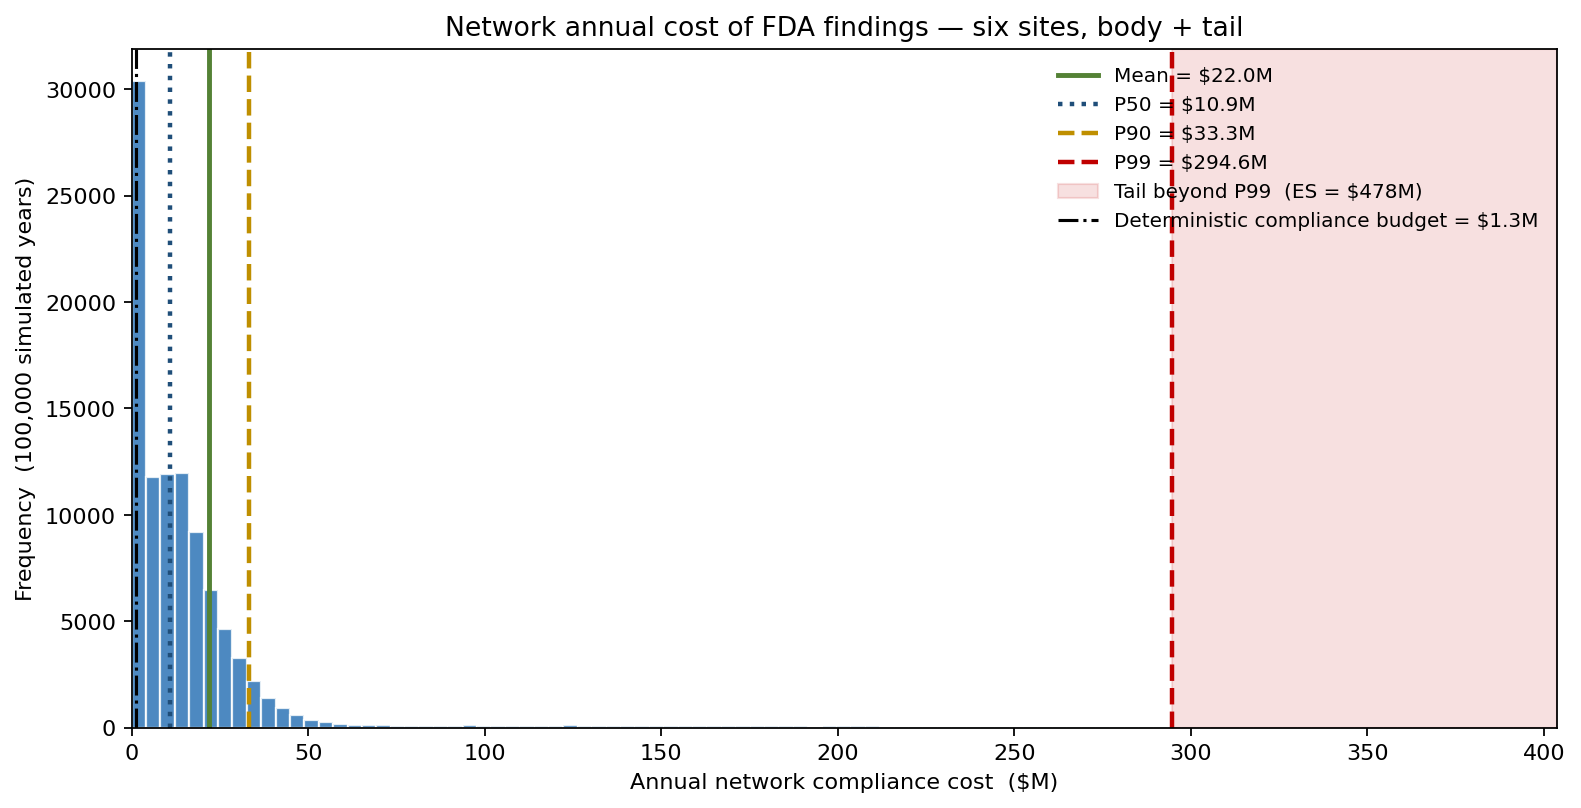
The deterministic compliance budget — built as expected observations times average CAPA cost — sits well below the P90 of the simulated distribution. The P99 outcome is several multiples of the P50; conditional on being in the worst 1% of years (the expected shortfall beyond P99) the cost is dominated by the rare-but-real Consent Decree draw. The compliance team had been treating the deterministic number as the planning budget; finance had been treating the same number as the worst case. Neither was right, and the simulation said so explicitly.
The escalation ladder, modeled stochastically
Each site has its own annual cost as the sum across an escalation tree:
- Inspection occurrence — Bernoulli with site-specific probability (0.55–0.85), calibrated to the FDA's risk-based inspection-frequency rules and the site's prior-inspection history.
- Form 483 observation count — Negative Binomial, parameterised by site-specific mean (2.6 at the EU oral-solid site through 5.0 at the India sterile-fill site) and an over-dispersion of 1.5–2.2. Plain Poisson is the standard textbook choice but is empirically too thin-tailed for inspection counts; the residual variance after fitting consistently exceeds the mean.
- Per-observation severity — Multinomial over {minor, major, critical} with site-specific weights. The India sterile-fill site carries an 18% critical weight; the EU oral-solid site carries 5%.
- Per-observation CAPA cost — LogNormal with class-specific medians: ~$20k for a minor, ~$180k for a major, ~$1.4M for a critical. LogNormal is the right family — CAPA costs are bounded below by zero, right-skewed, and span more than an order of magnitude.
- Warning Letter escalation — Bernoulli conditional on at least one critical observation, with site-specific probability 0.30–0.65. WL response cost is itself a LogNormal in the $5M–$25M range.
- Consent Decree escalation — Bernoulli with conditional probability 6% given a Warning Letter that has not closed in 12 months. The conditional cost is LogNormal centred near $140M.
The escalation ladder matters because the joint distribution is what produces the tail: an inspection alone is cheap, but an inspection that finds three critical observations on a sterile-fill site that has prior unresolved observations is one Bernoulli draw away from a Consent Decree. Modeling the steps independently and then composing them is the only way to get the right tail shape.
Where mitigation dollars actually matter
The Pareto of expected annual cost by site puts the next-dollar-of-remediation question in plain view:
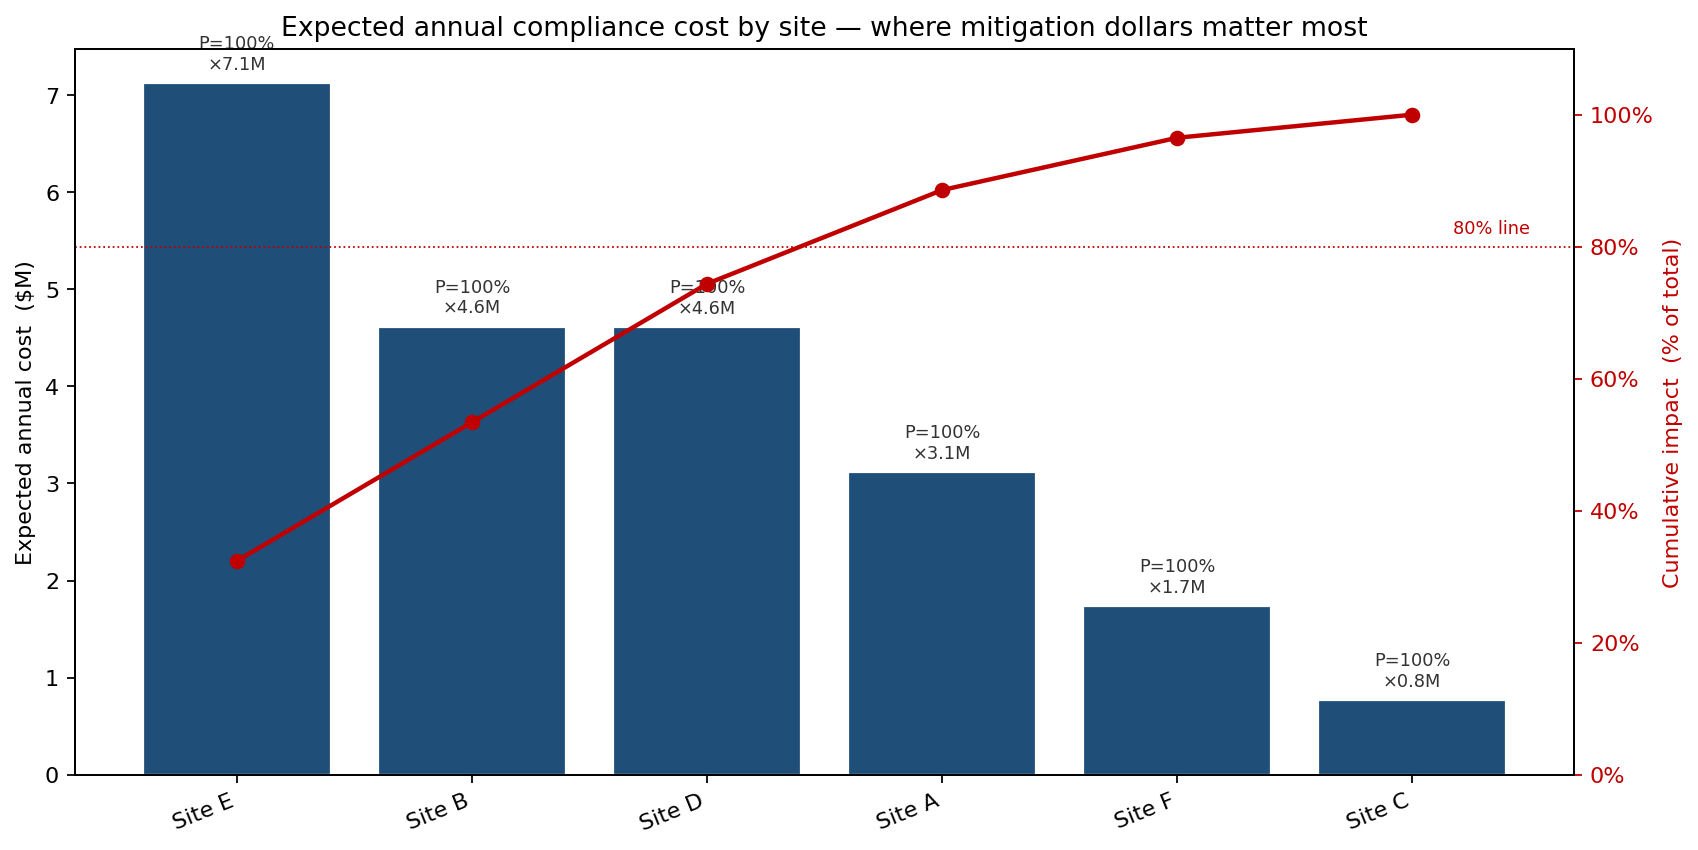
The India sterile-fill site (Site E) is the largest single contributor — driven by the highest observation count, the highest critical-observation weight, and the highest WL-escalation conditional. The two US sterile-fill and biologic-DS sites follow. The 80-percent line falls cleanly across the top three sites — the textbook Pareto split, but quantified with a defensible model rather than asserted from experience.
Pricing the remediation program at Site E
The most consequential application was the business-case decision on a $4.5M upfront / $2.2M-per-year ongoing remediation program at Site E. The program adds three senior QA leads, upgrades environmental monitoring, and retrains operators against a documented gap-list. The simulation models the program's effect as reducing mean observations from 5.0 to 3.2, lowering critical weight from 18% to 10%, and bringing WL-escalation conditional from 65% to 45%.
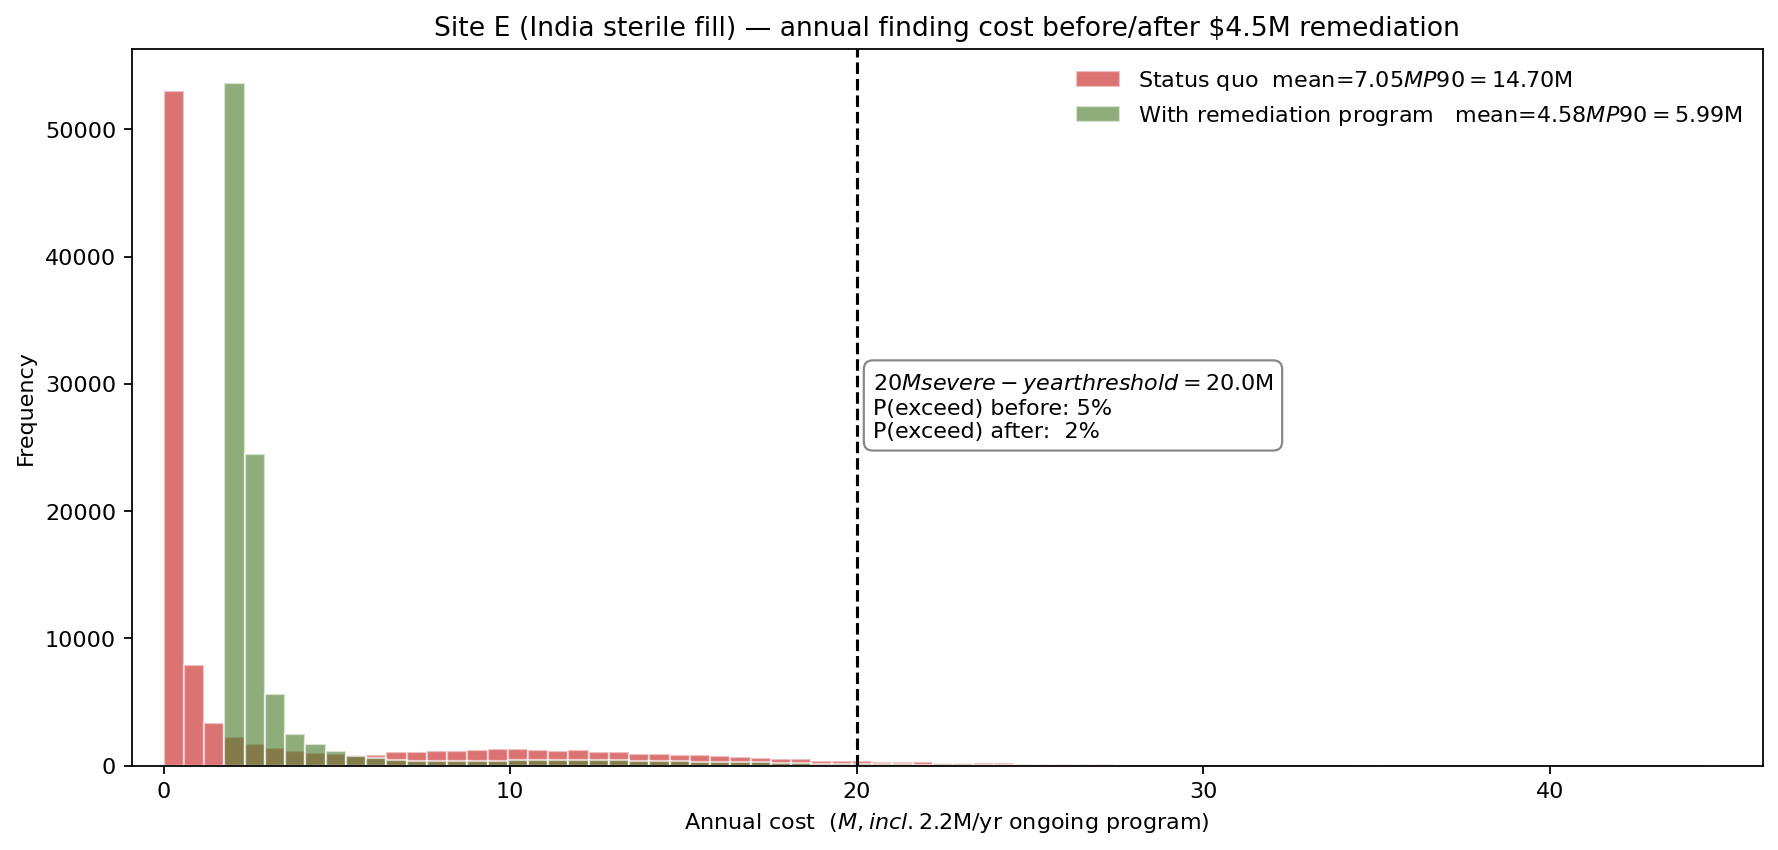
The mean shifts only modestly — but the probability of a $20M-plus severe-finding year drops sharply because both legs of the escalation ladder are weakened. The remediation program is not buying mean cost reduction; it is buying tail reduction. The deterministic CFO-style payback calculation said the program had a 6-year ROI and was therefore borderline. The probabilistic case said the program eliminates roughly half of the network-level Consent Decree exposure and pays back inside two years in expected terms once tail outcomes are priced in. The program was approved on the basis of the probabilistic case.
What swings the network's P90
A tornado on the P90 of network cost ranks the highest-leverage parameters across the six sites:
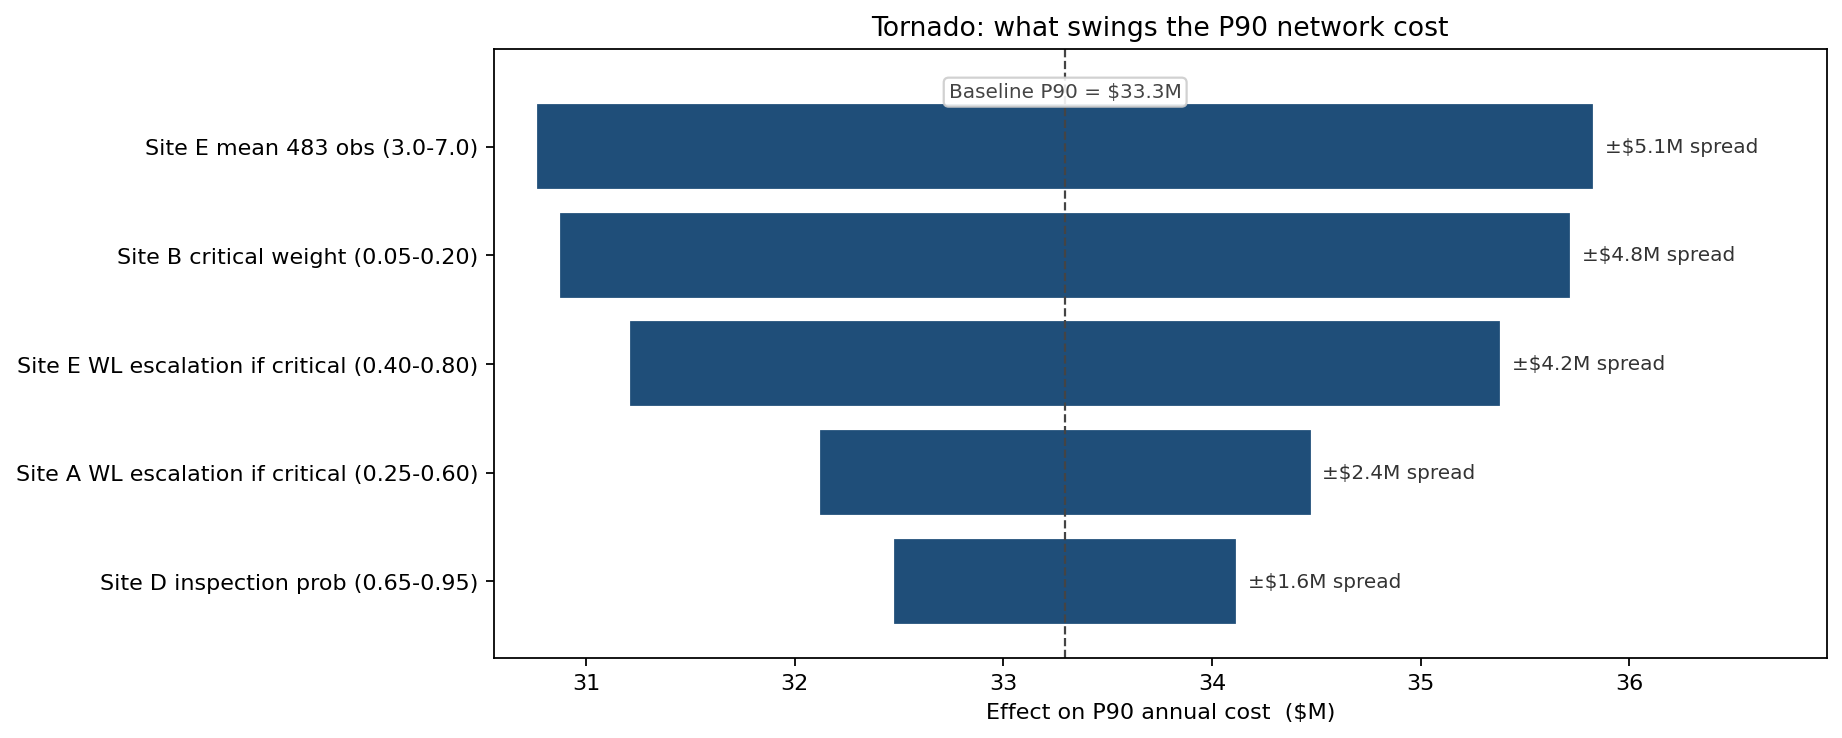
Site E's observation count dominates — corroborating the Pareto and the remediation business case. Site B's critical-observation weight follows; this is the second-priority remediation candidate, and the team began scoping its program the same quarter.
What the model changed
- $4.5M Site E remediation program approved on the basis of tail-risk reduction, where the deterministic ROI calculation had been borderline.
- Compliance budget reset from the deterministic point estimate to the P75 of the simulated distribution — a substantial increase that the CFO accepted because the basis for the previous number was indefensible.
- Site B critical-observation reduction program scoped — the tornado's second mover, prioritised over a planned Site C minor-finding training program that the simulation showed barely moved the P90.
- Inspection-readiness drills standardised across the network with a documented gap-list per site, refreshed quarterly against the model's per-site observation-count distribution.
ModelRisk Functionality Used
- Negative Binomial 483 counts per site — the right family for over-dispersed inspection-finding data, replacing the Poisson approximation the prior model used.
- Multinomial severity classification per observation, with site-specific minor/major/critical weights calibrated from FDA-published inspection records 2015–2024.
- Bernoulli escalation conditionals for Warning Letter (given critical) and Consent Decree (given unresolved WL) — composed into the escalation tree that produces the right-tail shape.
- LogNormal CAPA cost per severity class with class-specific medians ($20k minor, $180k major, $1.4M critical) and site-specific dispersions.
- Before/after histograms of Site E annual cost with the $20M severe-year threshold marked, used as the remediation business case.
- Per-site Pareto of expected cost driving the prioritised remediation roadmap.
A compliance budget is not a number; it is a distribution with a left side you can plan against and a right side you cannot afford. Monte Carlo simulation in ModelRisk is what makes both sides visible and what lets a pre-emptive remediation dollar be priced against the tail it actually shrinks.