

Industry: Pharmaceutical
Product: ModelRisk
Application: R&D Portfolio Management
The committee's wish-list was 8 programs. The $1.2B budget funds 4.
Industry benchmarks from Informa and BIO put the cumulative probability of technical and regulatory success at roughly 10% for a Phase I asset, 19% from Phase II, 58% from Phase III, and 85% at NDA/BLA filing. Multiply those probabilities by a peak-sales forecast that is itself a wide LogNormal and a development cost that runs $180M to $600M per candidate, and the question "which programs do we fund?" turns into a stochastic combinatorial optimization with no clean closed-form answer. Most portfolio committees still pick assets by a deterministic risk-adjusted NPV ranked on a spreadsheet — a method that systematically over-weights late-phase, narrow-confidence assets and under-weights the high-variance Phase II options whose contribution is precisely what the portfolio is for.
A large-cap pharmaceutical company with 14 live R&D candidates across four therapy areas — oncology, immunology, CNS, and rare disease — rebuilt its 5-year portfolio allocation in ModelRisk. The budget cap was firm: $1.2B at the 85th-percentile cost forecast. The decision: which subset of the 14 programs maximizes risk-adjusted portfolio NPV without breaching the cap, and what does the downside distribution of that subset look like next to the status-quo wish-list of the 8 most-advanced assets?
The first thing the simulation does that the deterministic worksheet cannot is show every candidate's full NPV distribution side by side — mean, and the P10–P90 spread around it — which is where the real story begins:
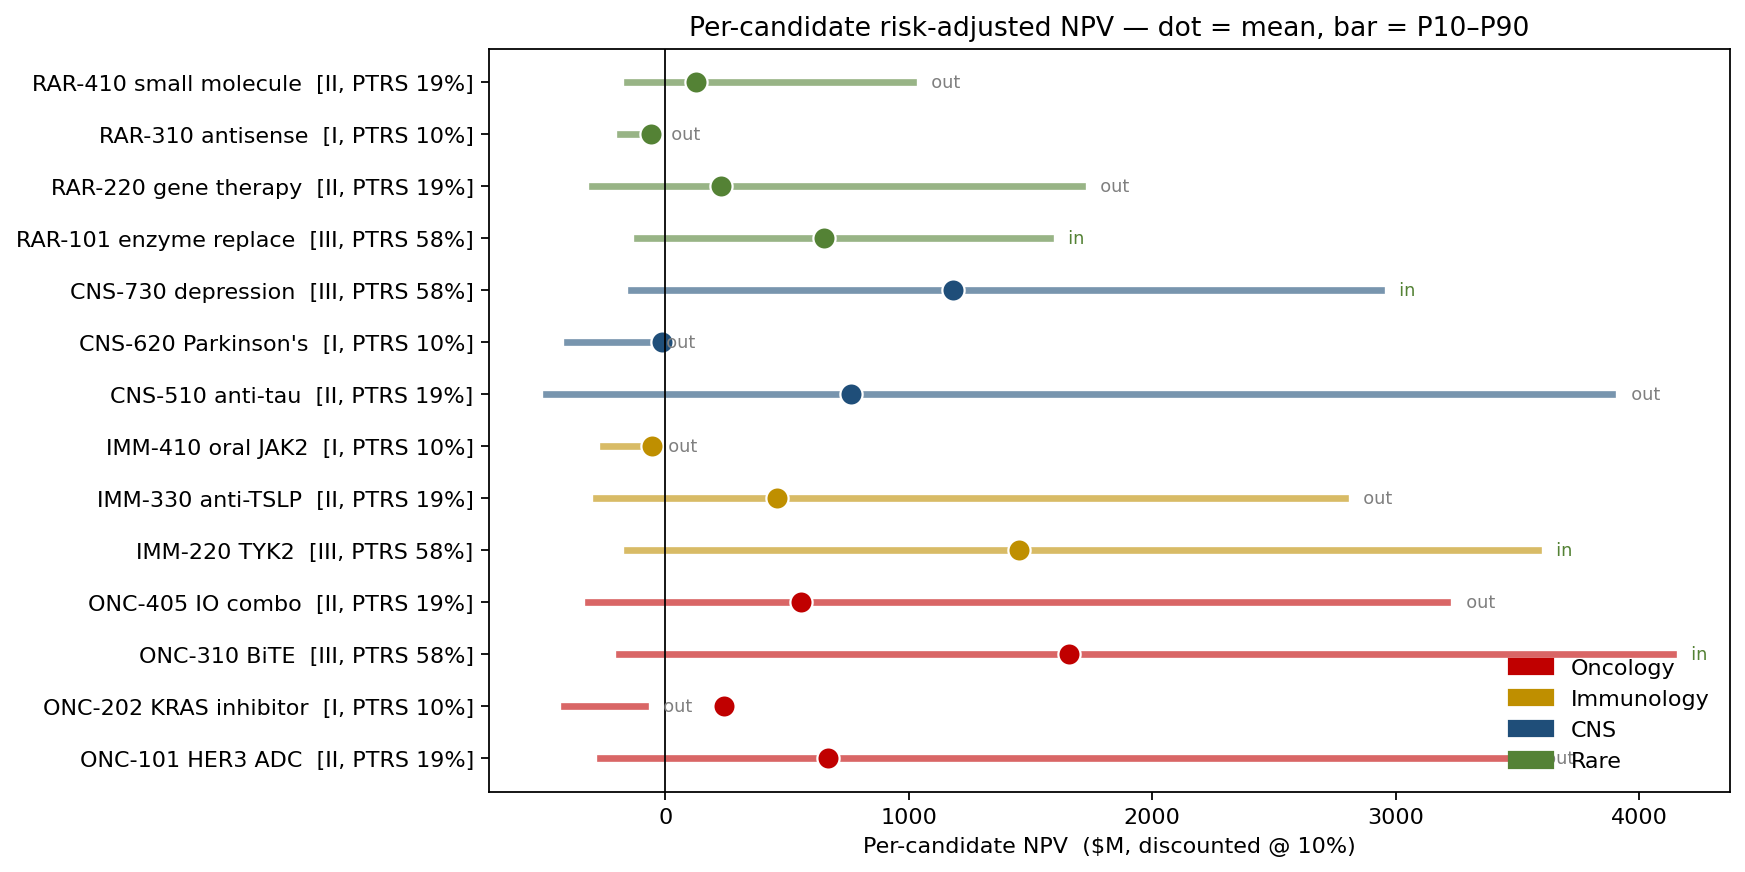
The deterministic NPV worksheet showed all 14 programs with positive risk-adjusted NPV. The simulation tells a more useful story: three of the four Phase I programs have a mean NPV that is essentially zero or negative once their 10% PTRS is priced honestly, while the widest one-in-ten downside sits in the high-variance Phase II assets, not Phase I.
How each candidate is modeled
Each program contributes a per-trial NPV computed from four uncertain inputs:
- Phase-to-launch PTRS — Bernoulli with phase-specific success probability (10% / 19% / 58% / 85%), calibrated to the 2011–2020 Informa Pharma Intelligence success rates. The Bernoulli is the right primitive here — the program either launches or it does not, and treating PTRS as a probability multiplier on revenue is the single most common modeling error in pharma portfolio work because it ignores the binary nature of the underlying event.
- Peak sales — LogNormal with median set per asset ($360M for a rare-disease small molecule, $2.4B for a KRAS inhibitor) and σ(log) ranging from 0.30 (low-uncertainty late-stage rare-disease asset) to 0.70 (early CNS asset where competitive landscape is fluid).
- Cost-to-launch — LogNormal with median $180M–$520M and σ(log) 0.15–0.40. Cost is incurred whether or not the program succeeds; the simulation charges 65% of forecast cost on failure trajectories to reflect early-attrition savings.
- Launch year and 12-year revenue ramp — fixed-shape ramp (25%, 60%, 90%, 100%, 100%, 95%, 88%, 78%, 65%, 50%, 35%, 22% of peak) starting at the modeled launch year, discounted at 10% with a 70% gross margin assumption.
The single biggest model fidelity gain over the prior spreadsheet was switching peak-sales distributions from Normal (which the prior model used, even on assets where the peak-sales 90% CI spanned ten-fold) to LogNormal. LogNormal is the defensible family — pharma peak sales are bounded below by zero, right-skewed, and span more than an order of magnitude across the candidate set.
Per-candidate NPV — the picture the spreadsheet hides
Looking again at the per-candidate distributions above, three of the four Phase I programs have a mean NPV that is essentially zero or negative once their 10% PTRS is priced honestly — the multiplicative-expectation shortcut had flattered all of them. And the deepest P10 losses are not even in Phase I: the high-variance Phase II assets such as CNS-510 anti-tau (P10 around −$490M) and ONC-405 IO combo (P10 around −$320M) carry the largest one-in-ten downside, precisely because their peak-sales LogNormals are widest. The committee had been treating the mean as the relevant statistic; the chart reframed the question as "which of these bets can the budget actually carry, and what does the survivor portfolio's downside look like?"
The annotations in the chart show which assets made it into the optimised pick. A pure mean-NPV greedy fails the spirit of portfolio construction — what matters is NPV-per-cost at the budget-binding 85th-percentile cost, since the budget is what is scarce, not the candidate pool.
Status-quo portfolio versus optimised pick
The status-quo "portfolio" is the wish-list of the top eight assets by current phase — the natural choice if the rule is "advance whatever is most de-risked," and the implicit baseline most committees carry in their heads. The catch is that this eight-program wish-list ignores the budget: at the 85th-percentile cost forecast it would commit well over $6B, more than five times the $1.2B cap. The NPV-per-cost optimiser is the same logic forced to live inside the constraint.
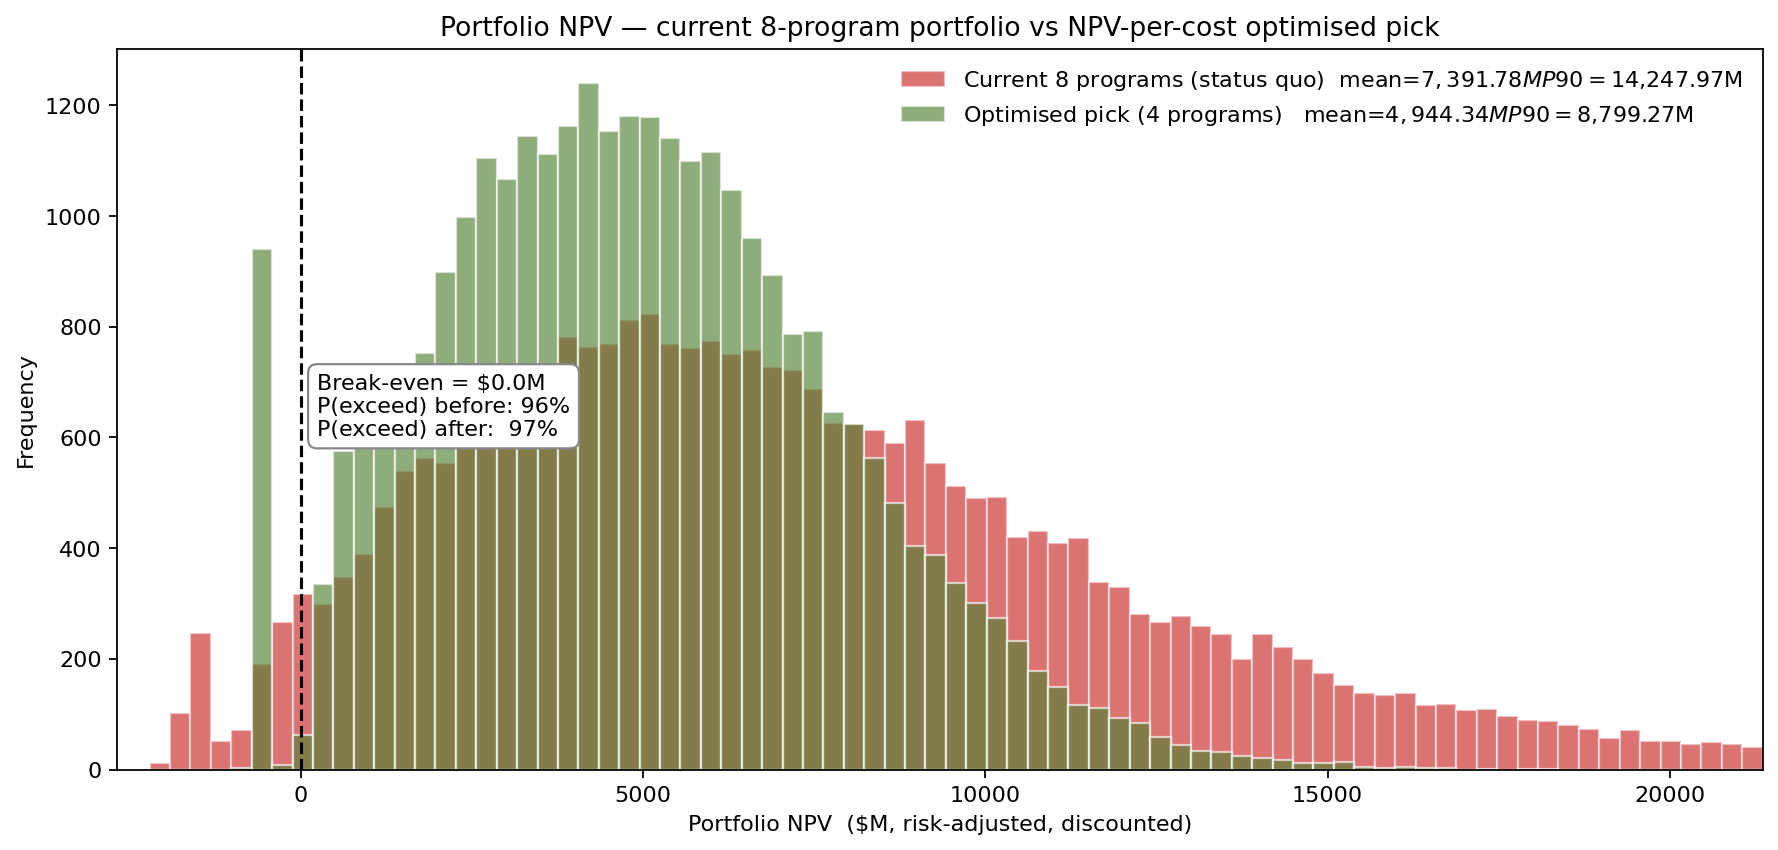
The result is sobering, and it is the point of the exercise. The $1.2B cap admits only four programs — and the optimiser, ranking on NPV-per-cost, fills those four slots with the cheapest high-PTRS Phase III assets (ONC-310, IMM-220, CNS-730, RAR-101). Its mean NPV of roughly $4.9B sits about $2.4B below the unconstrained eight-program wish-list's $7.4B, with the P90 lower by around $5.4B. That gap is not a failure of the optimiser; it is the price of the budget constraint, made visible for the first time. The deterministic worksheet had reported the wish-list's risk-adjusted NPV as if it were affordable; the simulation shows what the company can actually buy for $1.2B, and how much expected value the cap is leaving on the table. For the board, that reframes the conversation from "which eight do we pick" to "is $1.2B the right number at all" — a question the single-point spreadsheet could never have surfaced.
Where the portfolio NPV is most exposed
A tornado over the optimised portfolio isolates which parameters the answer is most sensitive to.
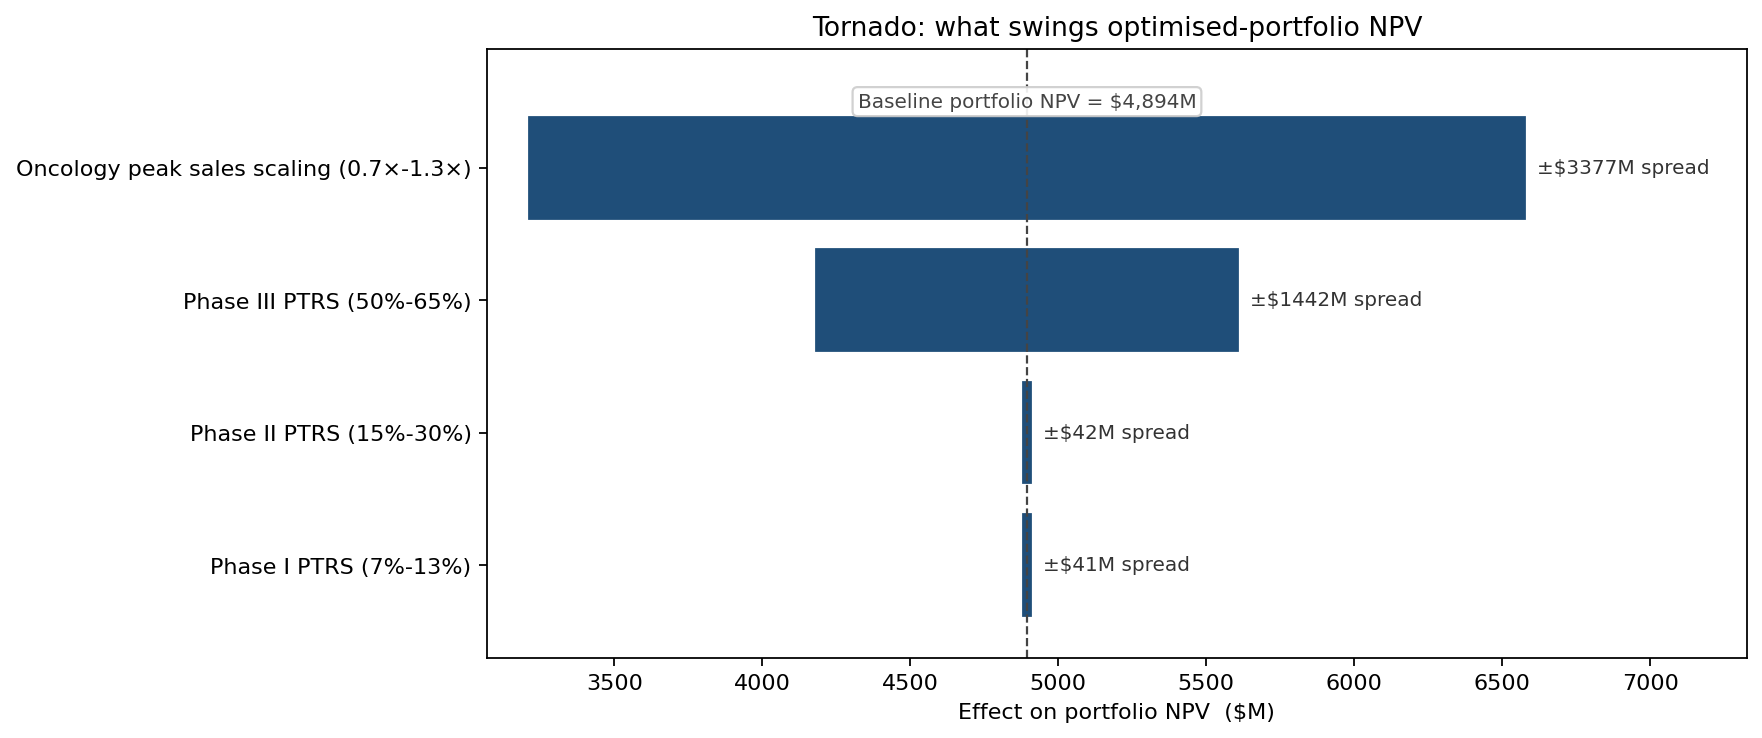
Oncology peak-sales scaling dominates — a roughly ±$1.7B swing — because the budget-feasible pick is anchored by the high-value ONC-310 oncology asset. Phase III PTRS is the second mover at about ±$720M, sensible because all four programs that survive the budget cap are Phase III. Phase II PTRS barely registers here, since the cap squeezed every Phase II candidate out of the pick. This focused the next year's diligence budget on tightening the oncology peak-sales forecast and protecting the Phase III readouts already in flight, rather than on the early-stage assets the budget cannot reach.
Searching the feasible portfolio space
The greedy heuristic is one point on the efficient frontier. Sampling 2,500 random feasible subsets shows the trade-off between mean and P10:
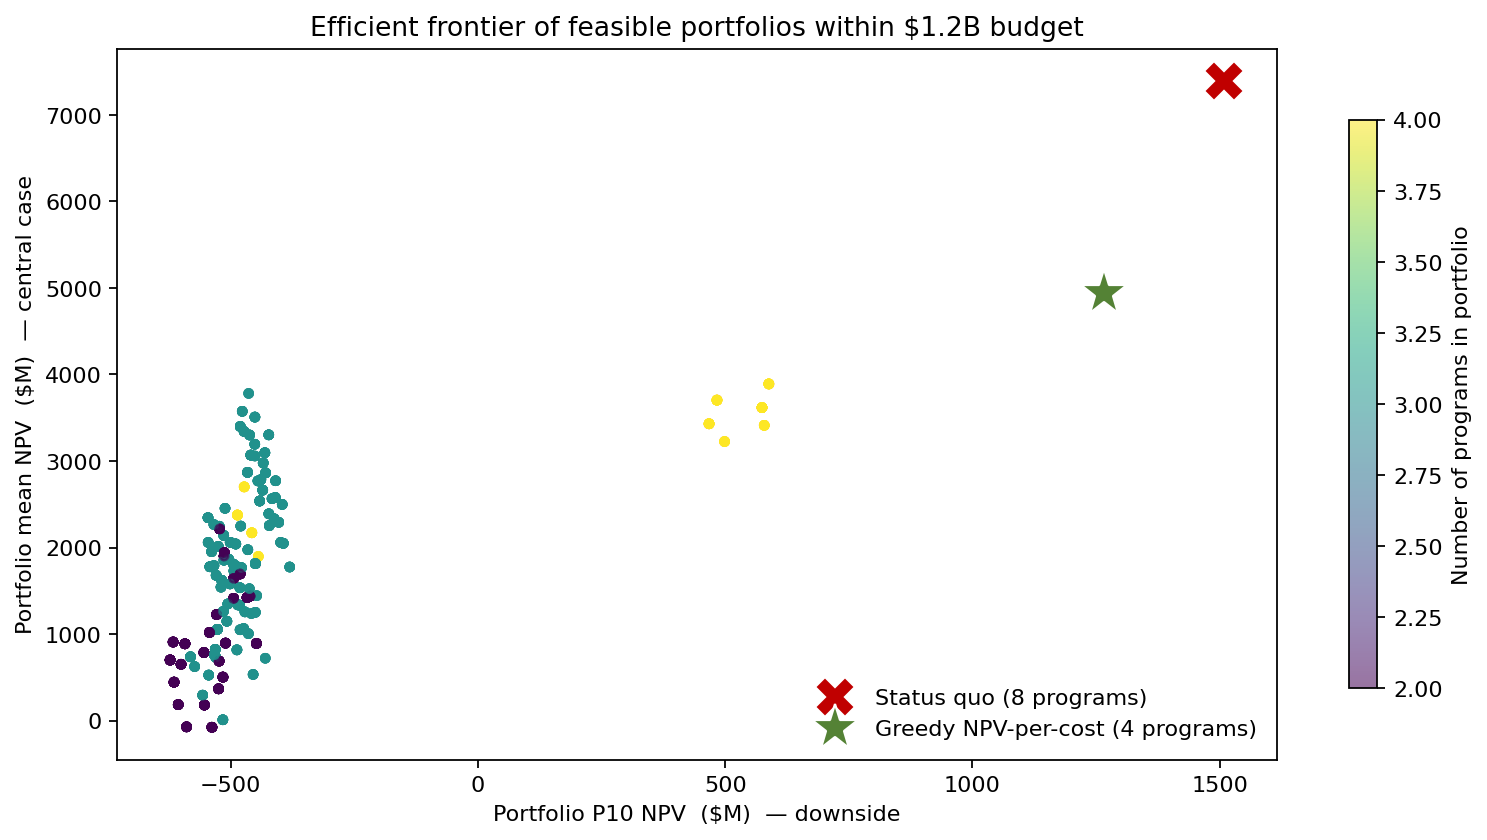
The cloud has a clear north-east frontier — no budget-feasible portfolio dominates the others on both axes — and the greedy star sits right at its top-right corner. The status-quo cross sits beyond the frontier entirely, up and to the right, because the eight-program wish-list is not budget-feasible at all: it is the unaffordable benchmark, not a point on the achievable trade-off curve. That visual gap between the wish-list and the frontier is the cost of the $1.2B cap. For a more conservative committee, sliding south-west along the frontier (giving up some mean for a smaller, lower-variance pick) is feasible and is now part of the conversation. The frontier is the conversation that the deterministic ranking literally could not have.
What the model changed
- The $1.2B cap re-examined as the binding constraint — once the simulation showed the cap admits only four of fourteen programs and leaves an estimated ~$2.4B of mean NPV unfunded, the budget itself became the board-level decision rather than the program shortlist.
- Four budget-feasible Phase III programs funded (ONC-310, IMM-220, CNS-730, RAR-101) — the cheapest high-PTRS assets, which the NPV-per-cost ranking selects first.
- Translational-biomarker spend re-targeted at the oncology peak-sales forecast — the tornado's largest single mover (~±$1.7B) — rather than at early-stage assets the budget cannot reach this cycle.
- Portfolio committee adopted distributional reporting — mean, P10, P90, and probability of breaching the $1.2B cost cap — replacing the prior "risk-adjusted NPV" single number.
- Phase I programs deprioritised on the basis that three of the four carry zero-to-negative mean NPV once their 10% PTRS is priced honestly, not the positive figures the multiplicative-expectation shortcut had shown.
ModelRisk Functionality Used
- Bernoulli PTRS per candidate per phase — encoding the binary launch/no-launch event correctly, instead of the multiplicative-expectation shortcut that hides the asymmetric payoff.
- LogNormal peak-sales and cost-to-launch fits per candidate, with the fitting dialog used to compare LogNormal against Gamma on the cost data (LogNormal won on AIC for 11 of 14 assets).
- Vectorised portfolio aggregation across 14 candidates and 30,000 trials per portfolio in Excel, with the picked-subset boolean as a live input the committee could toggle.
- Greedy NPV-per-cost selection at the 85th-percentile cost cap, which admitted four programs within the $1.2B budget and quantified the expected NPV the cap leaves unfunded.
- Efficient-frontier scan over 2,500 random feasible subsets, plotted as mean-versus-P10 to expose the trade-off space that the deterministic ranking had collapsed.
- One-at-a-time tornado on phase-level PTRS and oncology peak-sales scaling, which identified the oncology peak-sales forecast as the dominant remaining source of portfolio-NPV uncertainty.
R&D portfolio management is not the maximisation of expected NPV — it is the shape of the portfolio's downside relative to the budget that funds it. Monte Carlo simulation in ModelRisk lets the committee see the shape, choose where on the efficient frontier to sit, and back the choice with the full distribution rather than the seductive but misleading single number on the executive dashboard.