

Industry: Pharmaceutical
Product: ModelRisk
Application: Market Penetration Analysis
Launch-curve simulation for a first-in-class therapy: where peak share really lives
A new pharmaceutical asset launching into a competitive specialty class typically tops out somewhere between 5% and 25% of the addressable patient pool — but the difference between 8% and 18% on a 220,000-patient indication is roughly $1 billion of peak revenue. The marketing forecast that goes to the board is almost always a single S-curve drawn through a single set of assumptions. The board then commits API manufacturing capacity, salesforce headcount, and sample budgets to that line. When the real curve lands above or below it, capacity is either stranded or stocked-out for two years before it can be rebalanced.
A specialty pharmaceutical company preparing the launch of a first-in-class oral therapy rebuilt its forecast in ModelRisk as a fully probabilistic Bass diffusion simulation. The goal was not a better single number — the marketing team had no shortage of numbers. The goal was the shape of the uncertainty band around the launch curve, so that capacity and headcount decisions could be sized to a defensible P90, not to a best-guess P50.
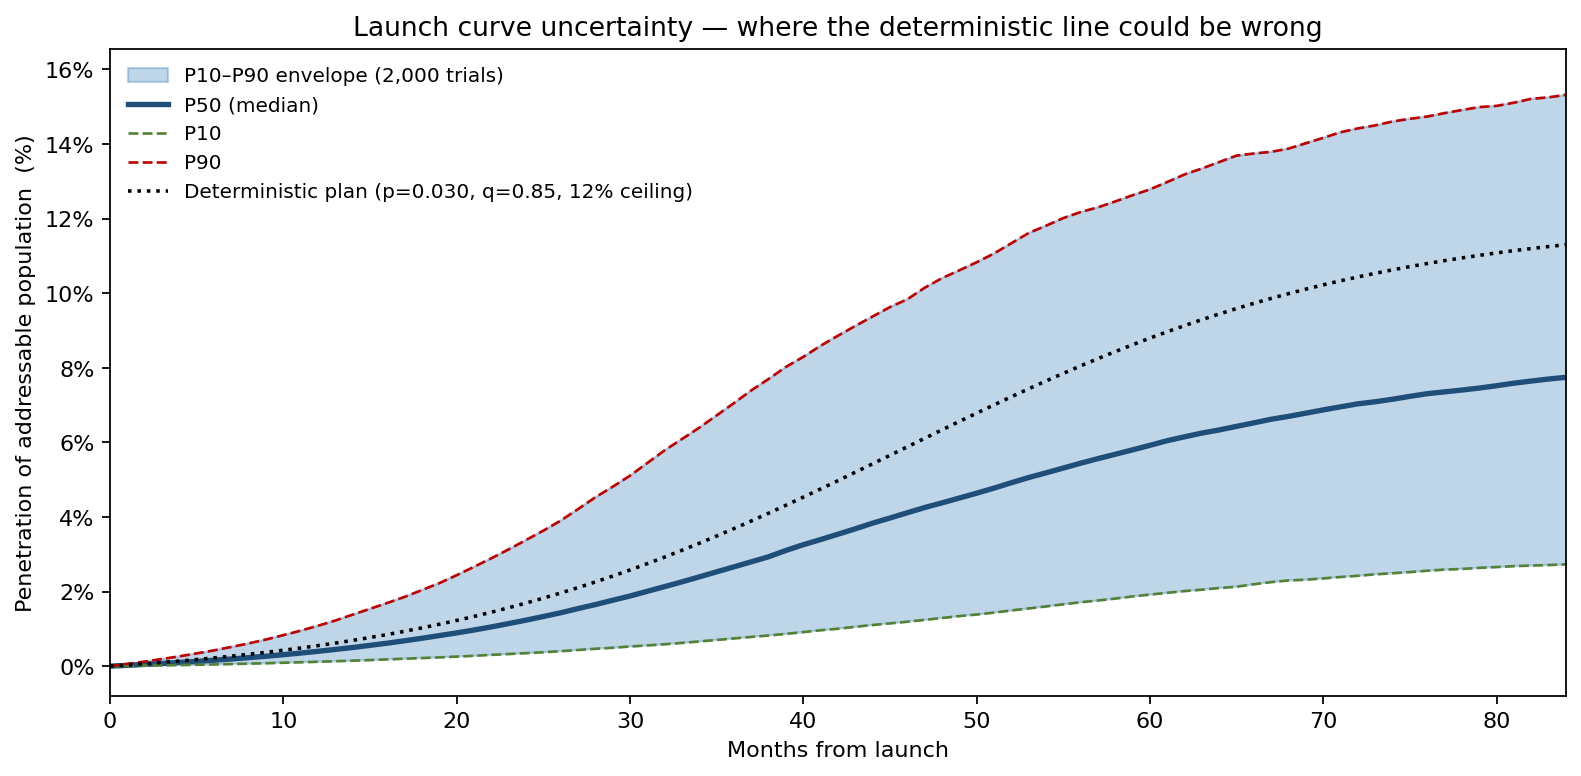
That band is the whole point. The deterministic plan is a single dotted line through the centre; the 2,000-trial fan around it shows how little that line actually constrains the decision. At month 36, simulated penetration of the addressable population spans a P10 of 0.7% to a P90 of 7.1%; by month 60 the band has widened to 1.9% – 12.8%, a spread comparable to the height of the deterministic curve itself. The deterministic line is not wrong on average — by construction it sits near the median — but a single value tells the supply-chain team nothing about whether to build a 200,000-vial peak-month capacity or a 320,000-vial one. The fan does.
Why Bass, and why probabilistic Bass
The Bass diffusion model describes cumulative adopters as
\[ N(t) = m \cdot \frac{1 - e^{-(p+q)t}}{1 + (q/p)\,e^{-(p+q)t}} \]
where \(m\) is the ultimate adopter ceiling, \(p\) is the coefficient of innovation (external influence — sales reps, conference data drops, payer wins), and \(q\) is the coefficient of imitation (word-of-mouth between prescribers and between patients). Closed-form, the time to peak monthly adoption is
\[ t^{*} = \frac{\ln(q/p)}{p+q} \]
The standard launch deck picks a single \((p, q)\) — often \(p = 0.030,\,q = 0.85\) borrowed from an analogue launch — and reports the resulting curve. But for a first-in-class asset there is no analogue, and the parameters that look most similar to an SGLT2 launch can produce a six-times-faster ramp than a parameter set drawn from a J&K-style biologic. The honest answer is a joint distribution over \((m, p, q)\), propagated through the closed form.
The team modeled the inputs as:
- Addressable population — LogNormal with median 220,000 patients and a 15% coefficient of variation, reflecting epidemiology-survey error in a still-being-characterized indication.
- Ceiling share of class — Beta scaled to a [0, 45%] range with mode at 12%, encoding the regulatory label width, competitive entry expectations within 36 months, and physician share-of-mind. Beta is the right family here because share is bounded; using Normal lets the simulator draw negative or above-100% shares.
- Innovation coefficient \(p\) — LogNormal with median 0.030 and σ(log) = 0.55, the empirical spread observed across 40 specialty launches in the Lilly–Pfizer–Roche analogue library.
- Imitation coefficient \(q\) — LogNormal with median 0.85 and σ(log) = 0.35, narrower than \(p\) because imitation behavior is more stable across analogues than innovation pull.
Peak share — the launch number that matters
Marketing, finance, and manufacturing all converge on a single derived metric: peak share of the addressable class. The full simulated distribution looks like this:
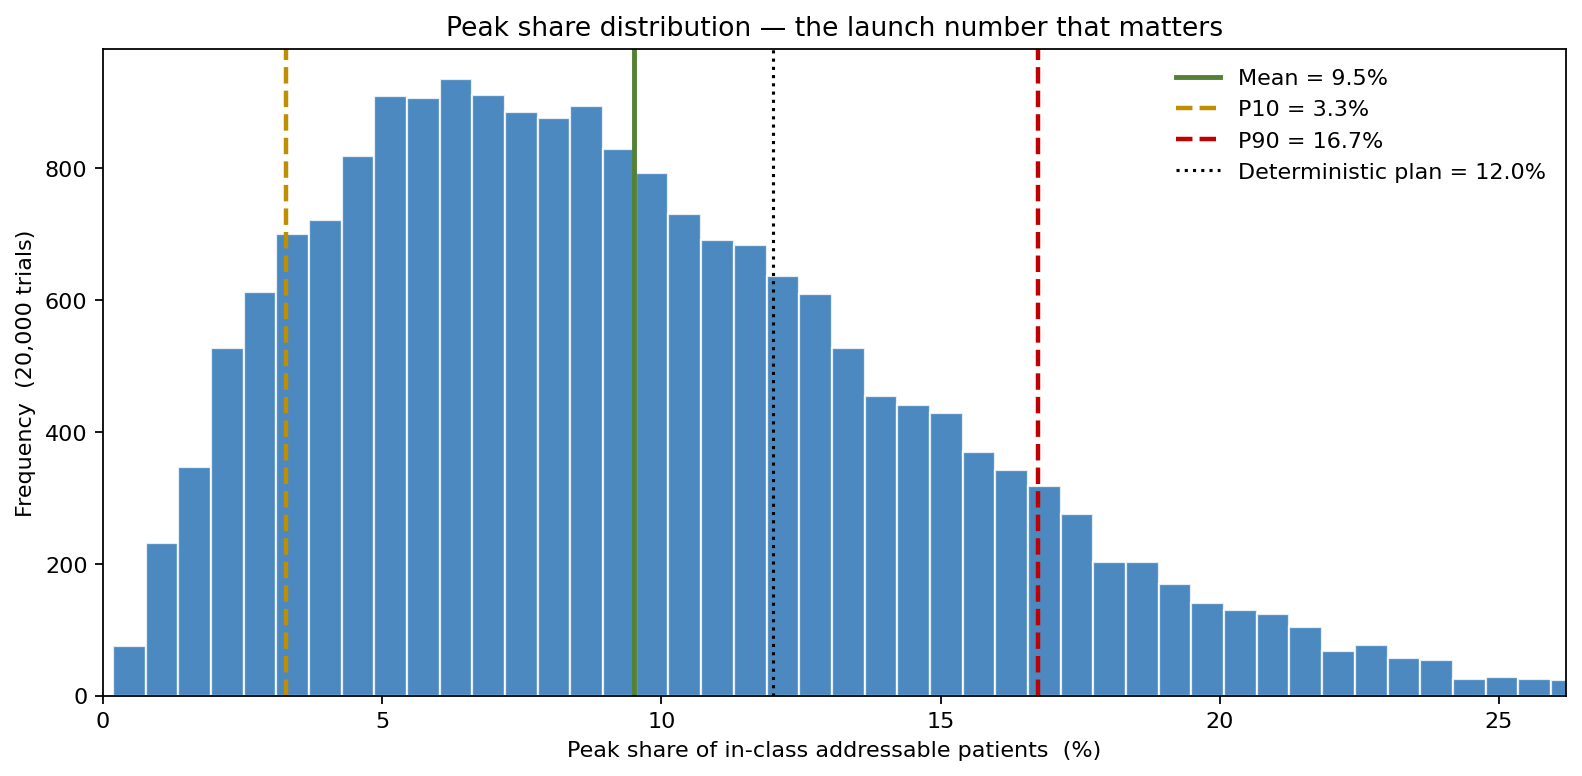
The deterministic plan said 12.0%. The Monte Carlo simulation put the mean at 9.5% — already below the plan — and revealed a P10 of 3.3% against a P90 of 16.7%, a five-fold spread between the cautious and optimistic ends. For an analyst sizing a fill-and-finish line, the deterministic 12% is the wrong question; what the line needs to cover is an upper percentile of peak share, not its mean. The P85 of peak share is 15.1% — roughly a quarter above the deterministic plan — and it was the basis the capital request was eventually approved against.
What swings the peak
A one-at-a-time tornado isolates the contribution of each input to the peak-share output.
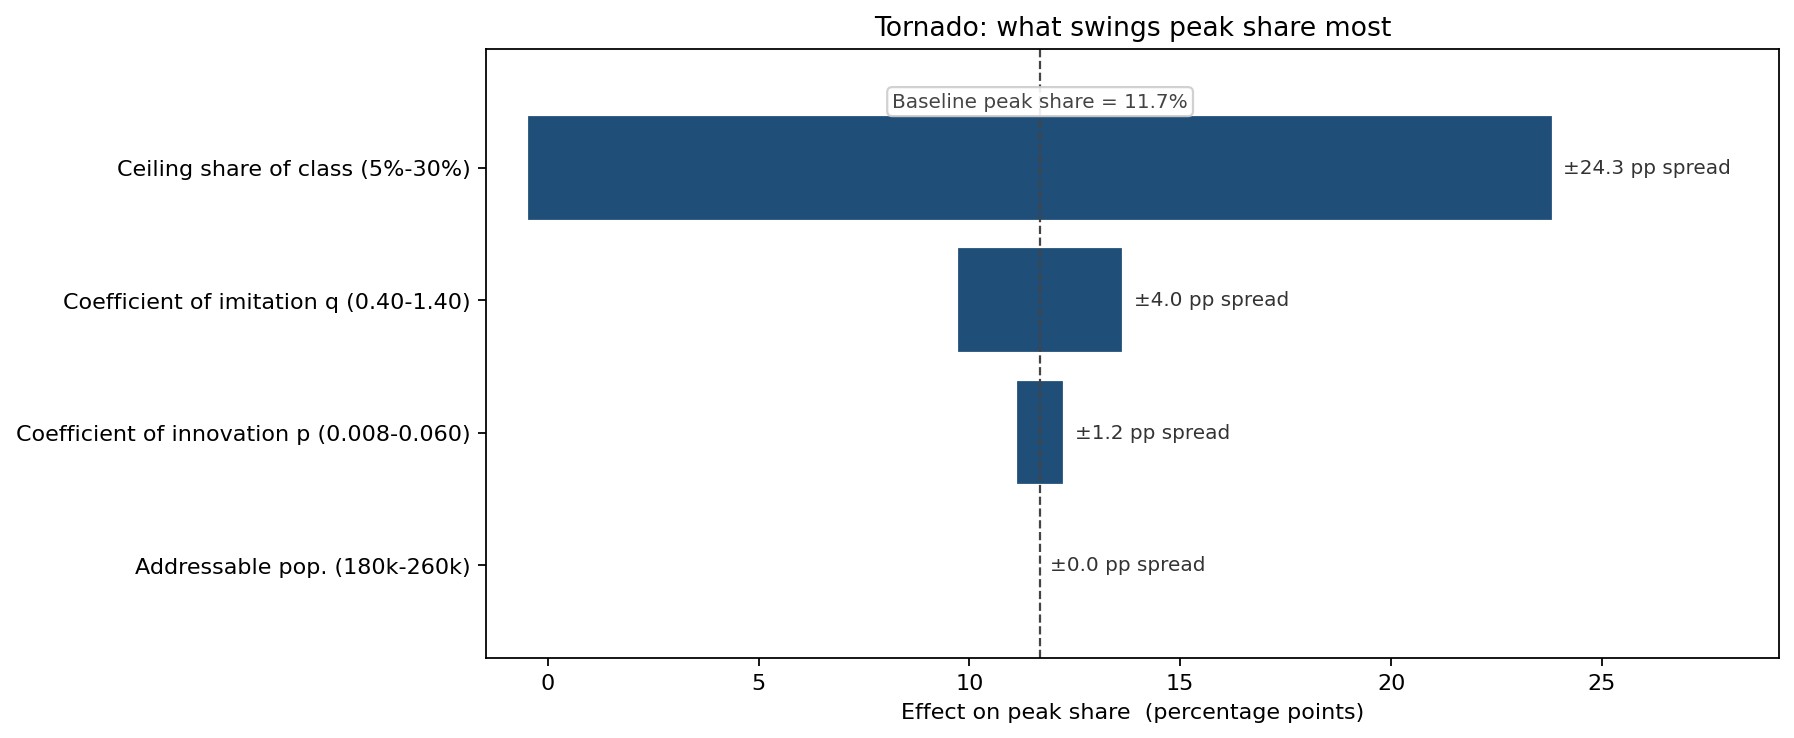
The ceiling share of the class dominates — which is intuitive but also pointed: the highest-marginal-value market-research investment is payer and KOL work that compresses the uncertainty band on the ceiling, not refinements to the imitation coefficient. The launch readiness team rebalanced its primary-research budget the week after this chart was first shown.
Three payer-access scenarios, three CDFs
The peak-share distribution above assumes a "middle" payer reception. In practice the launch will sit somewhere on a spectrum from a step-edited Tier-3 placement (where uptake is throttled by prior-authorization friction) to a clean Tier-2 with no step. Multiplying the modeled peak share by the empirical access-friction factor produces three CDFs:
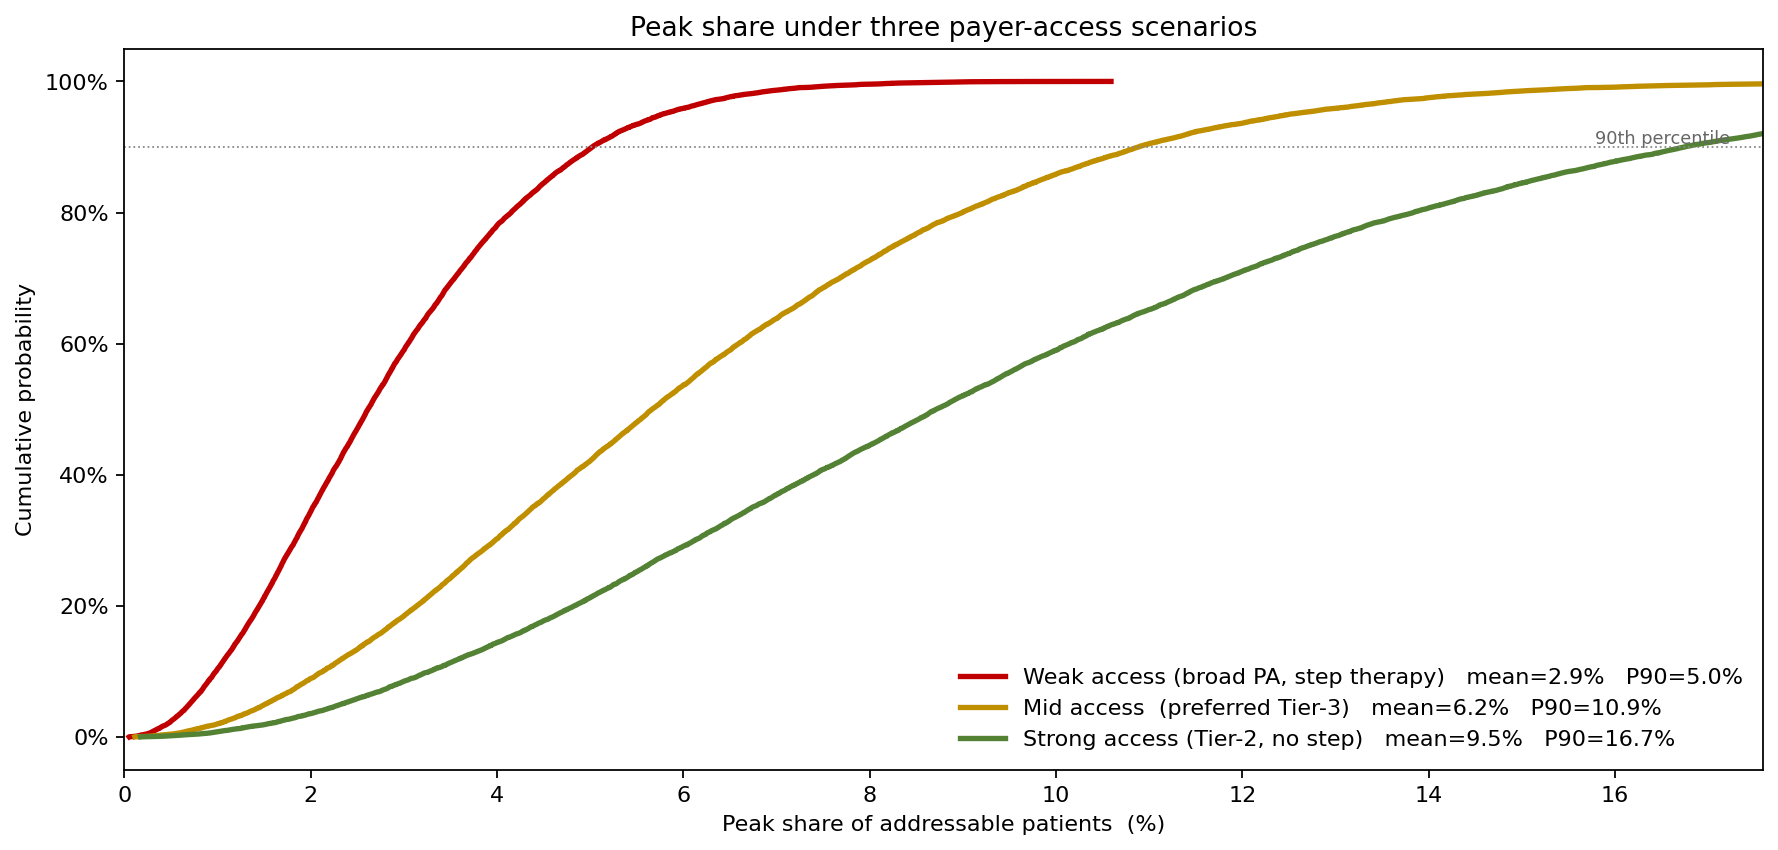
The chart shows the asymmetry payers create. Weak access (a 0.30× friction factor) does not just shift the median down — it compresses the upper tail almost completely, capping the P90 outcome at 5.0% against a mean of just 2.9%. Mid access (0.65×) lifts the P90 to 10.9%, and strong access (Tier-2, no step) opens it to 16.7% at a 9.5% mean. For commercial leadership, this reframes payer negotiation: a $30M GTN concession that converts mid-access to strong-access does not buy median revenue, it buys right-tail revenue — and right-tail revenue is what justifies the second manufacturing line.
What the model changed
- Peak production line sized to the P85 (15.1% peak share), not the mean (9.5%) — a roughly 60% capacity buffer over the mean that the deterministic plan would have rejected as wasteful, and avoiding a projected 8–14 month stockout under the optimistic uptake scenario.
- Salesforce expansion held to Wave 1 only until 18-month real-world data lands. The simulation showed Wave 2 ROI was negative in 38% of trajectories and the team had been about to commit to it.
- Payer concession reframed as tail-value purchase — the GTN deal that opened Tier-2 access was approved on the basis of the right-tail revenue it unlocked, rather than the central-case revenue lift it could not credibly demonstrate.
- Forecast governance — the marketing forecast is now a P10/P50/P90 triple rather than a single line. Variance against the band, not against a point, is what finance reports on quarterly.
ModelRisk Functionality Used
- Bass diffusion in closed form, evaluated in-cell for 2,000 stochastic \((m, p, q)\) draws — no scripting, just an Excel formula recomputed under simulation.
- LogNormal fits for \(p\) and \(q\) based on the 40-launch analogue library, with the fitting dialog used to compare candidate distributions against the empirical CDF.
- Beta on the ceiling share, replacing the team's original Triangular — which had a hard upper bound at 25% and was clipping plausible upside.
- Fan chart and percentile bands of the time-varying penetration curve, used in the supply-chain capacity submission rather than the original point forecast.
- One-at-a-time sensitivity to rank the four inputs by contribution to peak-share spread, which redirected the primary-research budget toward payer ceiling work.
- Scenario re-simulation under three payer-access regimes, producing the CDFs that reframed the Tier-2 negotiation.
In a first-in-class launch, the most valuable forecasting output is not a number — it is the shape of the uncertainty around the launch curve. Monte Carlo simulation in ModelRisk is what makes that shape visible and, once it is visible, capacity, headcount, and payer-deal decisions can each be sized to the part of the distribution they actually risk.