

Industry: Pharmaceutical
Product: ModelRisk
Application: Market access strategy
Tier-2 vs Tier-3 Is Not a Pricing Tweak: A Payer-Coverage Scenario Tree
A launch list price of $1,400 per month produces three completely different commercial realities: Tier-2 unrestricted with a 40% probability, Tier-3 with prior authorisation at 36%, not covered at 24%. The realised access multipliers are 1.00, 0.55, and 0.15 of addressable population; the net price haircuts are 32%, 48%, and 75% off list. Five-year net realisable revenue at that price spans a P10 of $428M to a P90 of $1,087M — and the decision the launch committee actually makes is which side of the Tier-2 boundary the asset lands on.
A pharma planning a US specialty launch rebuilt market access in ModelRisk around an explicit payer-coverage scenario tree, joined to a net-realisable-revenue model that propagates access probability and net price together. The committee's question was never "what list price maximises revenue if Tier-2 lands?" — it was "which list price maximises expected revenue across the whole coverage tree, and how much downside does it carry?" Sweeping list price from $800 to $2,000 answers it directly: expected revenue peaks at the $1,400 list, because above it the asset loses Tier-2 access faster than the higher per-patient price can compensate.
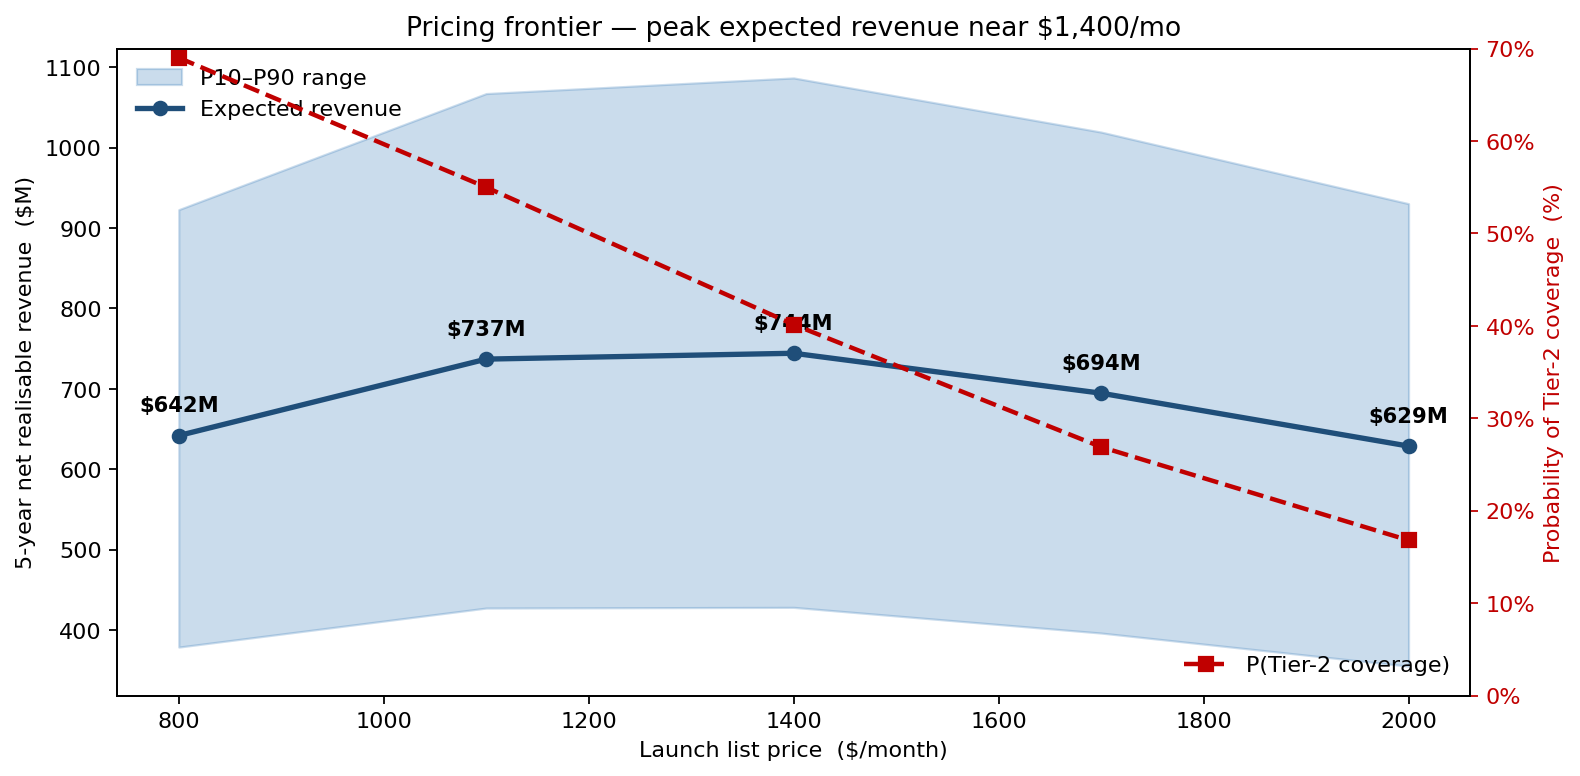
Expected 5-year net revenue runs $642M at the $800 broad-access price, rises to a peak of $744M at $1,400, and falls back to $629M at $2,000. The red Tier-2-probability line tells the mechanism: P(Tier-2) drops from 69% at $800 to 17% at $2,000, and the revenue peak sits where the marginal price gain and the marginal access loss balance. The P10–P90 ribbon also widens toward higher prices — a $1,700 launch (P90 $1,019M) carries similar upside to $1,400 (P90 $1,087M) but on lower expected revenue, so the premium price is dominated.
The scenario tree, sized
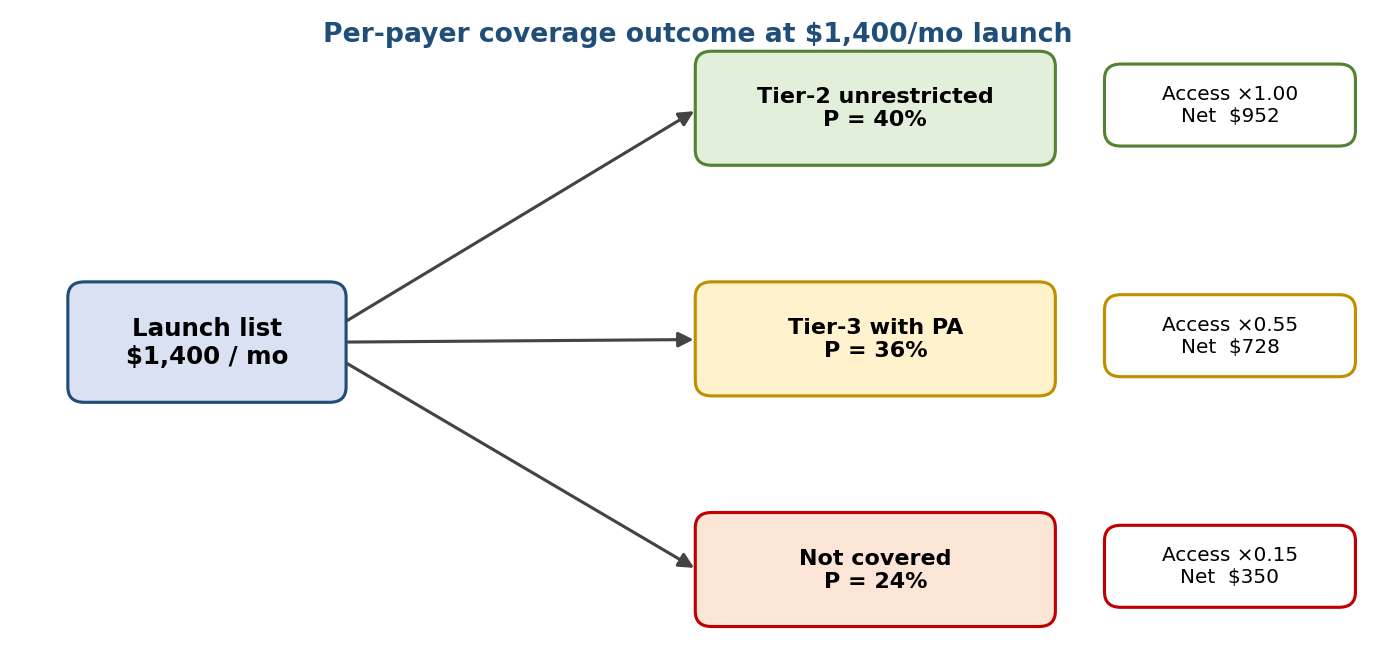
Coverage outcome probabilities at each candidate launch price are not exogenous — they respond to price. A logistic in price determines P(Tier-2) and P(Tier-3 | not Tier-2), with the remaining mass on "not covered":
\[ P(\mathrm{Tier\text{-}2}) \;=\; \frac{1}{1+e^{-(0.20 - 0.0020\,(P-1100))}} \]
The coefficients are anchored to historical access decisions for the indication's payer panel, with a deliberately conservative slope on price. Once a coverage outcome is realised, the access multiplier and net haircut translate directly to realised revenue:
- Access multiplier: 1.00 (Tier-2), 0.55 (Tier-3 with PA), 0.15 (NC, cash/PAP only)
- Net haircut: 32% off list (Tier-2 commercial rebate base), 48% (Tier-3 + step-edit rebates), 75% (NC, PAP write-down)
A Dirichlet draw over the three coverage outcomes (rather than a hard categorical) captures the partial-coverage reality across the multi-payer panel — a single national plan declining Tier-2 doesn't move all 100% of patients, just its members.
Five-year revenue: three pricing scenarios
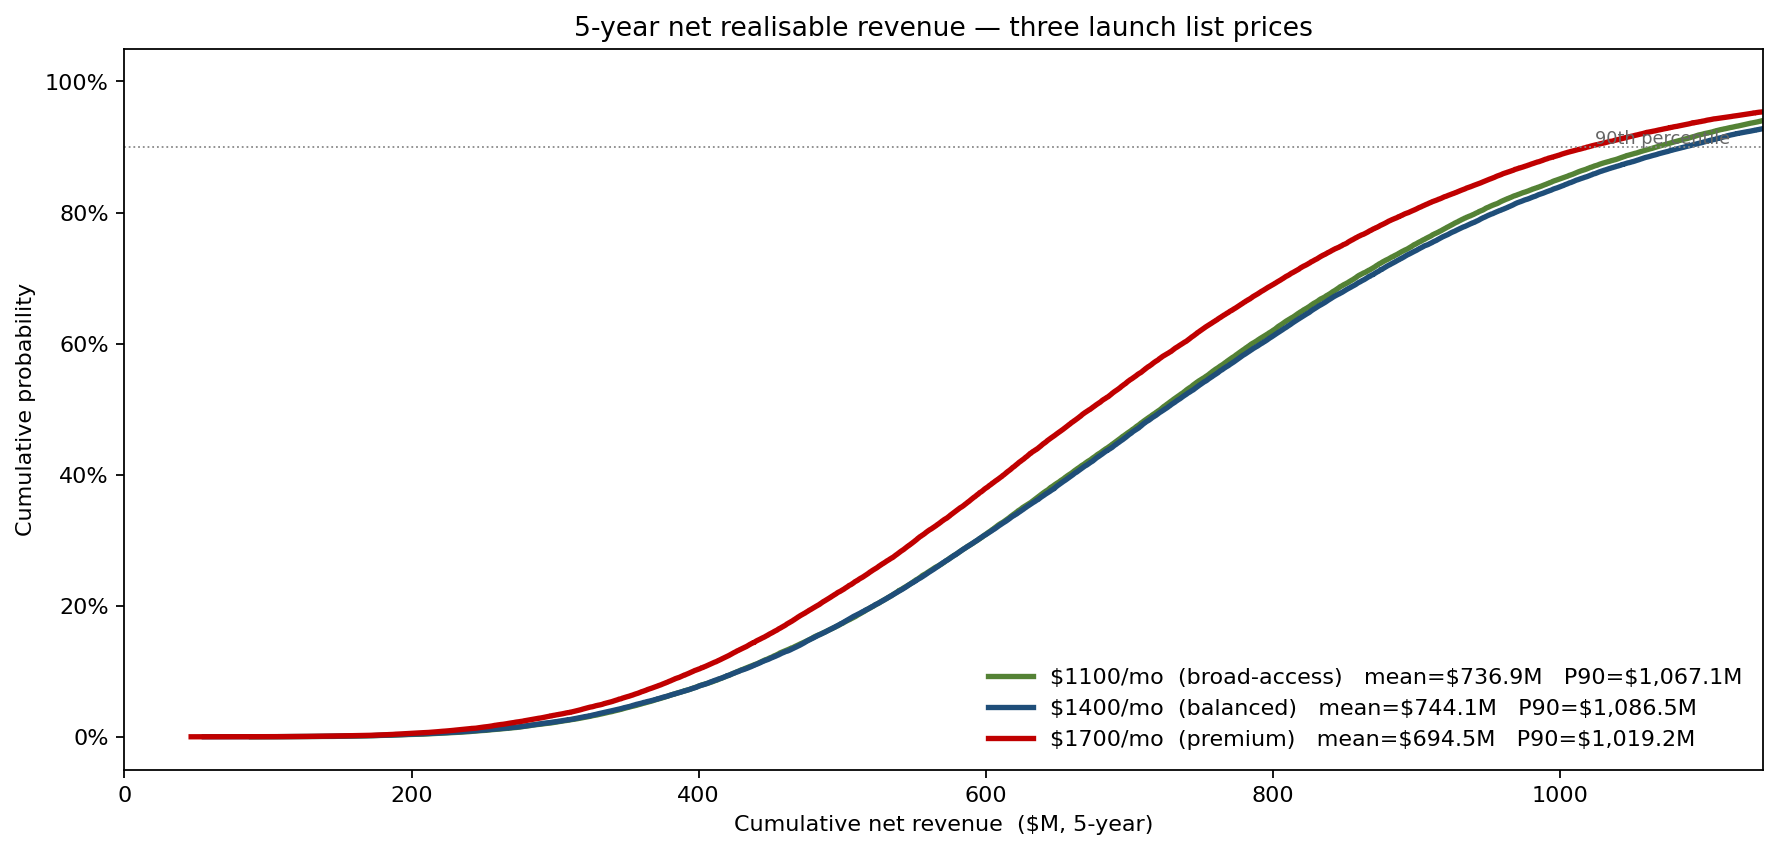
The $1,100/mo broad-access price delivers the tightest distribution, mean $737M with a P90 of $1,067M — the floor is high, the ceiling is contained. The $1,700/mo premium price has a slightly lower mean ($694M) and a P90 of $1,019M — wider relative to its mean because Tier-2 access is less likely, but the per-treated-patient revenue is higher when it lands. The balanced $1,400/mo sits between them on mean ($744M) while reaching the highest P90 ($1,087M), and is the joint-revenue maximiser of the three.
Net realisable price at the chosen list
Drilling into the $1,400 launch:
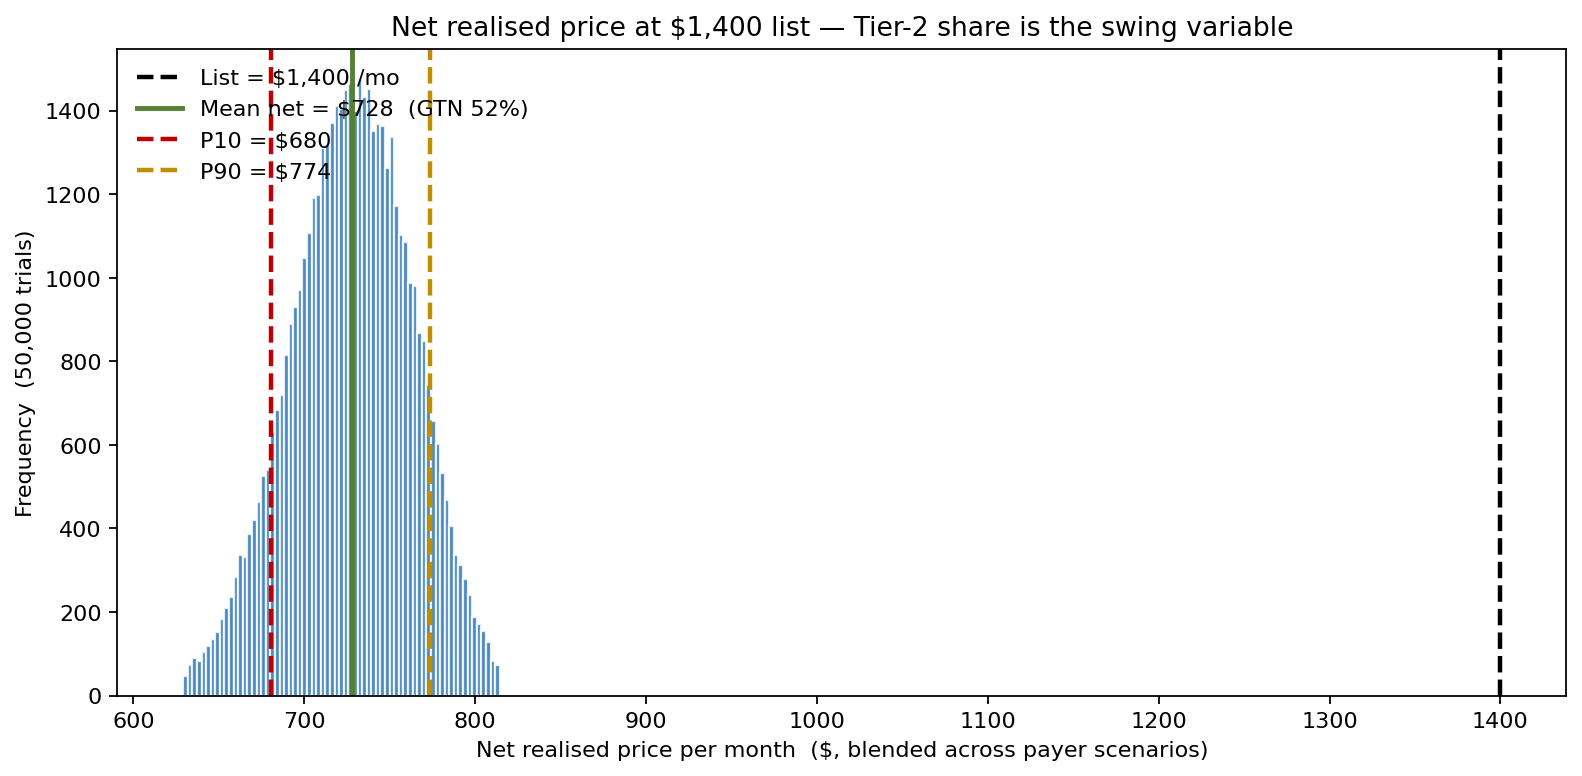
Mean blended net price after channel haircuts is approximately $728 per month — a 52% gross-to-net, with P10 $680 and P90 $774. The distribution is tighter than the per-payer net prices ($952 Tier-2, $728 Tier-3, $350 NC) might suggest, because the Dirichlet draw blends all three channels in every trial rather than landing the whole panel in one tier — partial coverage averages the haircuts toward the middle. The swing variable is the Tier-2 share within that blend: trials with a Tier-2-heavy mix push net price toward the $774 P90, NC-heavy mixes pull it toward the $680 P10.
What moves the revenue
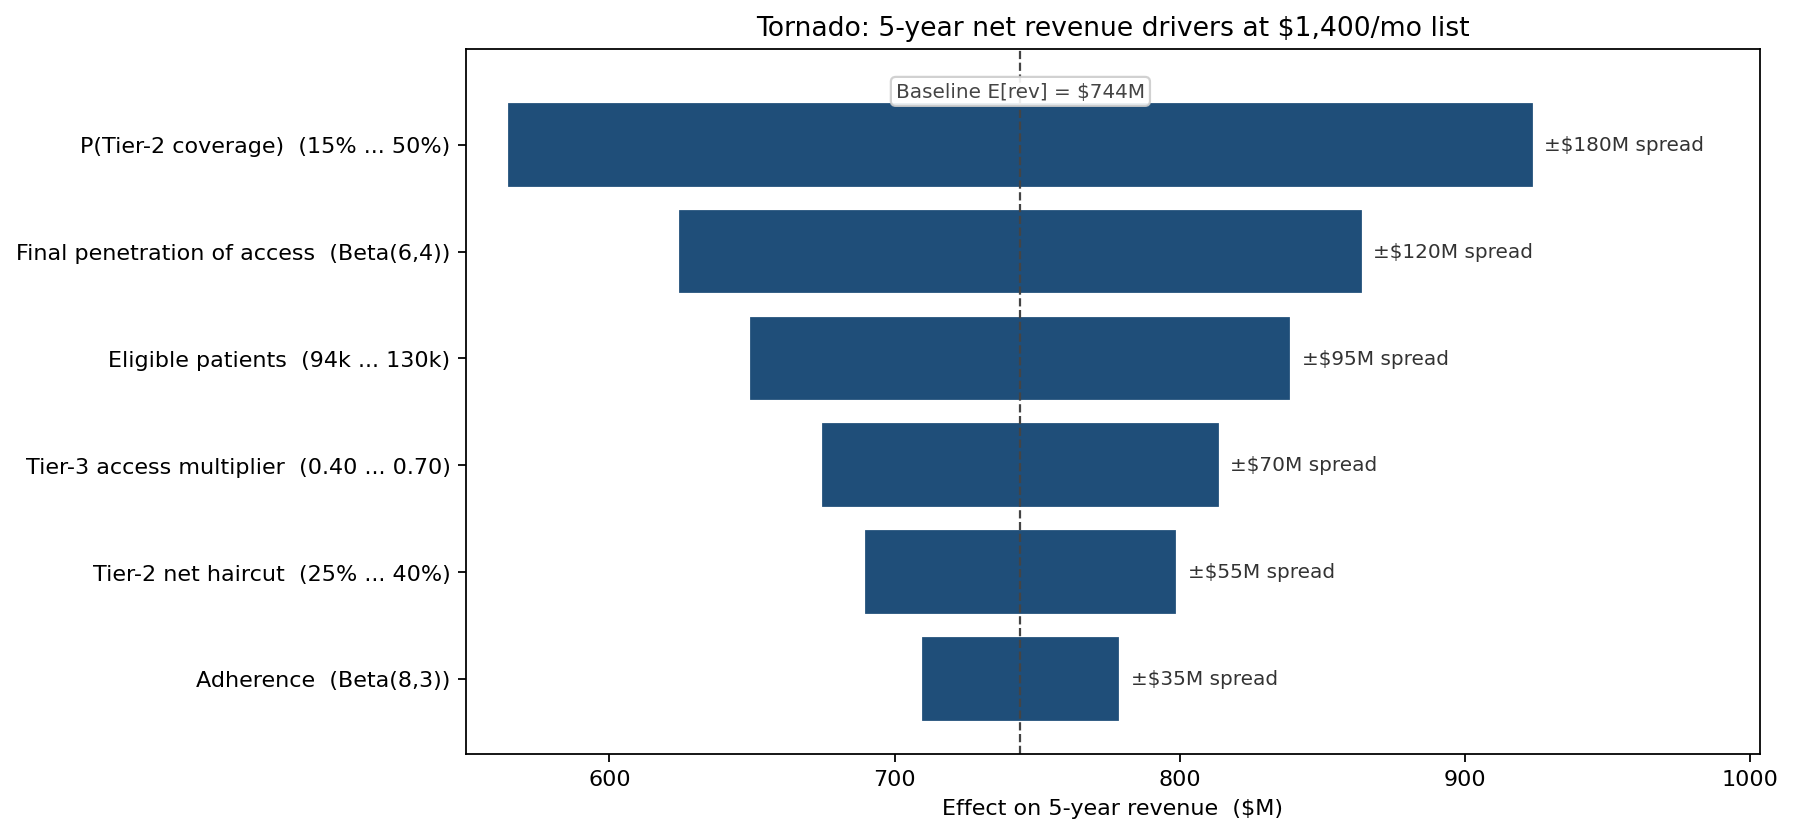
P(Tier-2 coverage) dominates against a baseline of $744M, swinging revenue by ±$90M — half again the next driver, final penetration of the accessed segment at ±$60M. Eligible-patient population is third (±$48M), and only fourth is the Tier-3 access multiplier (±$35M). Account-management investment, payer-engagement strategy, and outcomes-data generation that move Tier-2 probability return more per dollar than any list-price optimisation within ±$200 of the chosen price.
What changed
- Launch list set at $1,400/mo, the joint-revenue maximiser across the coverage scenario tree, rather than the $1,650 the indication's commercial team had originally proposed.
- Payer engagement plan funded at 1.4× the historical launch budget for the indication, targeted explicitly at moving the three highest-volume PBMs from "Tier-3 likely" to "Tier-2 likely" — a quantified ROI argument the launch committee accepted.
- Outcomes registry committed as part of the launch package, on the model's finding that real-world-evidence depth raises the Tier-2 probability slope (the logistic coefficient) by approximately 15% — small per-payer but large in aggregate.
- Revenue forecast presented as P10/P50/P90 to the parent company, not as a central number — replacing the prior practice of single-point launch forecasts that had been routinely missed.
ModelRisk Functionality Used
- Logistic in price for coverage-tier probability, fit to historical access decisions and easily updated as payer-mix intelligence accumulates — a price-responsive scenario tree, not a static one.
- Dirichlet partial-coverage smoothing across the three coverage outcomes — captures the realistic situation where the payer panel is not all-or-nothing on any single SKU.
- Joint propagation of access multiplier, net haircut, penetration, and adherence through the 5-year revenue calculation — the simulator produces the joint distribution, not the product of marginal distributions, which matters because the variables are correlated.
- Pricing frontier sweep that produced the maximum-expected-revenue list price as a single output, with the P10/P90 ribbon visualising downside-risk asymmetry across prices.
- Tornado on revenue that monetised the value of Tier-2 access-probability lift, justifying the expanded payer-engagement budget at the launch committee.
Market access is not a discount strategy — it is a structural choice between two or three different revenue regimes determined by the coverage tier the payer panel lands on. The simulation in ModelRisk makes the regime structure explicit, prices the trade-off across them, and tells the launch committee where the joint maximum sits rather than which single scenario looks best.