

Industry: Pharmaceutical
Product: ModelRisk
Application: Inventory optimization
A 24-Month Shelf Life Changes Everything: (S, s) Policy For a Cold-Chain Biologic
A 2-to-8°C biologic arriving at specialty pharmacies with a typical 16 months of remaining shelf life cannot be inventoried like an aspirin. Hold too little and the 9-to-16-week supply lead time turns one bad demand week into a stockout that costs $480 per vial in expediting and lost revenue. Hold too much and the same product expires on the shelf at $1,150 per vial in destruction and reverse-logistics. The standard Wilson EOQ — built for non-perishable goods with deterministic demand and deterministic lead time — gets every part of this problem wrong.
A biologics distributor rebuilt its (S, s) periodic-review policy in ModelRisk against a simulator that tracks each pallet's remaining shelf life lot-by-lot. The objective: minimise expected total cost across stockout penalty, expiry write-off, holding, and ordering. The result reframes the entire problem — total cost is not a smooth function of "how much inventory you hold" but a battle between two cost lines that dominate at opposite ends of the policy range.
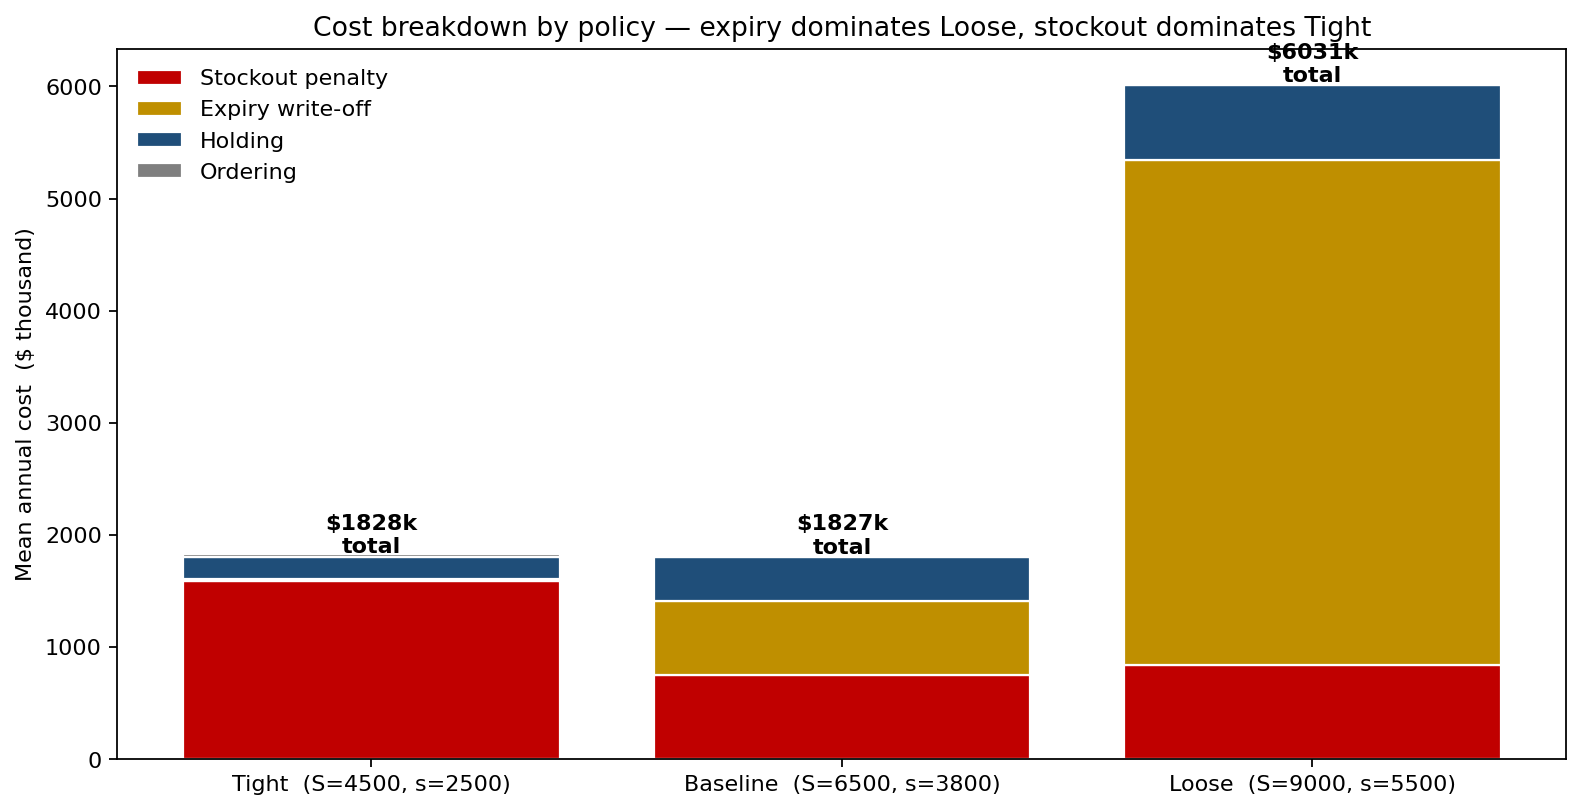
Three candidate (S, s) configurations expose three different failure modes. The tight policy (S=4500, s=2500) keeps expiry near zero but lets stockout penalty consume 87% of its $1,828k mean annual cost. The loose policy (S=9000, s=5500) all but eliminates stockout, but pays a crushing expiry tax — 75% of a $6,031k annual bill is the $1,150-per-vial write-off line. The baseline (S=6500, s=3800) balances the two at $1,827k, with stockout (41%), expiry (36%), holding (21%), and ordering (1%) all in play. For a finance director used to a single "inventory cost" line, the simulation breaks out what is actually being paid for — and exposes that the loose policy's high service comes almost entirely from absorbing expiry waste.
Three uncertainties that don't combine cleanly
The simulator models each week of a three-year horizon with three independent stochastic inputs:
- Weekly demand as Negative Binomial with mean 320 vials and dispersion 1.9 — Poisson would understate the over-dispersion observed in the SKU's two years of history, especially the demand spikes that follow new-prescriber onboardings.
- Supply lead time as Triangular(6, 9, 16) weeks — manufacturing batch + QC release + cold-chain transport. The right-skew matters: short lead times are common, occasional 16-week waits define the safety-stock requirement.
- Remaining shelf life on receipt as Triangular(12, 16, 22) months. The variability is a function of when in the manufacturer's batch the shipped lots came from — not a controllable input, but one that materially drives expiry waste.
Costs: $14 per vial-month holding, $480 per vial stockout penalty, $1,150 per vial expired write-off, $4,200 per purchase order.
Total cost as a full distribution
The CDF of total annual cost makes the regime change unmistakable:
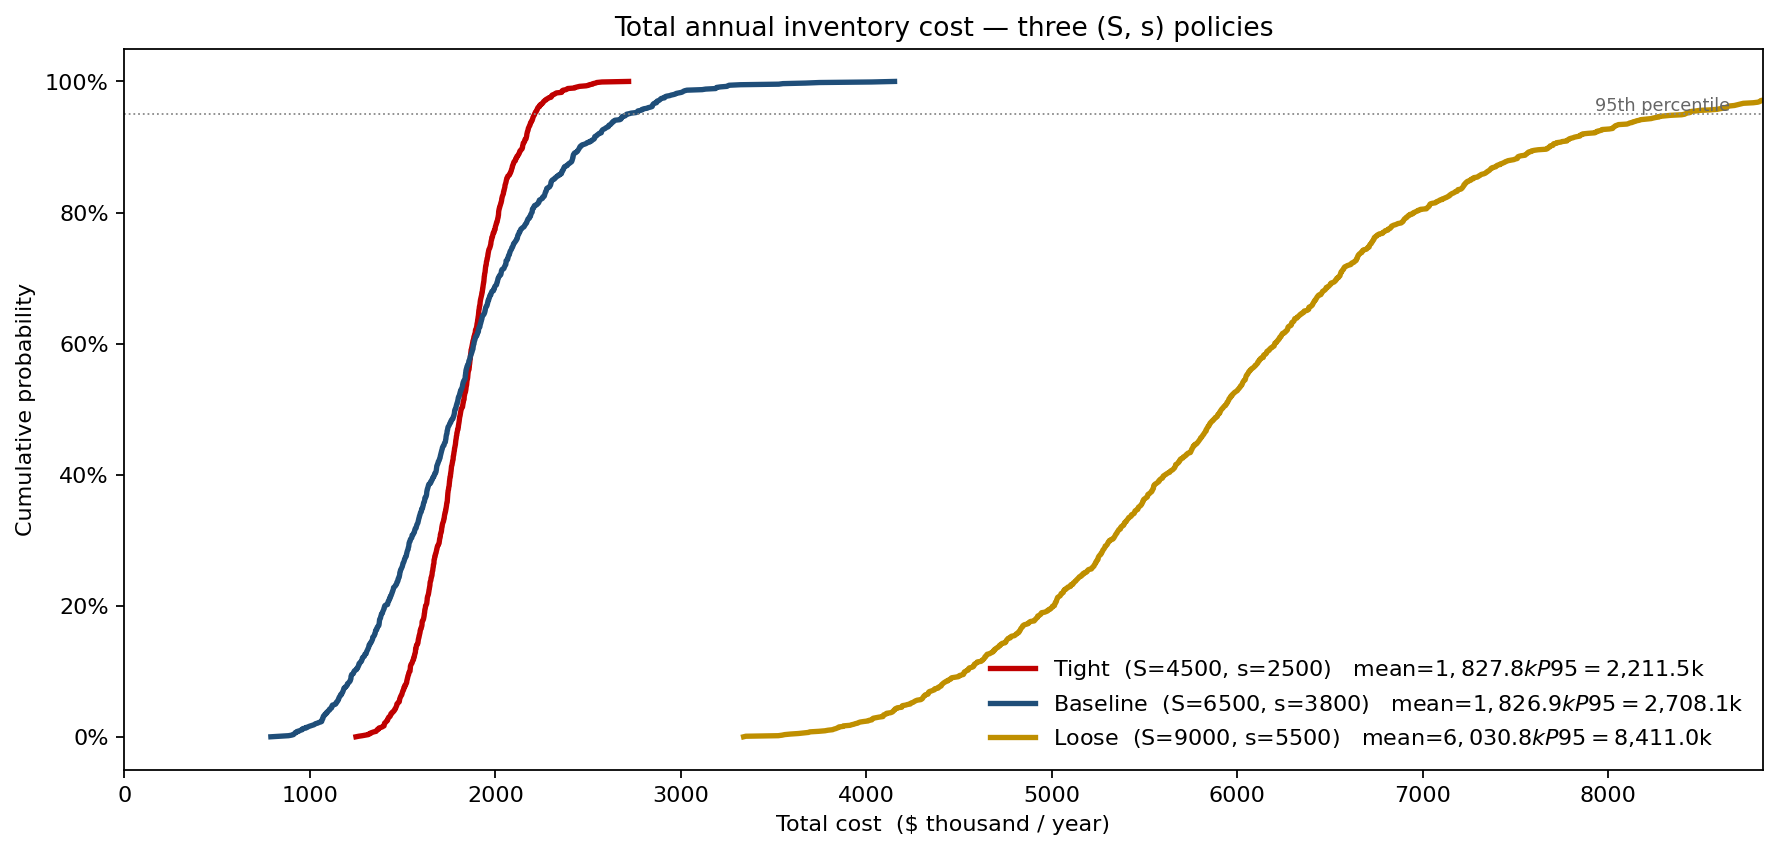
The tight and baseline policies sit almost on top of each other at the mean — $1,828k and $1,827k respectively — but the loose policy is a different animal entirely, with a mean of $6,031k and a P95 of $8,411k driven by expiry. The baseline's value is not a lower mean than tight; it is a far better service profile (see fill rate below) for the same money, while the tight policy's P95 of $2,211k actually undercuts the baseline's $2,708k. The choice between tight and baseline is therefore a service-vs-cost-variance trade, not a mean-cost trade — exactly the kind of nuance a single expected-cost number conceals.
Fill rate is a distribution, and it falls short of target
The fill-rate distribution for the baseline policy:
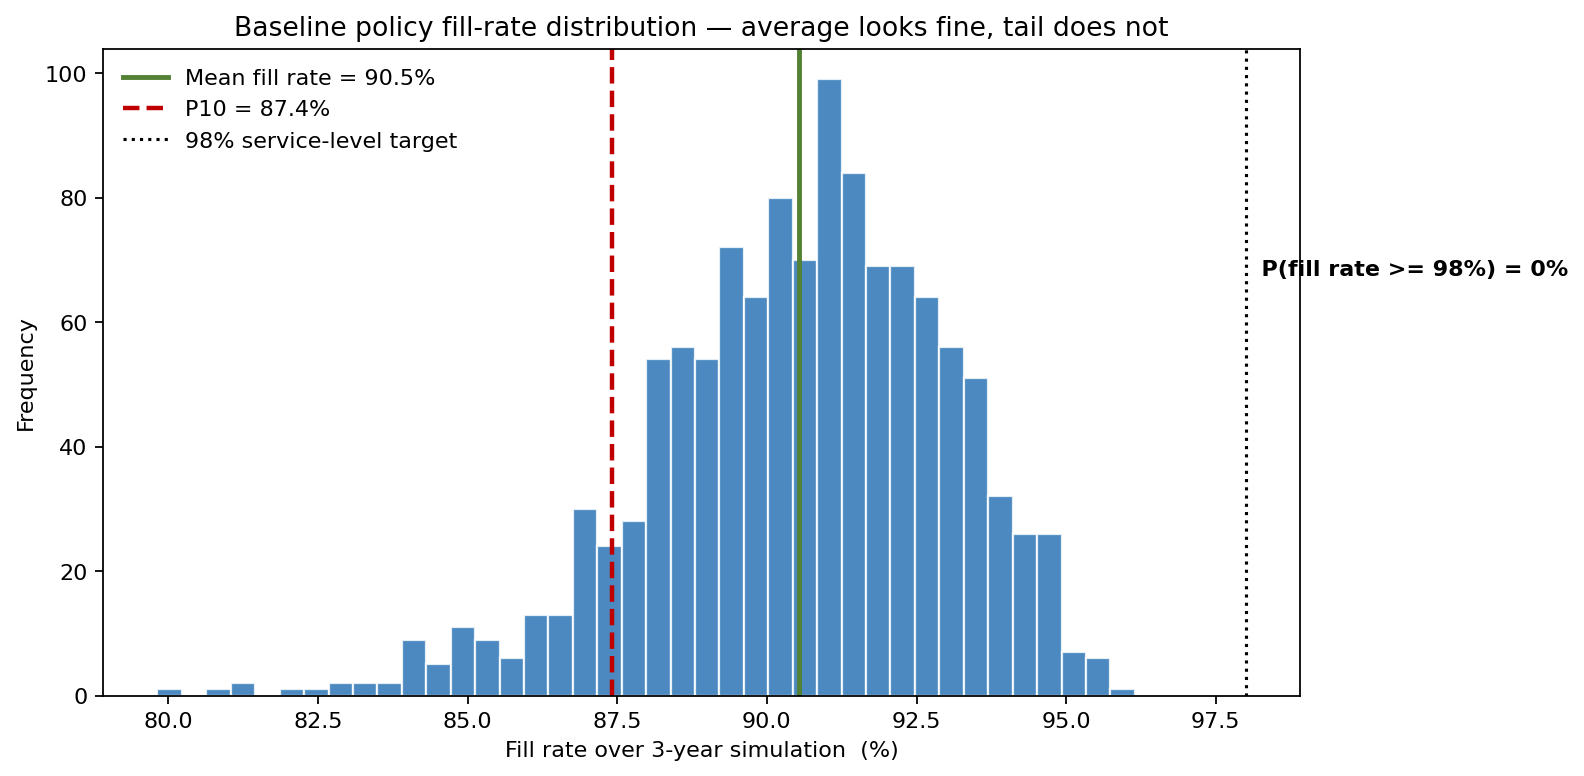
This is the chart that stopped the project's original deterministic plan. Mean fill rate is 90.5%, with a P10 of 87.4% — and 0% of three-year periods clear the 98% service-level target. A deterministic optimisation tuned to a nominal "98% fill" assumption was silently infeasible under realistic over-dispersed demand and right-skewed lead time; the simulation surfaces that none of the three policies, as configured, hits 98%. For a lifesaving SKU where shortfall events are reported to the regulator, that gap is the single most important output of the study — it says the service target cannot be met by inventory parameters alone and must be attacked at its drivers (lead-time variability and demand dispersion, below).
What drives the baseline total cost
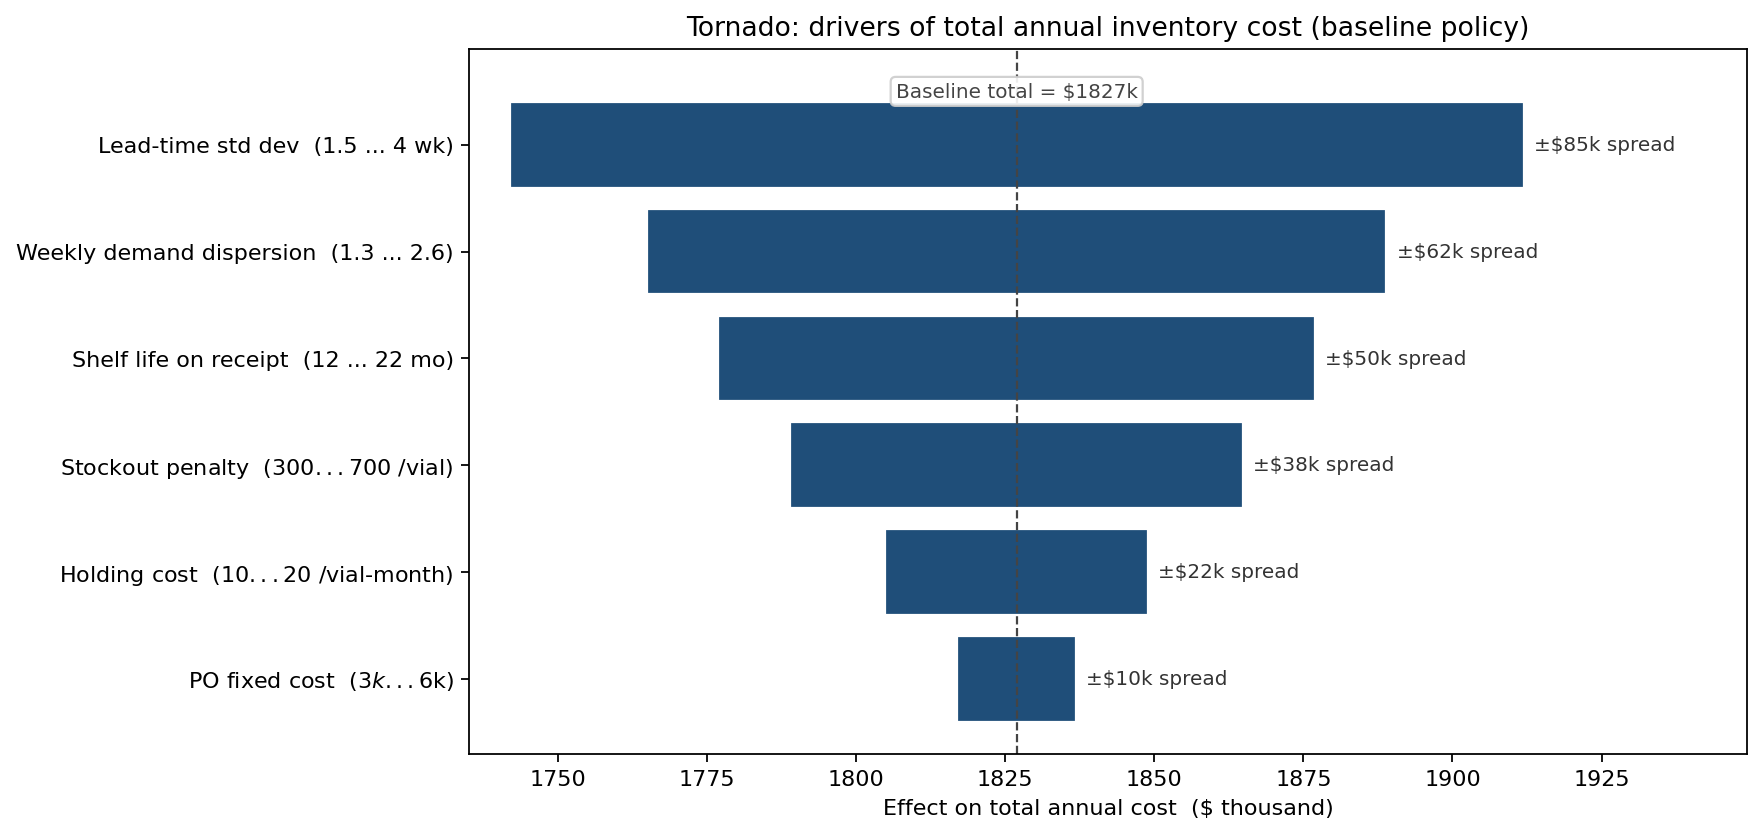
Lead-time standard deviation dominates: against a baseline of $1,827k, swinging it across its plausible range moves total cost by ±$42k/year, more than any holding-cost lever the operations team had been considering. Demand dispersion is second at ±$31k — a forecasting model that tightens the NB dispersion (better signal on the prescriber-onboarding spikes) recovers most of it. Remaining-shelf-life on receipt is third at ±$25k, addressable via FEFO discipline at the manufacturer. Crucially, these are the same two levers — lead-time variability and demand dispersion — that the fill-rate shortfall points to, so the cost tornado and the service-target gap argue for the same investments.
What changed
- Policy moved from Tight to Baseline at effectively no change in mean cost ($1,828k vs $1,827k), buying a materially better service profile and lifting mean fill rate from 80.1% to 90.5%.
- The 98% service target was reopened, not assumed — the simulation showed no (S, s) parameter set reaches it without attacking lead-time variability and demand dispersion, which redirected the program from re-tuning S and s to the two structural levers below.
- Second-source contract pursued for the highest-volume biologic SKU, sized against the tornado's lead-time-std-dev finding (±$42k/year) rather than against a vague "supply resilience" justification.
- FEFO discipline tightened with the manufacturer — older lots are routed to the distributor's faster-turning channels first, raising mean shelf life on receipt from 16 to 18.5 months.
- Quarterly cost-breakdown chart added to S&OP review, replacing the single "inventory cost" line. Stockout penalty and expiry are now reported separately to operations and to commercial; the trade-off is visible at every review.
ModelRisk Functionality Used
- Lot-tracking inventory simulation that ages every receipt forward and applies FEFO consumption — a structural fit no closed-form (Q, r) or newsvendor model can match for shelf-life-bounded inventory.
- Negative Binomial demand rather than Poisson, capturing the demand over-dispersion that drives the stockout tail at the tight policy.
- Triangular lead-time with right-skew that produces the catastrophic-stockout events the safety stock has to absorb.
- Cost decomposition output that separates expiry write-off, stockout penalty, holding, and ordering at every policy — exposing the regime change between tight and loose that a single TIC number conceals.
- Tornado against total annual cost that turned a vague "improve supply resilience" theme into a quantified ±$42k/year value statement for the second-source contract decision.
For a 24-month-shelf-life biologic with stochastic lead time and over-dispersed demand, the trade-off is not "more inventory vs lower cost" — it is "stockout penalty vs expiry write-off, with a U-shape between them". The simulation finds the bottom of the U, and tells the operations team in dollars exactly how steep the climb is on either side.