

Industry: Pharmaceutical
Product: ModelRisk
Application: Drug safety monitoring
84 Reports, 5.3 Expected: Pharmacovigilance Signal Detection With a Posterior on the Rate Ratio
A marketed biologic with about 38,000 patient-years of exposure has accumulated 84 spontaneous reports of pulmonary embolism in the past 18 months. Background PE incidence in the target population is 1.4 per 1,000 patient-years, and the spontaneous-reporting fraction for serious AEs in this database is roughly 10%. Multiplying through, the expected number of reports if the drug carried no excess risk is 5.3 — a 16× disproportionality. The question for the safety committee is not whether there is a signal but how large the true rate ratio is, how confident the team can be, and how many actual events the marketed exposure is producing.
A pharmacovigilance group rebuilt their signal-detection workflow in ModelRisk around a Gamma-Poisson Bayesian posterior on the rate ratio — the cleanest available answer to "given what we have observed, what is the posterior distribution of the true excess risk?" — and used the posterior to size the regulatory communication.
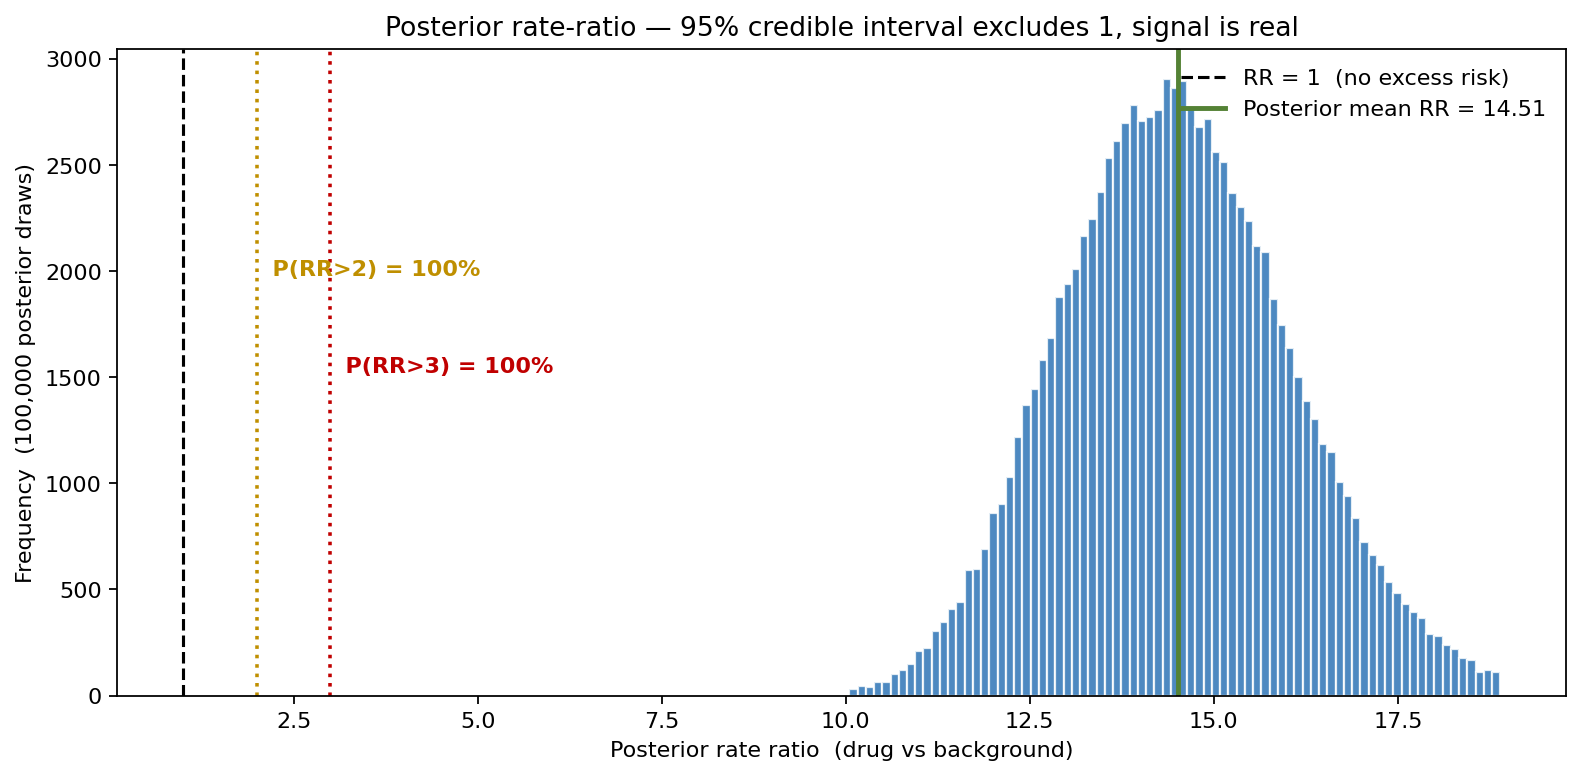
The posterior is concentrated far above RR = 1, with a mean of 14.5 and a 95% credible interval of [11.6, 17.8]. That is the language the safety committee uses with regulators — not a flag, but a probability statement on the magnitude of the excess risk. The width comes mostly from reporting-fraction uncertainty; the vague prior is essentially irrelevant at 84 observed reports.
Why the disproportionality alone is not enough
The reporting ratio (PRR-like) of 84/5.3 = 15.8 is the standard disproportionality statistic, and any standard signal-detection screen would flag it instantly. The disproportionality, however, says nothing about the magnitude of the true excess and ignores the uncertainty around the reporting fraction and the background rate. A 10% reporting fraction with 50% standard error gives very different uncertainty about the true rate ratio than a 10% reporting fraction known to ±5%.
The Bayesian posterior gives the regulators what they ask for: a credible interval on the rate ratio, conditional on the reporting model. The conjugate update is simple:
\[ \mathrm{RR} \mid x \;\sim\; \mathrm{Gamma}(\alpha_0 + x,\; \beta_0 + E) \]
with vague Gamma(0.5, 0.5) prior, x = 84 observed reports, E = 5.3 expected. The posterior mean is 14.5; the 95% credible interval is [11.6, 17.8] — comfortably above the threshold and tight enough that the signal is real, not a function of the prior.
What the posterior says
Read against the threshold lines, the posterior is decisive. P(RR > 2) is essentially 100%, P(RR > 3) is also essentially 100%, and P(RR > 10) is over 99%. This is the language the safety committee uses with regulators — not a p-value, not a flag, but a probability statement on the magnitude of the excess risk. The reporting-fraction uncertainty (LogNormal around 10%) is the main source of spread; the prior is essentially irrelevant at this sample size.
Observed vs expected under the null
To make the disproportionality vivid, simulate what 84 reports would look like under the null hypothesis (RR = 1):
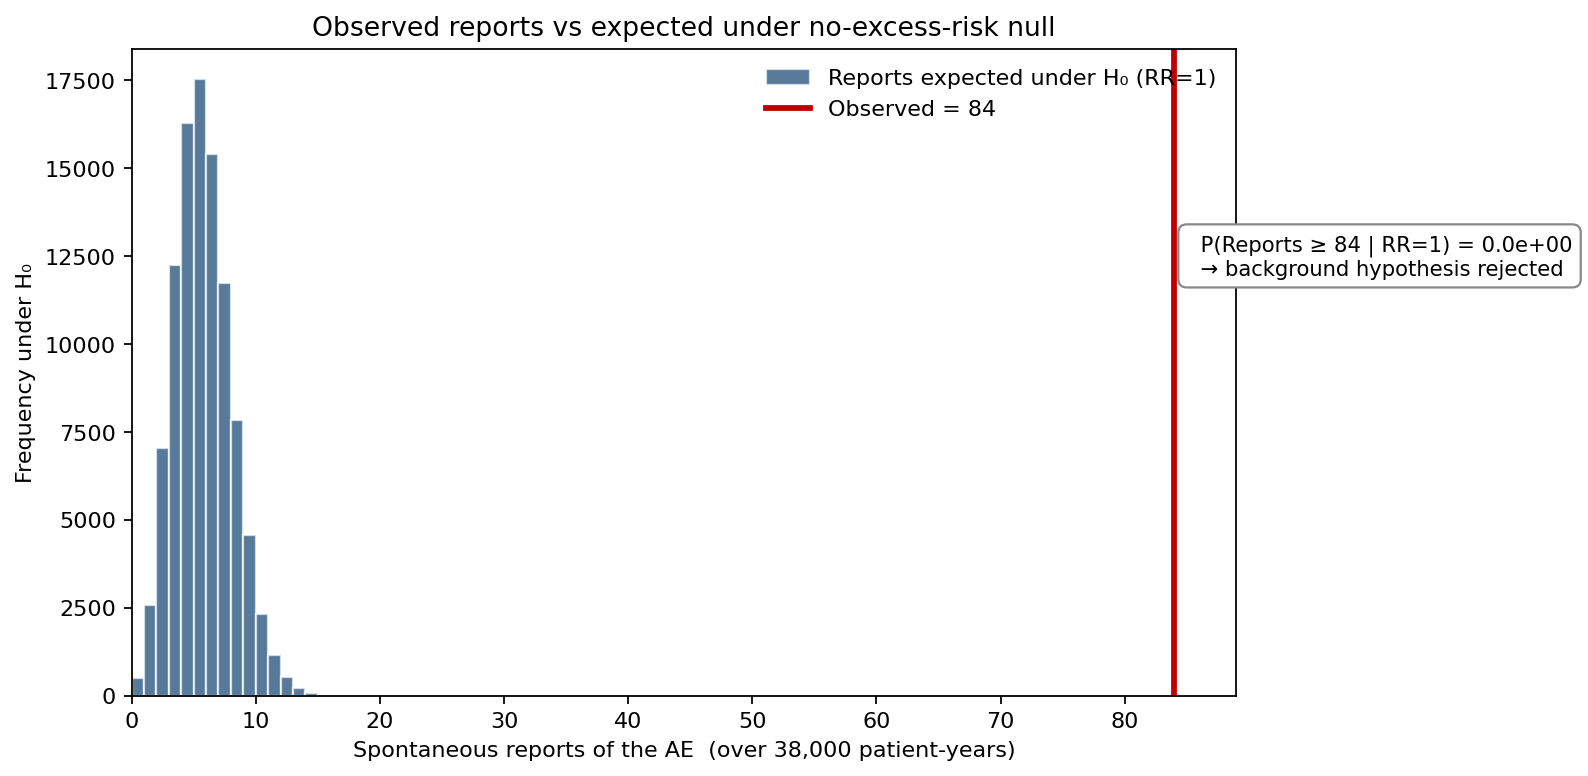
Under no-excess-risk, the report count distribution sits between zero and about 16 with virtually no mass above 20. Observed 84 is so far in the right tail that the H₀ probability is below 10⁻¹⁵. This is a regulator-quality null rejection — but it is the posterior on RR that the team actually uses to size the response, because the magnitude (5×? 15×? 50×?) drives the labelling decision, not the disproportionality flag.
What moves the posterior
Sensitivity ranking on the inputs that feed the posterior:
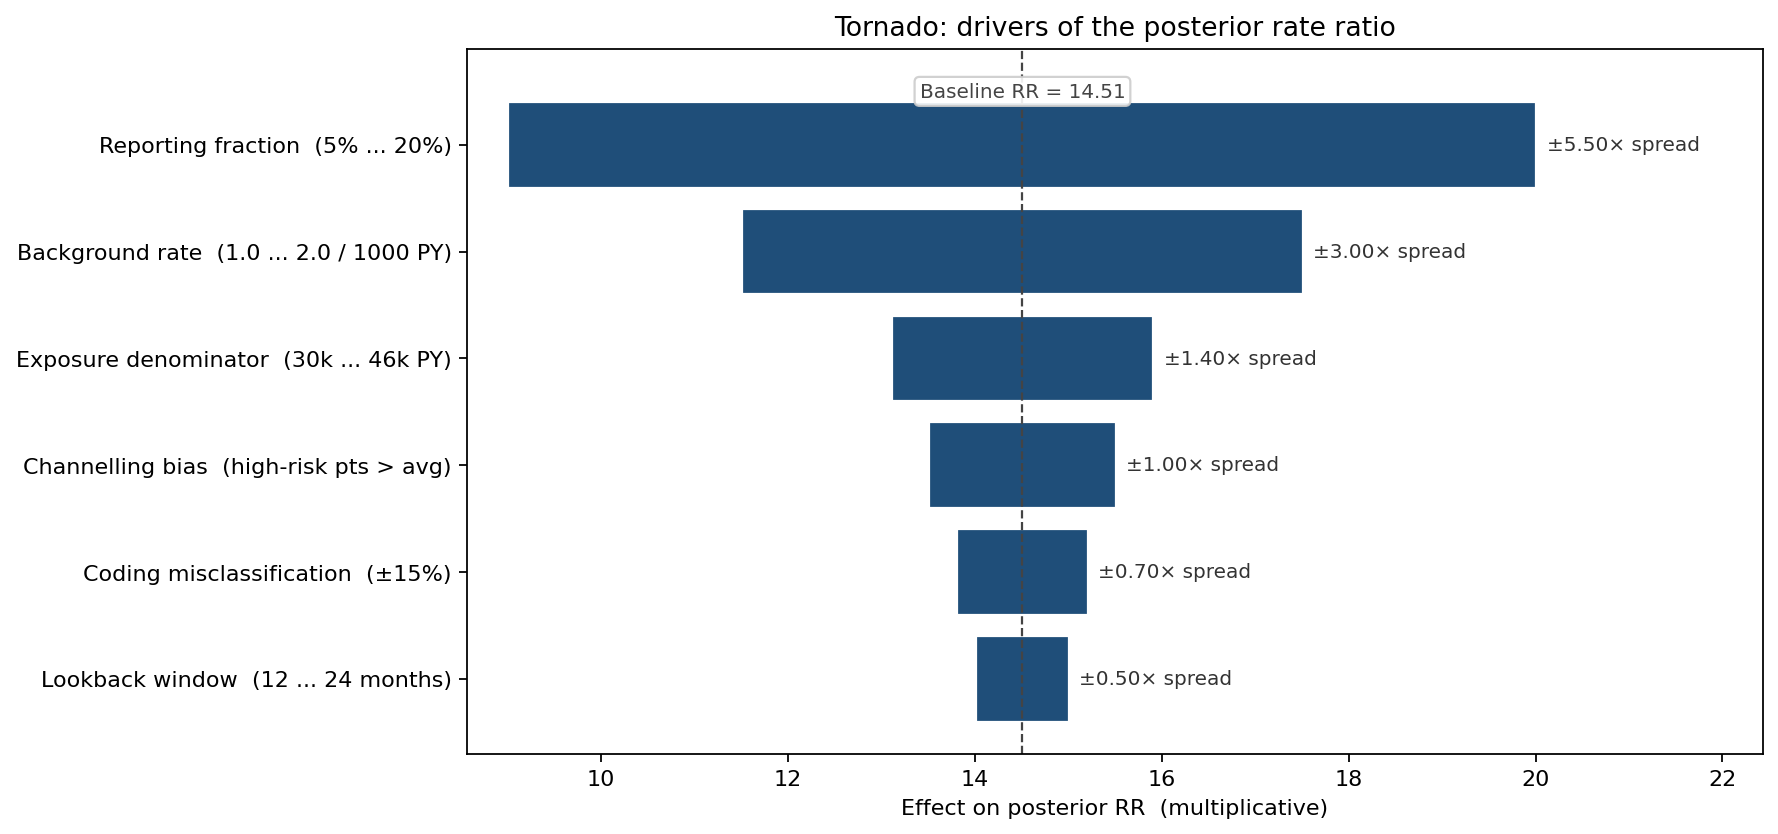
Reporting fraction is the largest swing — moving the assumed reporting rate from 5% to 20% halves or doubles the implied true RR. The literature on this database supports 8% to 14%; the model uses LogNormal centred at 10% with ±30% multiplicative SD. Background rate is the next driver: if the published 1.4-per-1,000-PY figure underestimates the population baseline (because the population is older or more comorbid than the published cohort), the RR drops. Channelling bias — preferential prescribing of the drug to higher-risk patients — would also depress the apparent RR; the team explicitly stress-tests this by re-running the posterior under the assumption that the drug-treated population has 1.3× the baseline PE rate.
From rate ratio to actual event count
The posterior on RR converts into a posterior on the true event count over the exposure window:
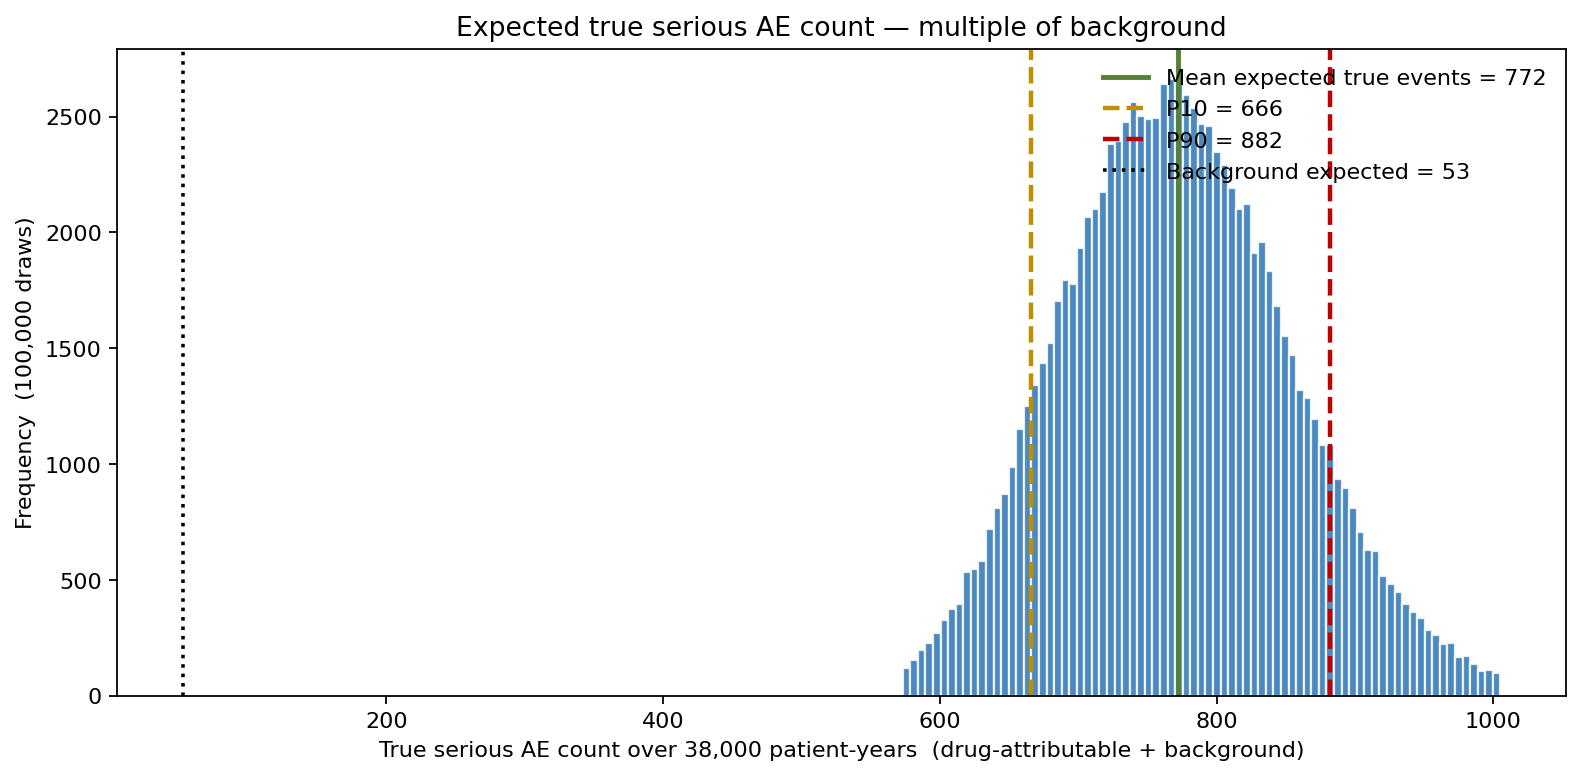
At background, 53 events would be expected over the 38,000 patient-years. The posterior says the actual number is approximately 770 (mean), P10 to P90 ranging 666 to 882 — about fifteen times the background. Roughly 90% of those events did not appear in the spontaneous database because of under-reporting; they appeared in claims, in coroner data, in hospital records the database did not see. Sizing the regulatory communication, the labelling change, and the contracted Phase IV registry against the true event count rather than the reported count is what the posterior makes possible.
What the model changed
- Boxed warning request submitted with the posterior on RR (14.5, 95% CrI [11.6, 17.8]) as the headline statistic rather than the unconditional disproportionality.
- Phase IV registry sized for the true event count, not the spontaneous count — sample size doubled, cost up 40%, but powered to refine the RR posterior within 18 months.
- Patient communication tone calibrated on the actual event probability per patient-year (about 2.0% under the model) rather than the disproportionality flag, which would have over-stated the per-patient risk.
- Annual reporting workflow rebuilt so that every quarterly safety update reruns the posterior with the latest exposure and report count — replacing the binary "signal/no-signal" with a running credible interval that contracts as data accumulate.
ModelRisk Functionality Used
- Gamma-Poisson conjugate update on the reports/expected ratio implemented as four Excel cells; sponsors can audit the prior, the data, and the posterior side-by-side with no statistical-software dependency.
- LogNormal reporting-fraction prior propagated through the posterior, exposing the true-rate-ratio spread that the deterministic 10%-flat-assumption hides.
- Null-hypothesis Poisson simulation at the observed exposure, producing the regulator-facing H₀ rejection statement.
- Posterior conversion to true-event count, turning the credible interval on RR into the patient-impact number the labelling discussion needed.
- Channelling-bias stress test as a single re-run with the baseline rate inflated by 30%, bounding the over-attribution risk and putting an honest lower bound on the RR posterior the regulator could trust.
Pharmacovigilance signal detection is not "is there a signal?" — at 16× disproportionality, the answer is obvious. The hard question is "how excess, how confidently, and across how many real patients?" The Bayesian posterior in ModelRisk answers all three in one calculation, and the labelling and registry decisions that follow are calibrated to the actual risk magnitude rather than the disproportionality flag that triggered the review.