

Industry: Pharmaceutical
Product: ModelRisk
Application: Drug development and testing
Why P_I × P_II × P_III Is the Wrong Formula: rNPV with Phase-Correlated Success
Industry benchmarks put Phase I probability of success at 60%, Phase II at 30%, Phase III at 60%, and NDA approval at 85%. Multiply those four numbers and you get 9.2% — almost exactly the well-known "one in ten compounds from Phase I to launch". The arithmetic is right; the assumption underneath it is wrong. Phase outcomes are not independent. A strong Phase II readout — clean safety, large effect size, dose-response coherent with the mechanism — is the best single predictor of Phase III success. Treating the four phases as independent Bernoulli trials systematically underestimates the conditional approval probability of assets that have cleared Phase II.
A pipeline-stage biotech reframed its R&D economics in ModelRisk around a hierarchical Bayesian model where each candidate has a latent "quality" parameter that drives all four phase outcomes. The result was a portfolio prioritisation that differed materially from the independent-probability calculation that had previously driven capital allocation. The clearest way to see what the independence assumption costs is to compare the conditional probability of approval phase by phase under both models:
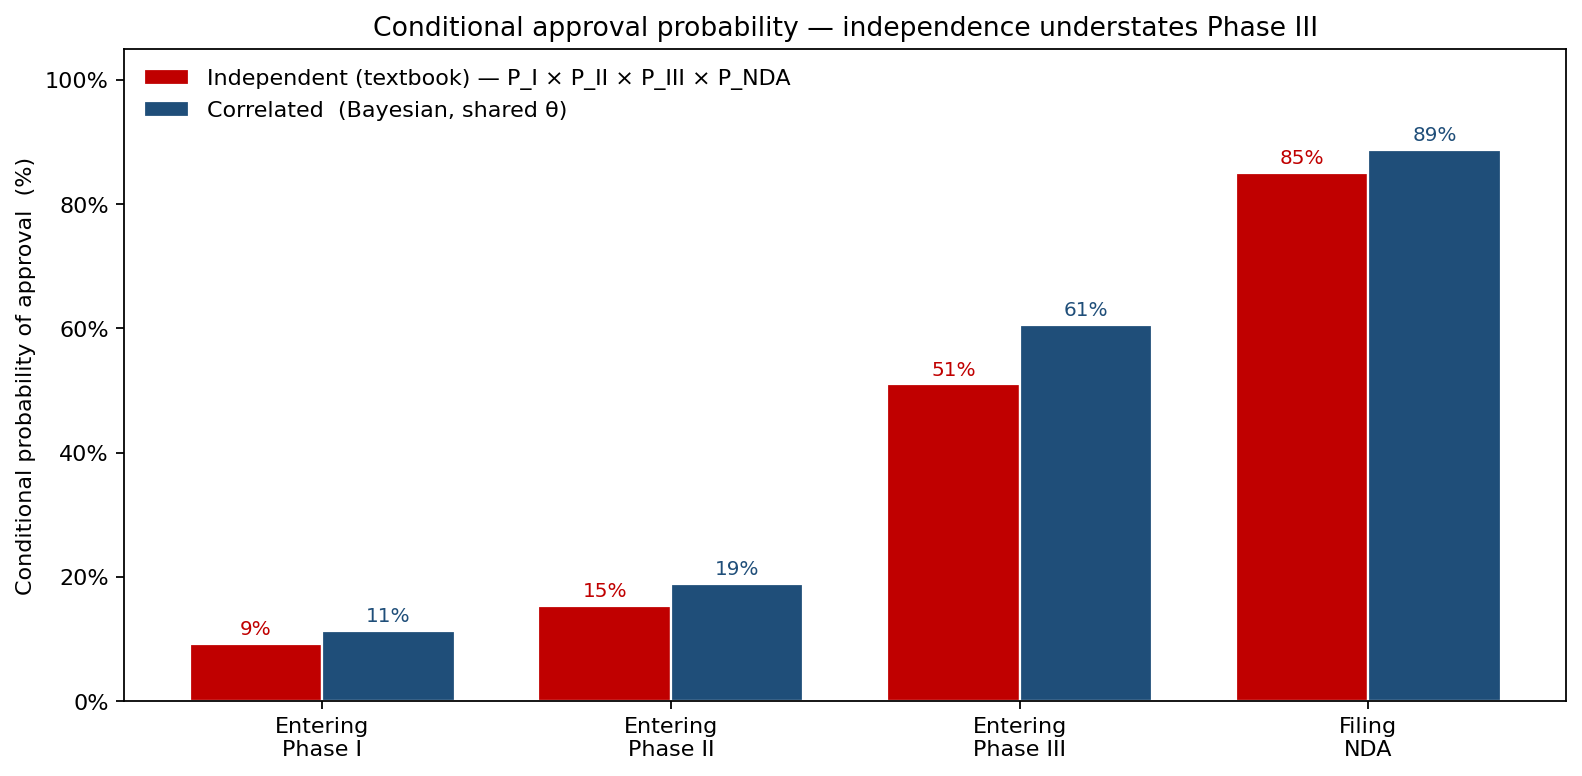
For an asset already standing at the Phase III gate, the textbook product gives 51% while the correlated model gives 61% — a ten-point gap that comes entirely from the two phases of positive evidence the asset has already revealed about its quality. That gap is what the rest of this analysis turns on.
A latent-quality model with shared θ
Each candidate gets an asset-quality draw \( \theta \sim \mathrm{Beta}(2,5) \) — mean 0.286, capturing the empirical distribution of "true" approval likelihood across the industry pipeline. Per-phase probability of success is then:
\[ \mathrm{PoS}_\text{phase} \;=\; \mathrm{base}_\text{phase} \;+\; \alpha_\text{phase}\,(\theta - \overline{\theta}) \]
with base PoS of (60%, 30%, 60%, 85%) across Phase I, II, III, NDA. The α weights (0.40, 0.85, 0.95, 0.30) load Phase II and III heavily on θ — those are the phases where asset quality dominates execution noise. The construction sits close to the textbook ~9% marginal industry success rate — the correlated model puts the unconditional approval probability at 11% (a useful sanity check) — while producing correlated phase outcomes consistent with what real readouts look like.
A copula on phase outcomes would be the alternative; the shared-latent approach is easier to elicit prior beliefs for and easier for clinical reviewers to audit because the parameter θ has an intuitive meaning.
The correlation effect, sized
What does ignoring correlation actually cost? The conditional probability of approval given the asset has cleared each prior phase tells the story. For an asset entering Phase III, the textbook independent calculation gives P(approval) = 0.60 × 0.85 = 51%. The correlated model gives 61% — ten percentage points higher, because the asset has now revealed two phases of positive evidence about θ. The gap widens with each phase cleared: at the Phase II gate the conditional approval probability moves from 15% to 19%, and at the Phase III gate from 51% to 61%, as accumulating evidence sharpens the posterior on asset quality.
This matters for go/no-go decisions at Phase II readout, where a ten-point swing in conditional P(approval) can flip a borderline asset from "kill" to "advance".
rNPV is bimodal — averaging hides the structure
With Phase III cost ~$410M, Phase I+II at ~$225M, and 10% discount rate, the rNPV calculation for a single oncology candidate looks like this:
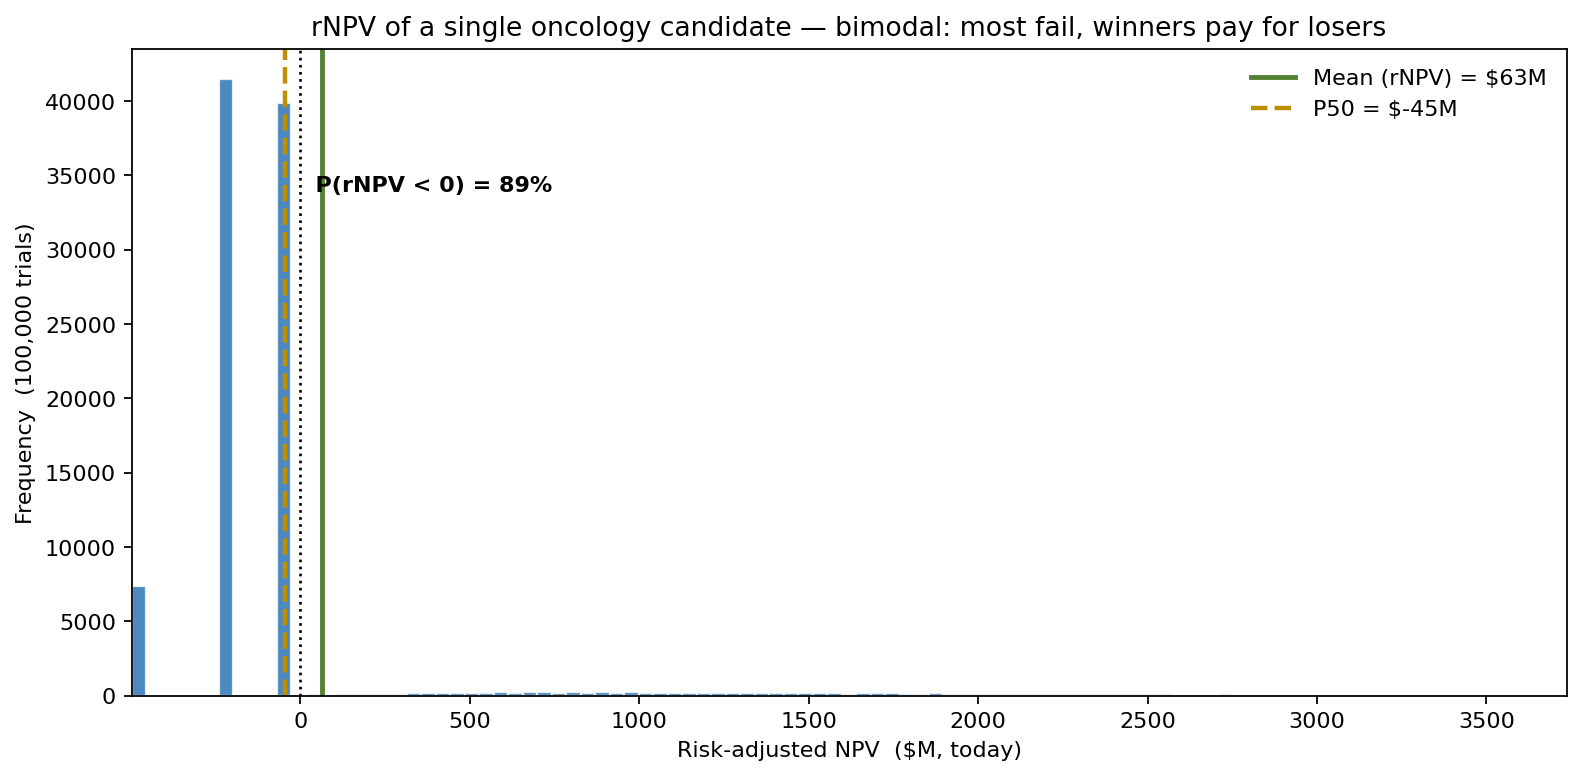
The mean rNPV is positive at about $63M, but roughly 89% of trajectories end with a negative NPV (the median rNPV is −$45M), balanced by the ~11% mass at large positive values where the asset reaches launch and peak sales materialise. The point-estimate rNPV is a number no individual trial ever lands on — it is the expected value of a strongly bimodal distribution carried entirely by its right tail, and the company that survives is the one with enough shots-on-goal to realise the mean.
What moves the rNPV
Sensitivity ranking shows where the optionality lives:
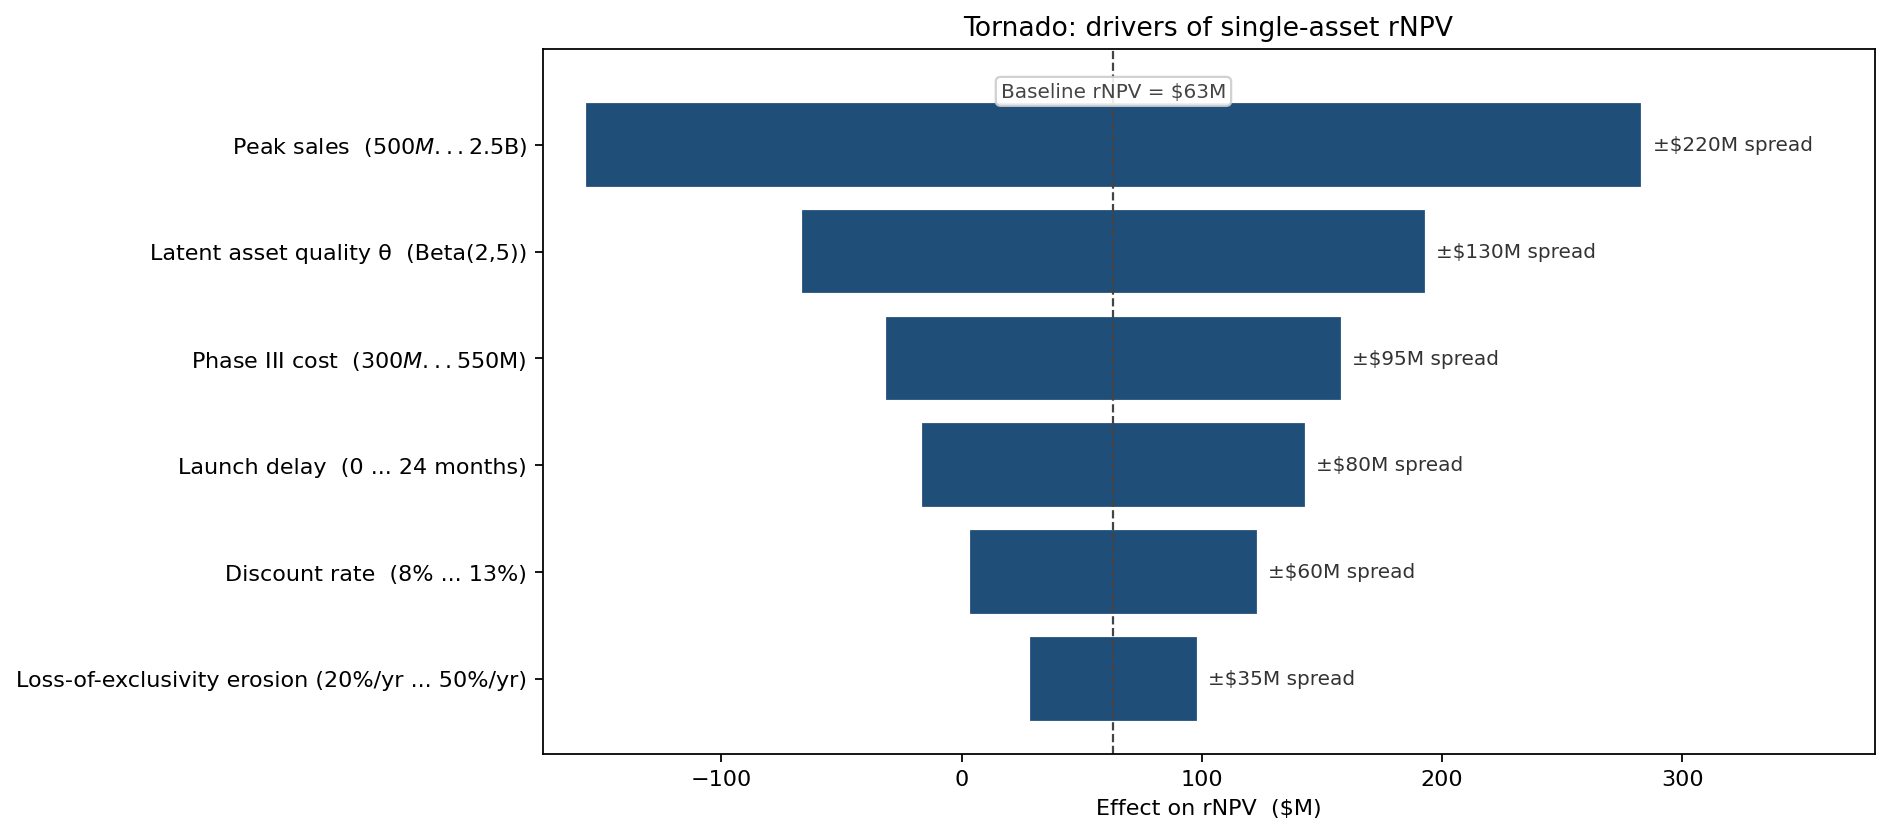
Peak-sales uncertainty dwarfs all others — a wide LogNormal on peak sales (range $500M to $2.5B) drives more than $200M of rNPV spread. Latent asset quality θ is second; Phase III cost is third. The implication: investment in commercial-forecasting precision and in better asset-quality screening at the Phase I gate are more valuable than further trimming Phase III spend — which, at $410M, is already the single largest cost line, over 60% of the program's gross outlay.
Portfolio prioritisation — six candidates ranked
Aggregating to portfolio level, the same engine ranks the six pipeline candidates:
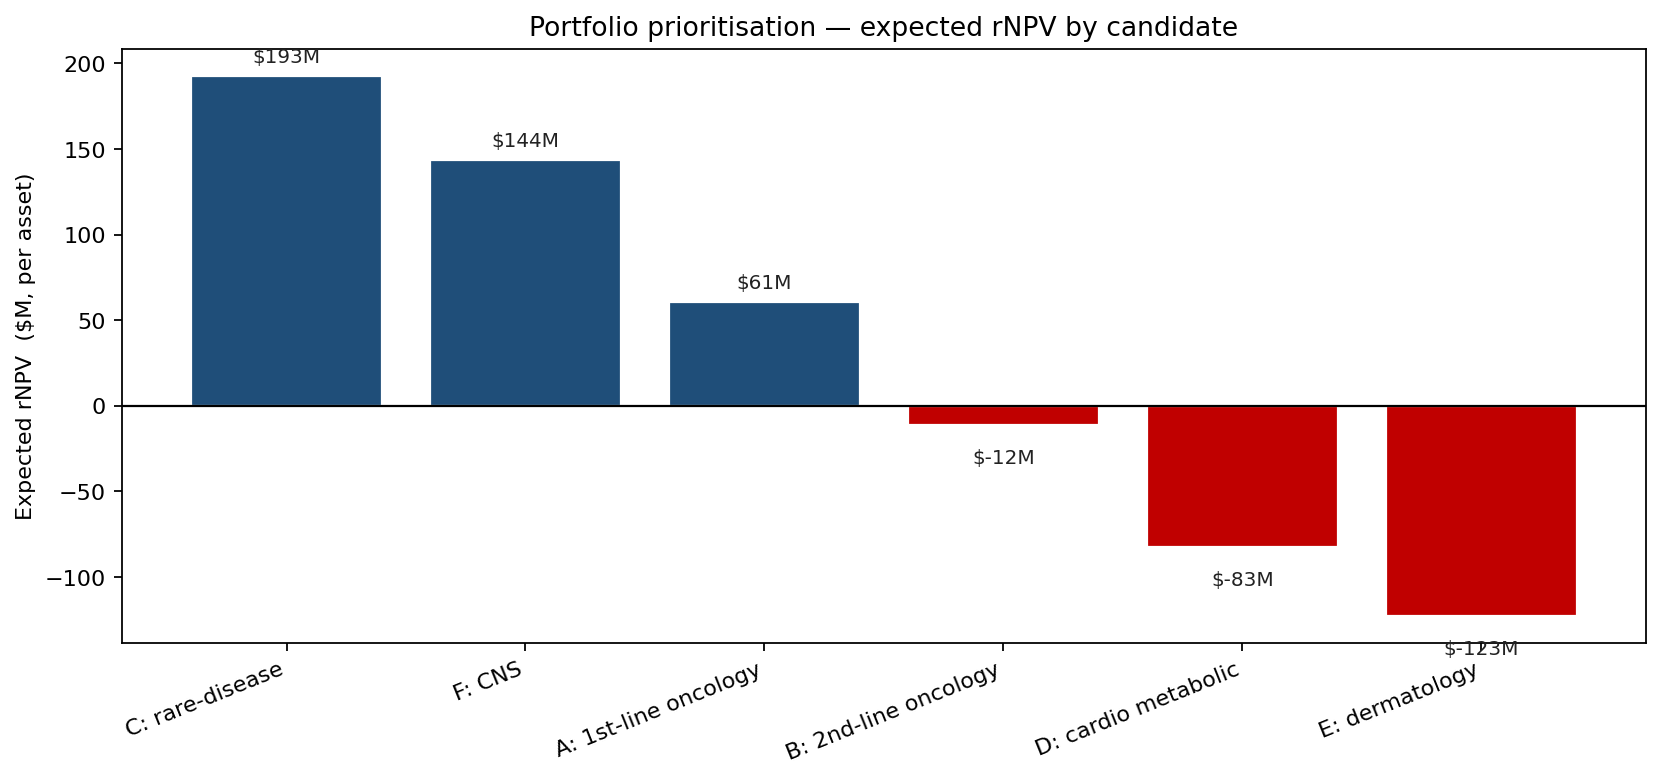
Candidate C (rare disease) ranks first not because its PoS is highest but because high peak-sales potential combined with a focused indication generates strong rNPV even at modest probabilities. Candidate E (dermatology) shows up red — its peak-sales draw is too small to overcome the cost base, even at favourable θ. The picture under independent-phase scoring had ranked these differently because it under-credited the Phase II readouts of the strongest candidates.
What changed
- Phase II readout decision rule rebuilt on conditional rNPV under the correlated model — three borderline assets were advanced rather than killed once the corrected conditional P(approval) was applied.
- Two assets reprioritised in the development plan, with Candidate C moving to fast-track resourcing.
- Investment in peak-sales forecasting expanded based on the tornado finding — a deeper market-research budget on the leading two candidates ranked above an equivalent spend on Phase III cost compression.
- Phase-correlation framework adopted as standard for all subsequent R&D rNPV reviews, replacing the independent-phase calculation in the investment template.
ModelRisk Functionality Used
- Hierarchical Bayesian construction with a Beta-distributed latent asset quality θ driving correlated phase PoS — the entire chain audited inside Excel, with the prior on θ openly editable at review.
- Conditional-probability scoring at each phase gate, producing the corrected go/no-go rules at Phase II readout that changed three resourcing decisions.
- Per-asset rNPV with explicit bimodal output — the simulation shows the failure tail and the launch tail separately, ending the recurring confusion between mean rNPV and most-likely outcome.
- Portfolio aggregation across six candidates with asset-specific peak-sales priors and quality θ priors, allowing the investment committee to read both per-asset and portfolio-level distributions.
- Tornado decomposition that put commercial-forecasting precision ahead of Phase III cost compression in the next-marginal-dollar prioritisation list.
R&D economics that assume independent phase success understate Phase III conditional probability, mis-rank the portfolio, and kill assets at Phase II readout that the data actually supports. The correlated model is harder to elicit but easier to defend — and once it is in front of the investment committee, the conversation moves from "what is P_approval?" to "which assets are we actually selecting on, and is θ the right thing to be selecting on?"