

Industry: Pharmaceutical
Product: ModelRisk
Application: Demand forecasting
Year-2 Demand Is a 4× Range, Not a Number: Probabilistic Launch Forecasting
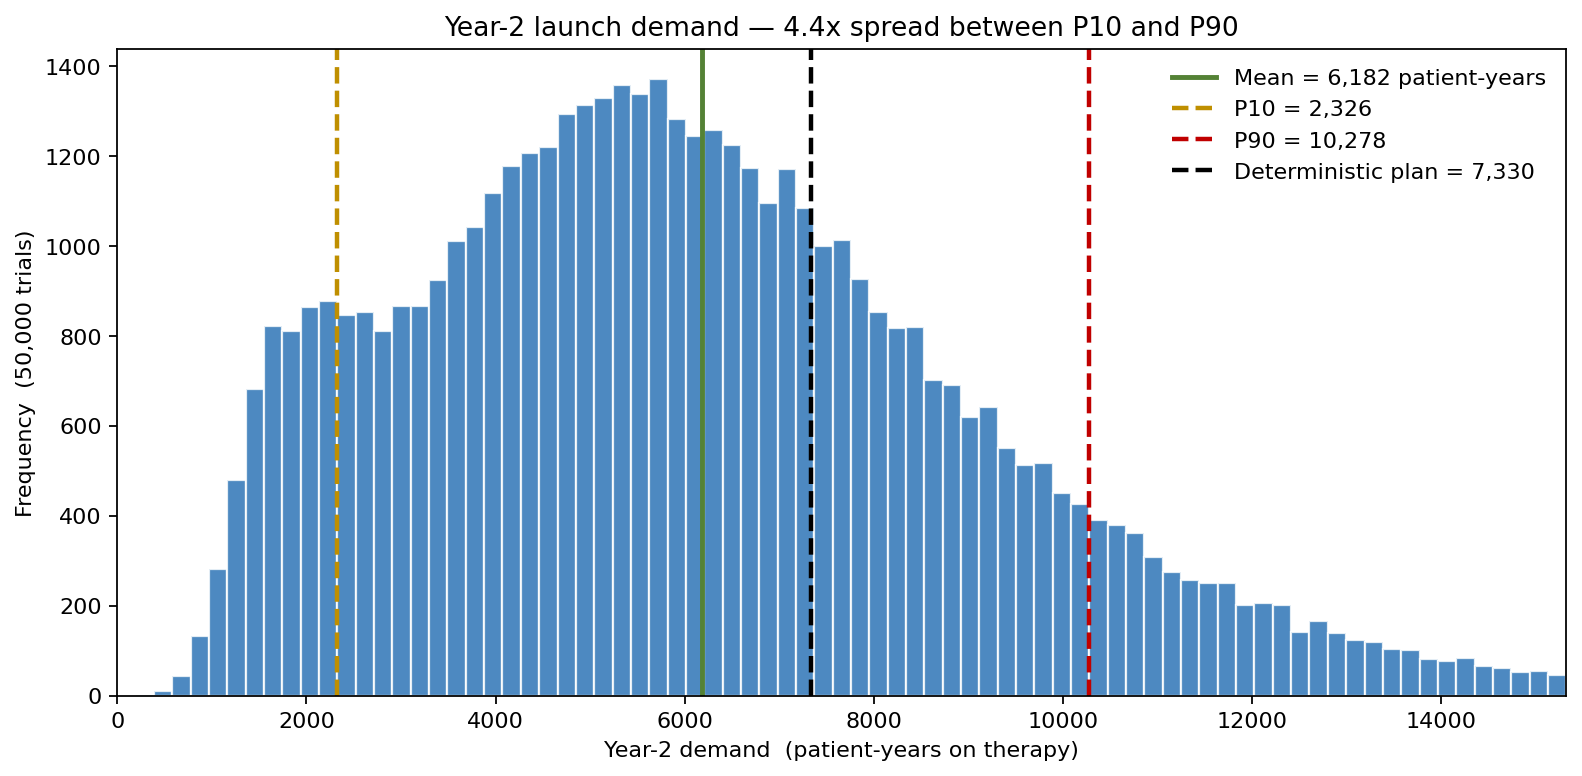
A new oral therapy's Year-2 launch forecast came in at 7,300 patient-years — the deterministic central plan that drove manufacturing, hiring, and inventory commitments. The simulation said the realistic range was 2,300 to 10,300 patient-years between P10 and P90, a 4.4× spread, with payer-coverage outcome and competitor entry month accounting for most of it. A factory build sized to the central plan is half-empty at P10 and overwhelmed at P90; neither costs nothing, and the cost asymmetries between the two are not the same.
A specialty pharma planning the U.S. launch of a chronic-disease oral built a probabilistic six-year demand model in ModelRisk to replace the deterministic central-case forecast that had driven prior launches. The eligible population was around 220,000 patients; the question was not the average outcome but the joint distribution over volume and pricing scenarios that S&OP, supply, and finance all had to plan against. Plotting the Year-2 outcome as a distribution rather than a point makes the gap immediate — the deterministic plan sits well to the right of the median, on the optimistic shoulder of a right-skewed curve.
Five uncertainties stacked
Pharmaceutical launch demand decomposes into a small set of drivers, each with its own distribution:
- Addressable population as Triangular(180,000; 220,000; 270,000) — the prevalence range from claims and registry data, with the upper bound reflecting under-diagnosis estimates.
- Bass diffusion with innovation rate p ~ LogNormal(median 0.015) and imitation rate q ~ LogNormal(median 0.42), parameterised from analogue launches in the same therapeutic class. The Bass form is preferred over linear ramp because physician adoption is in fact word-of-mouth driven.
- Payer coverage as a discrete scenario — 60% probability of Tier-2 unrestricted (full access), 25% Tier-3 with prior authorisation (70% access multiplier), 15% not covered (30% multiplier dominated by cash and PAP).
- Competitor entry month as Triangular(14, 22, 30) months from launch, which begins to erode share linearly to a 45% haircut over the subsequent 24 months.
- Adherence as Beta(8, 3) — mean ~73%, the published range for chronic oral therapies in the indication.
What the deterministic plan misses
The central-plan deterministic forecast set Year-2 patient-years at 7,300. The simulation showed how thin that estimate is: mean Year-2 demand is 6,200 patient-years (below the deterministic plan, not at it), and the P10 is 2,300 while the P90 is 10,300 — a 4.4× range. The distribution is right-skewed: the mass below the central plan is larger than the mass above, because the "not covered" payer scenario is genuinely catastrophic for volume even at modest probability. The deterministic 7,300 lands above the median — the single-point plan is quietly optimistic.
Six years out, the fan widens
Plotting the simulated demand fan year by year shows how the uncertainty compounds and where competitor entry bites:
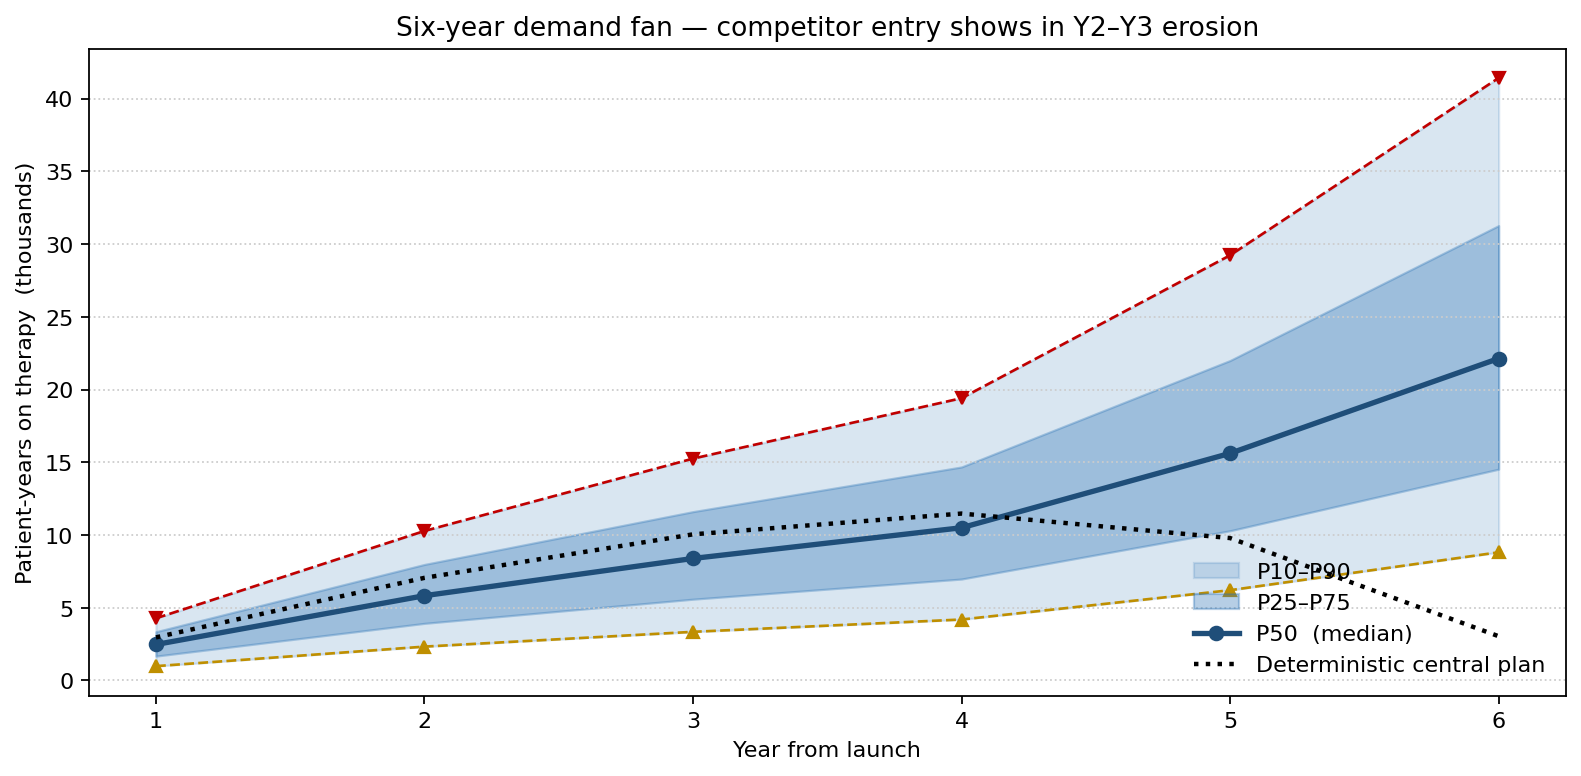
The P50 line rises through the six years to about 22,000 patient-years by Year 6; the P90 line keeps climbing to roughly 41,000 because the competitor-entry distribution has mass at 30 months, leaving some trajectories with three competitor-free years. The deterministic central plan, by contrast, peaks around Year 4 and then turns down as the assumed competitor erodes share — it gives finance one curve to defend but no language for the trade-off between Y2 capacity build and Y4 commitment.
What actually moves the number
Sensitivity ranking on Year-2 demand makes the priority order explicit:
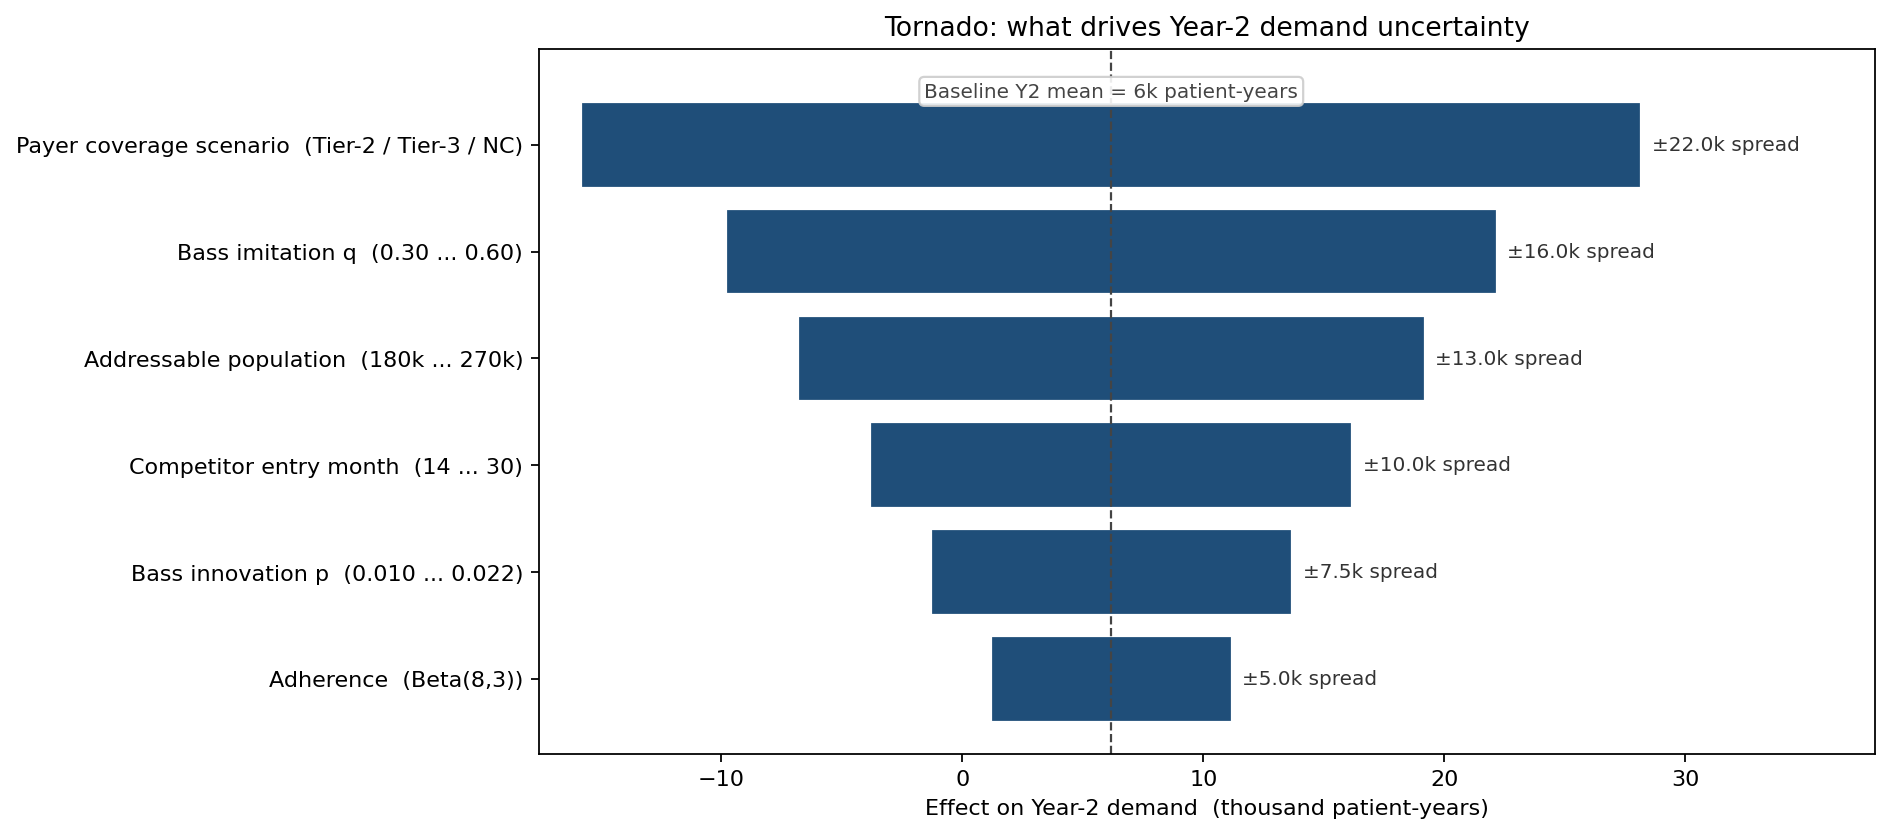
Payer coverage outcome dominates the spread — wider than the population uncertainty, wider than the Bass parameters, wider than competitor timing. The next-marginal-dollar question for the launch team is not "how do we model demand better" but "how much engagement-team effort moves the Tier-2 probability from 60% to 75%". The Bass imitation parameter q ranks second; investment in MSL coverage and KOL events feeds directly into that parameter.
Three coverage worlds, three demand worlds
Splitting Year-2 demand by the three payer-coverage scenarios shows the cliff:
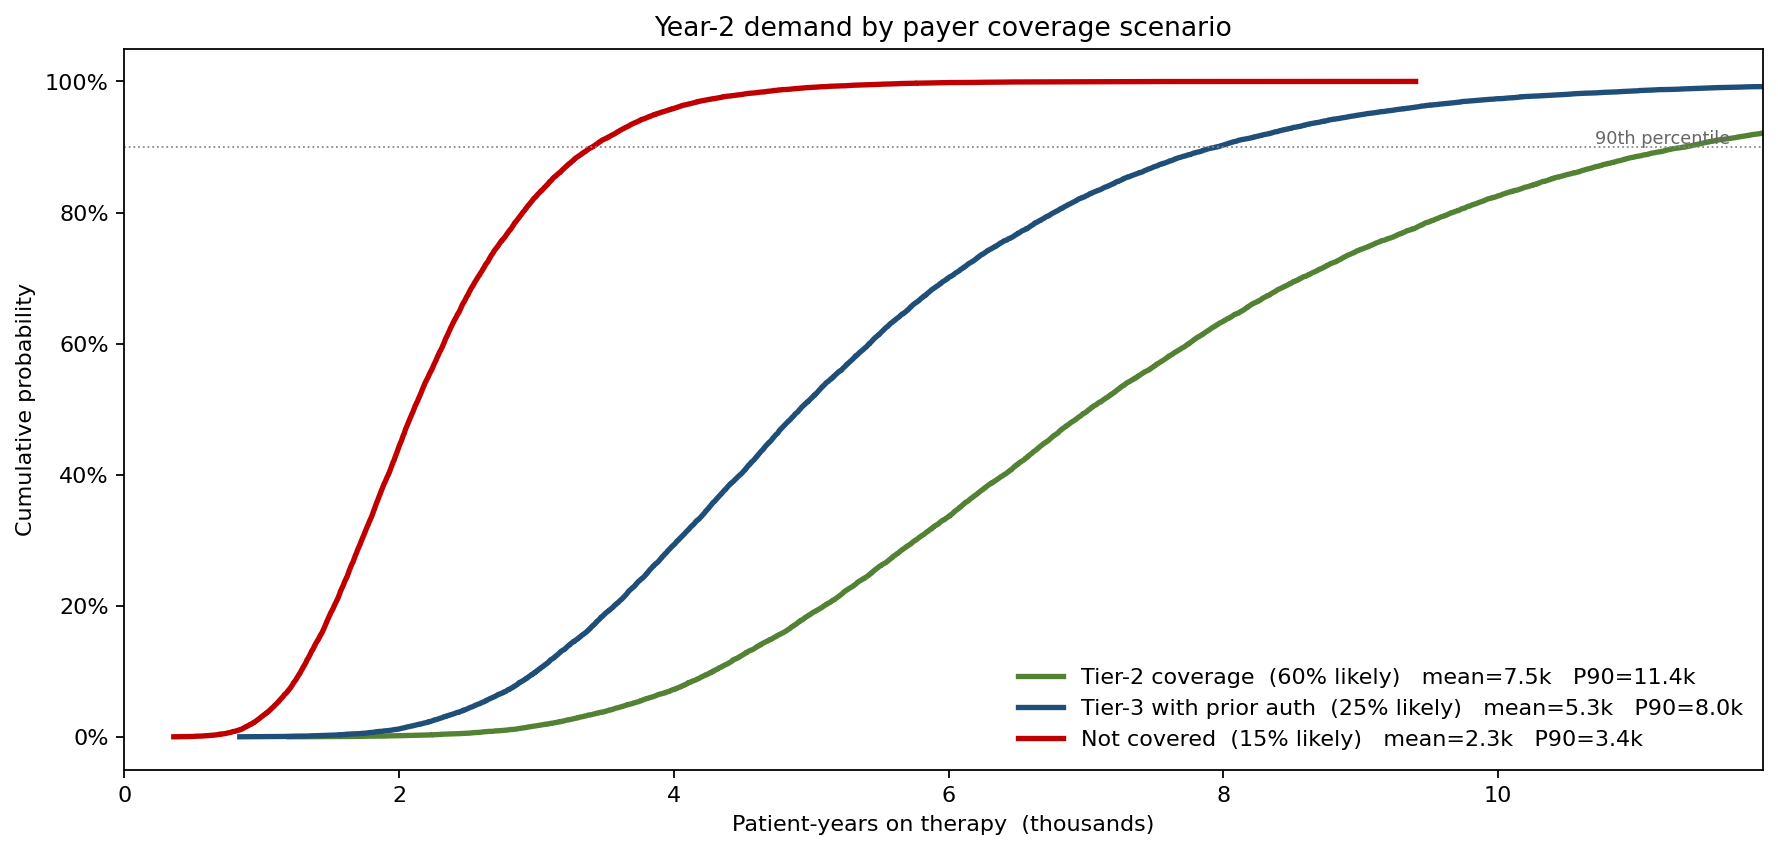
Tier-2 (P50 ~ 7,000 patient-years) and Not-Covered (P50 ~ 2,100) are different businesses, not different points on a curve. Production plans, sales hiring, and channel investment that average across all three scenarios will be wrong for any single realised world; the simulation's job is to make that visible to the S&OP committee rather than collapse it into an average.
What the model changed
- Capacity decision sized to P75, not mean. Manufacturing committed to roughly 8,000 patient-years of capacity for Year 2 (the P75) rather than the central-plan 7,300. The simulation showed marginal cost of unused capacity at P10 was lower than the stock-out cost at P90.
- Tier-2 acceleration plan funded. The model put a number on the Tier-2 probability lift required to justify three additional account-management hires; the marginal expected demand more than covered the cost.
- Competitor-entry monitoring instituted. Quarterly updates to the competitor-entry distribution flow into the model, repricing the demand fan against the latest pipeline intelligence.
- Inventory built for Tier-3 fail mode. With P(Tier-3 or worse) = 40%, the launch team built and pre-positioned smaller pack sizes appropriate to the slower ramp those scenarios imply.
ModelRisk Functionality Used
- Bass diffusion compiled inline in Excel with LogNormal p and q — no separate adoption-curve add-in needed, and the parameters are auditable by the commercial analytics team.
- Discrete payer-coverage scenario tree combined with continuous adherence and population draws inside a single simulation, generating the realised Year-2 distribution and the three-coverage scenario CDF in one run.
- Quarterly competitor-entry update workflow — analysts revise the Triangular(min, mode, max) on the entry month, and the model rebuilds the demand fan without any code changes.
- Tornado on Year-2 demand that ranked Tier-2 probability as the single largest swing — directly informing the account-management hiring decision.
- Percentile-fan output format that finance and operations could both work from: one chart, three different planning questions answered.
The right Year-2 demand number is not 7,300. It is a 4.4× range with a known left tail and a payer-driven shape — and the planning decisions that read that range honestly are different from the ones the central plan would have made.