

Industry: Pharmaceutical
Product: ModelRisk
Application: Clinical trial simulation
What "80% power" Actually Means: Simulating a Phase III Oncology Trial
A Phase III oncology trial that powers to 80% on the planning hazard ratio of 0.75 sounds safe — until you realise that the planning HR is itself a point estimate from a Phase II of 200 patients. Move the true HR by 0.05 in the wrong direction, slip enrollment by three months, lose patients to dropout, and the 80% on the protocol becomes 63% in the world. A $150M Phase III committed against a single textbook power calculation is committed against a number that does not exist.
A sponsor running a 550-patient progression-free-survival trial in a rare oncology indication rebuilt the protocol's operating-characteristics analysis in ModelRisk. The goal was not to argue with the regulator about the planning HR — it was to know, before the trial opened, the joint distribution of {power, duration, cost} under every plausible combination of enrollment, dropout, and effect-size uncertainty the team could defend. The first thing the simulation produced was the power curve the protocol's single number papers over: plot the probability of detecting an effect against the true hazard ratio, and the 80% target is revealed as one point on a steep slope, not a floor.
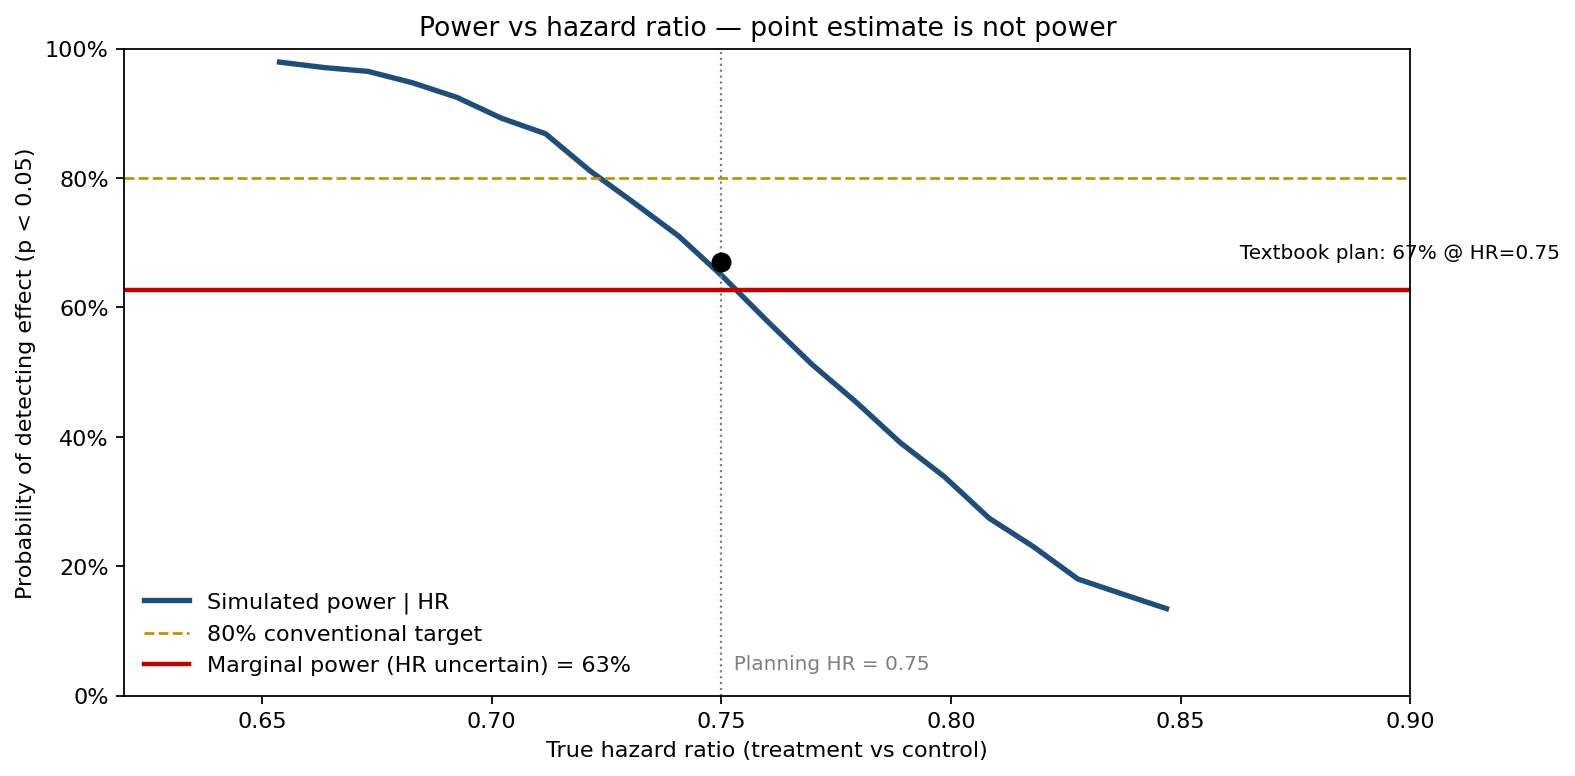
Across the HR prior the Phase II actually supports, the protocol straddles the 80% line rather than living above it. Averaging over that prior, the marginal power is 63% — not the 80% the protocol quotes at the planning HR. Everything below follows from reading that curve honestly.
Where the planning calculation goes wrong
The Schoenfeld formula for a log-rank test under proportional hazards gives the events needed for a target power:
\[ d \;=\; \frac{(z_{1-\alpha/2}+z_{1-\beta})^{2}}{p_1\,p_2\,\ln(HR)^{2}} \]
For α=0.05 two-sided, 80% power, balanced allocation, and HR=0.75, this is ~228 events. At a control 36-month event rate of 55%, 550 patients deliver enough events with margin. So far, deterministic.
The simulation injects four sources of uncertainty the formula ignores:
- Hazard ratio as a Triangular(0.65, 0.75, 0.85) prior, reflecting the precision of the Phase II.
- Enrollment rate as LogNormal with median 3.8 patients per site per month, dispersion 0.30 — calibrated to the sponsor's last four trials in the indication.
- Dropout rate as Beta(2.5, 25), mean ~9% per year, fat-tailed enough to allow the bad-recruiter site clusters that actually happen.
- Control event rate between 45% and 62%, reflecting epidemiology drift since the historical control.
Each of 100,000 simulated trials draws one value from each input, runs the trial calendar forward, accumulates events, and applies the log-rank Z against the critical value.
Power is a distribution, not a number
The textbook number was 80% power at HR=0.75. The simulation says the marginal power — averaging over the HR prior — is 63%. The deterministic answer is conditional on knowing the truth: even the textbook Schoenfeld calculation, evaluated at HR=0.75 under the model's own retention assumptions, lands at 67% rather than the protocol's stated 80%.
Read against the true HR, the curve shows what the protocol can and cannot do. Above HR=0.80 power falls to roughly 30%; at HR=0.70 it reaches ~90%, climbing toward 98% only at the optimistic 0.65 end. The protocol's whole working range — the range the Phase II actually supports — straddles the 80% target rather than living above it. The "Sample size 550 gives 80% power" line in the protocol is true on its own terms but misleading as a guide to what the trial is likely to deliver.
Timeline is the other half of the story
Enrollment uncertainty drives most of the duration spread. The forecast S-curve combines a slower-than-planned ramp (median enrollment 21 months vs deterministic 18, including a 0–6 month site-activation lag) with a fixed 18-month follow-up window:
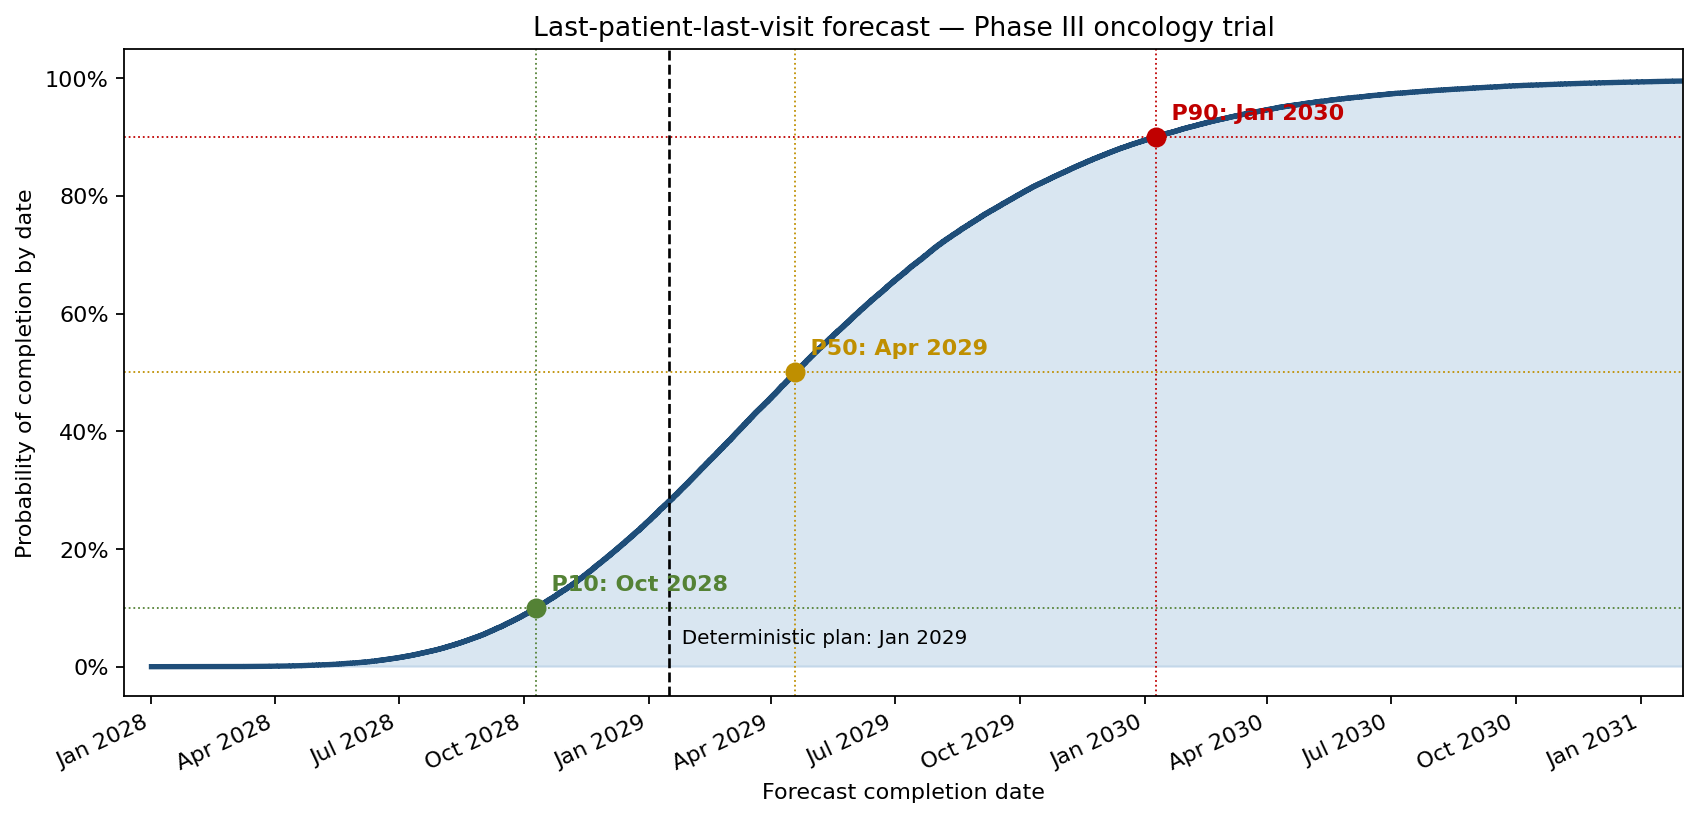
The deterministic plan lands at Jan 2029; P50 LPLV is Apr 2029 and P90 is Jan 2030 — roughly a year of contingency between the deterministic date and P90 that the Gantt did not surface. For an oncology asset where the patent clock is running, that eight months has measurable revenue cost; for portfolio planning, ignoring it means systematically over-promising the launch window.
Where the power budget bleeds
Tornado-ranking the inputs against marginal power shows which uncertainty matters most:
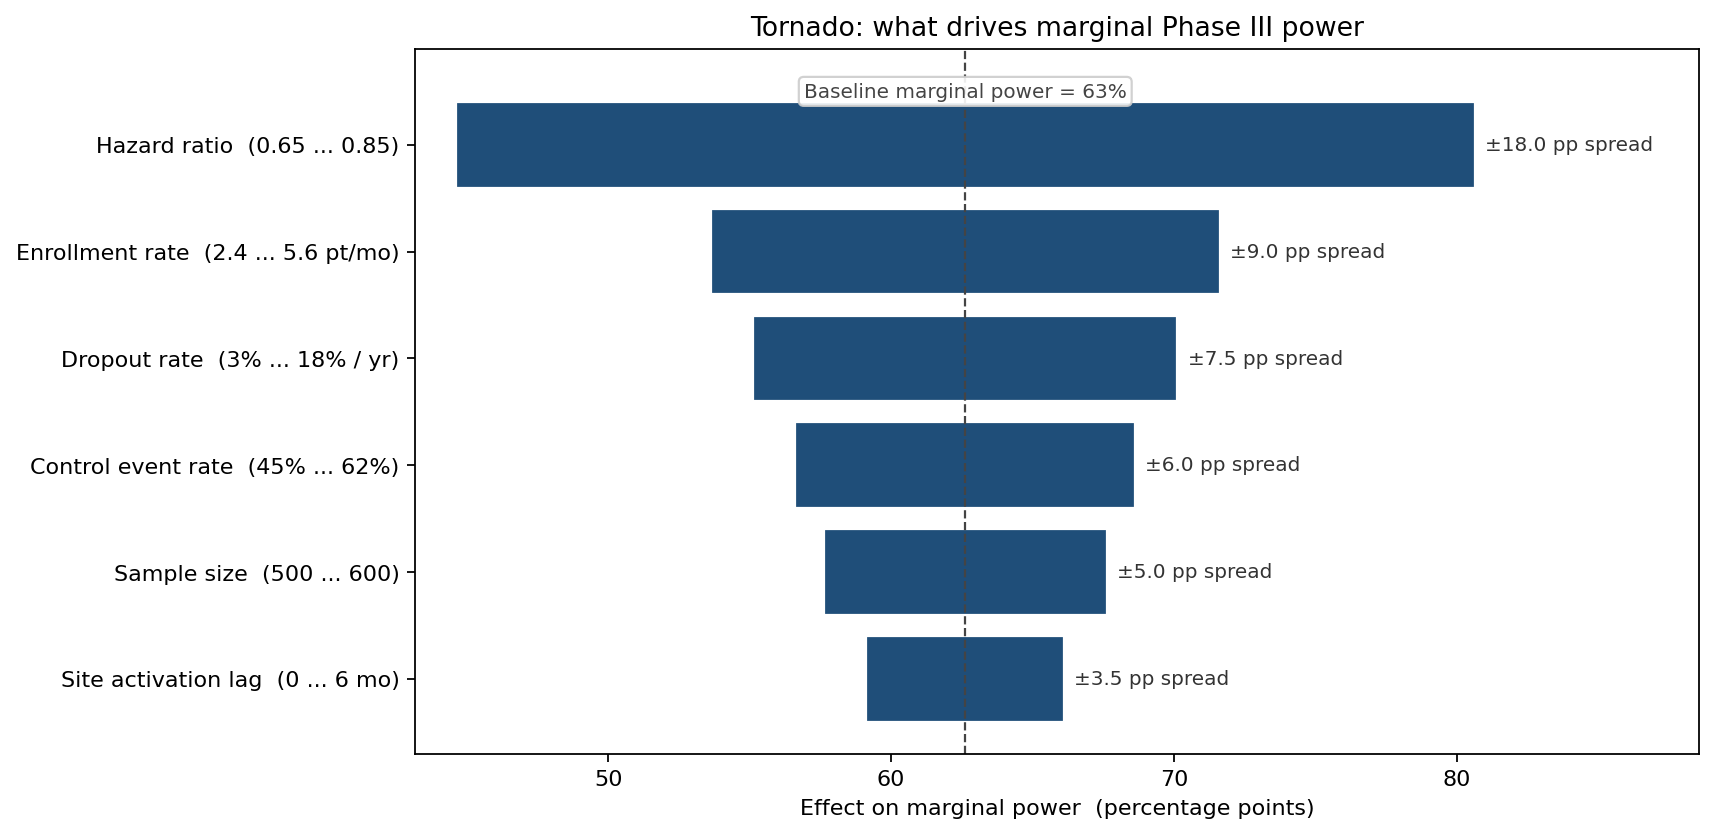
Hazard-ratio uncertainty dominates by a wide margin: shrinking the HR prior from Triangular(0.65, 0.85) to Triangular(0.70, 0.80) — the kind of tightening a 600-patient Phase IIb would have produced — adds roughly 18 percentage points of marginal power. Enrollment-rate and dropout-rate uncertainty are second-tier and address-able operationally; control-event-rate uncertainty argues for a registry-based recalibration before lock.
Adaptive design — what the futility look is worth
The team also evaluated a futility look at 50% of planned events. If interim conditional power falls below 20%, the trial stops. The simulation compares total cost between fixed and adaptive designs:
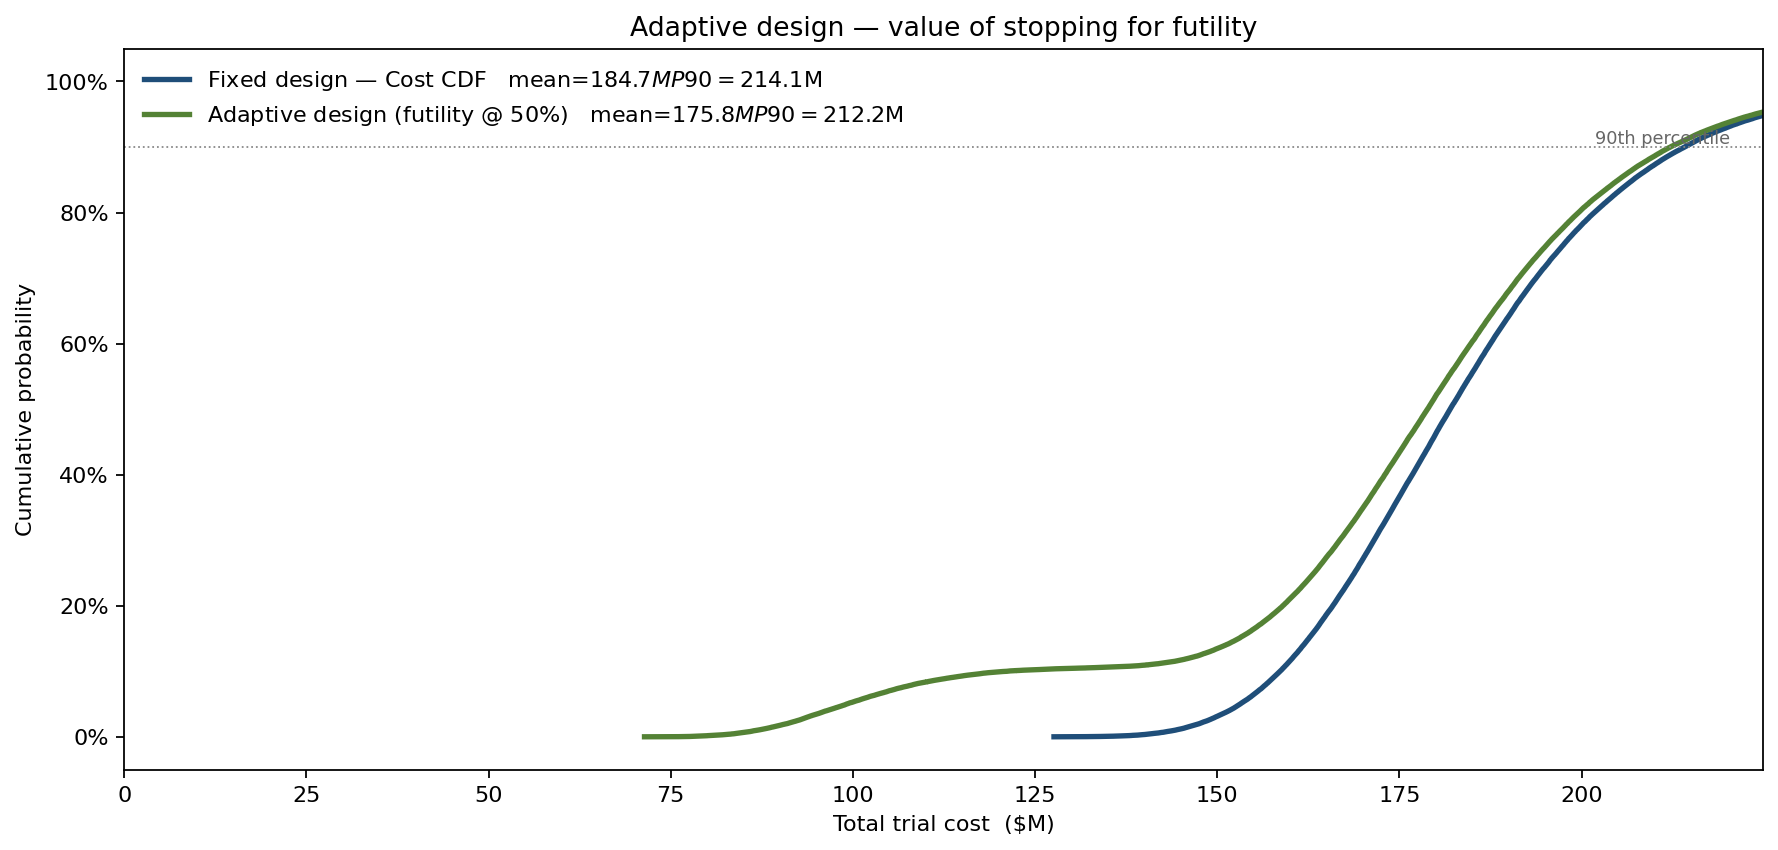
Marginal power drops by about 5 percentage points (63% to 58%) because some borderline trials with weak interim signals are stopped early. Mean cost falls by roughly 5% — driven by a left tail of futility-stopped trials (about 11% of the total) at ~55% of planned spend. The futility look is a cheap option on the downside, paid for in a small marginal-power haircut and the operational overhead of an interim DSMB.
What changed
- Sample size held at 550 — the team had wanted to push to 700 for an "extra 10% of power"; the simulation showed that the same 10% comes more efficiently from tightening the HR via a small Phase IIb extension at one-third the cost.
- Adaptive futility design adopted, with the DSMB authority to stop at 50% events for conditional power below 20%.
- Launch-window communication revised: the commercial team updated its launch window from a single date to a P10/P50/P90 quoted in capital-allocation discussions, removing a chronic over-promise pattern.
- Risk-adjusted NPV recalculated on the simulated power × duration distribution rather than the protocol's point estimates — the asset rNPV dropped 14%, but the change was deemed worth taking now rather than discovering at trial readout.
ModelRisk Functionality Used
- Triangular hazard-ratio prior combined with LogNormal enrollment, Beta dropout, and Uniform control-event-rate inputs feeding the log-rank Z calculation across 100,000 simulated trials.
- Schoenfeld events-per-trial logic evaluated inside Excel formulas rather than via closed-form approximation, so deviations from proportional hazards can be added later as a stress test.
- Conditional power calculation at interim used to score each simulated trial under the adaptive futility rule, producing the cost-distribution comparison against the fixed design.
- Tornado ranking of marginal-power drivers showed HR-prior tightening was the cheapest power purchase available — driving the Phase IIb extension decision.
- S-curve construction on simulated LPLV dates gave the commercial team a probabilistic launch window in place of the deterministic Gantt date.
Power on the protocol's planning HR is not the same as power on the world. The simulation in ModelRisk replaces "80% if everything matches the plan" with "63% marginal, mostly bounded by what we know about HR" — a number the team can defend and act on, rather than one that survives only as long as no input moves.