

Industry: Oil and Gas Exploration
Product: ModelRisk
Application: Supply Chain Logistics for Offshore Operations
The Cost-Minimizing Mud Buffer Still Runs Dry Six Winters in Ten
A drilling platform 180 miles offshore runs through roughly 180 barrels of drilling mud a day. Routine resupply is a vessel that, once dispatched, takes anywhere from 4 to 14 days to actually deliver — weather, port congestion and vessel availability all stretch the transit — and the deck holds about 9,000 barrels of mud-pit capacity. The operations spreadsheet picks the reorder point that minimizes total expected cost. The uncomfortable finding from simulating the same policy: the cost-minimizing reorder point (around 14 days of supply) still suffers a stockout in more than nine winters out of ten, because demand keeps drawing the platform down across the whole 4–14 day lead-time window after the order is placed. Each stockout forces an emergency helicopter airlift at roughly $400,000 per day bridged, against $80,000 for a routine supply vessel.
A multinational operator with platforms in the Gulf of Mexico, the North Sea, and Southeast Asia rebuilt its supply-chain planning in ModelRisk after a winter of emergency-airlift surprises blew past the deterministic logistics budget. The mandate: find the reorder point that genuinely controls stockout risk — with the full cost distribution attached — not the one that merely looks cheapest on a calm-weather average. Three candidate policies produce three visibly different annual-cost distributions:
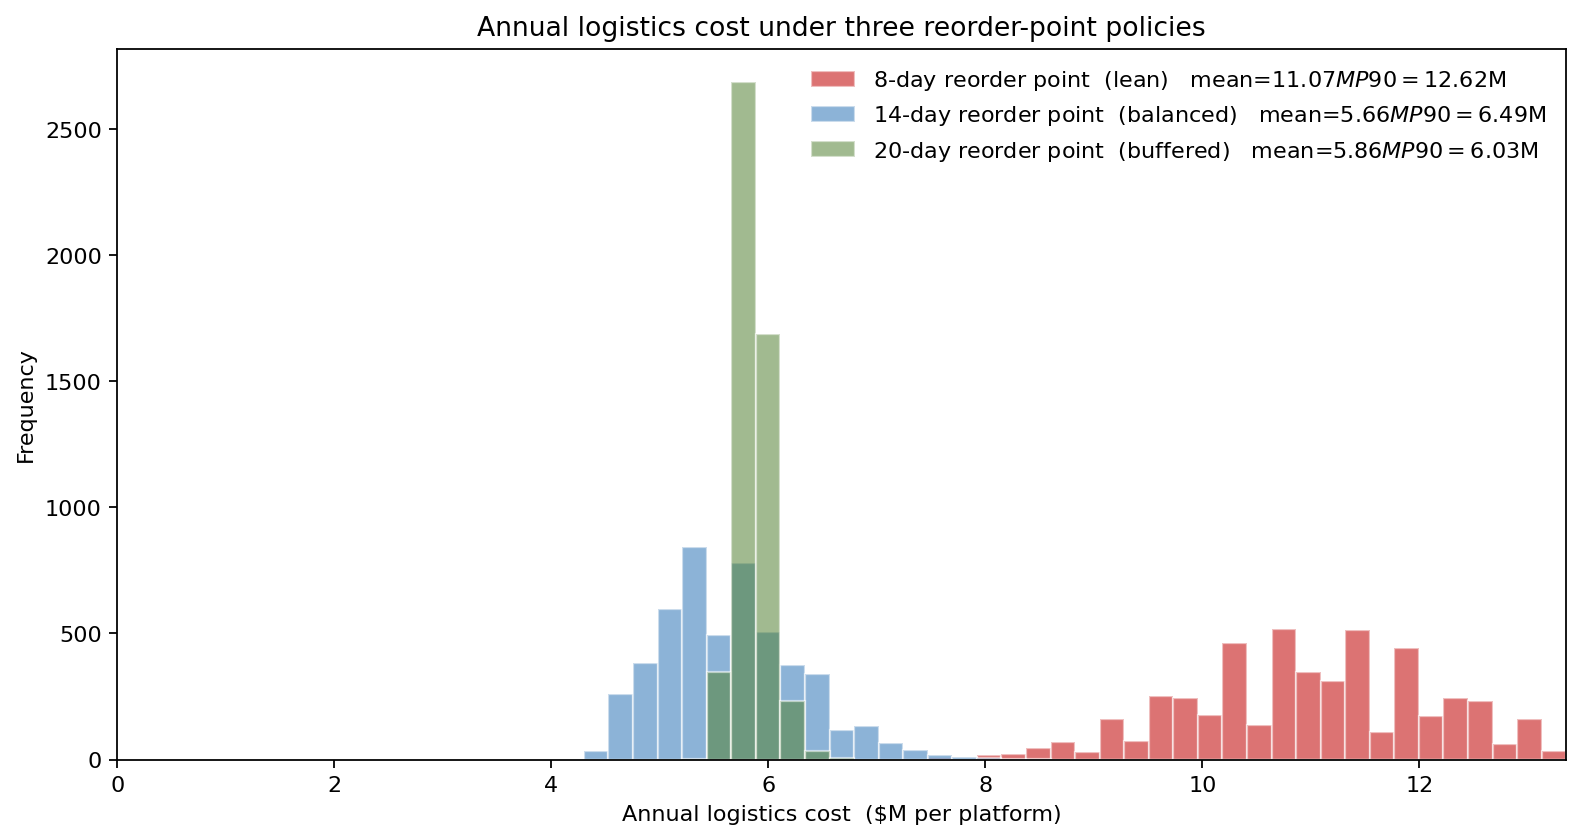
The lean 8-day policy is cheapest in routine vessel cost but carries a punishing emergency-airlift tail; the buffered 20-day policy nearly eliminates airlifts but ties up more capital in mud on the deck. The balanced 14-day policy sits between. The trade-off between holding cost, routine cost and emergency exposure is exactly what a deterministic mean-of-each calculation cannot show.
A (Q, r) policy with a stochastic lead time
The model tracks daily on-hand inventory and an in-transit order pipeline. An order of fixed size (about 20 days of supply) is placed when the inventory position (on-hand plus on-order) falls below the reorder point r, but it arrives only after a stochastic vessel lead time — and not on a weather-closed day:
- Demand — LogNormal daily consumption, median 180 bbl/d, sigma 0.5 — the skewed usage of drilling mud with rare high-loss-circulation days.
- Vessel lead time — Triangular(4, 7, 14) days. This is the load-bearing input the deterministic model ignores: a reorder point below the lead-time demand stocks out before the vessel can reach the platform.
- Weather closure — Bernoulli per day, 20% in Nov–Feb, 7% in summer, which slips a due delivery to the next open day.
- Emergency airlift — when on-hand demand cannot be met, a same-day helicopter airlift bridges the gap at $400k/day.
- Holding cost — proportional to average on-hand inventory, so a larger buffer carries a real capital-and-storage penalty.
The deterministic Wilson-EOQ policy uses these at their means and returns a single reorder-point number. What it cannot show is how stockout risk and the emergency bill respond as the reorder point moves — the interaction of lead-time variance, weather and demand that produces the stockouts.
Three policies, three distributions
Reading the three policies off the distribution above:
- 8-day (lean): mean annual cost ~$11.1M, of which ~$7.6M is emergency airlift; stockout in 100% of simulated years (mean 18.9 stockout-days). The cheapest routine bill, the worst total.
- 14-day (balanced): mean ~$5.7M (routine $1.6M, airlift $1.1M, holding $2.9M), P90 ~$6.5M — but still a stockout in 93% of years (mean 2.8 days). This is close to the cost-minimizing point, and it is not a comfortable policy.
- 20-day (buffered): mean ~$5.9M (holding rises to $4.2M, airlift collapses to ~$0.03M), P90 ~$6.0M, and stockout probability falls to 6%.
The striking result: the buffered policy costs only about $0.2M/yr more on average than the cost-minimizing one, yet cuts stockout probability from 93% to 6% and tightens the P90 (from $6.5M to $6.0M). The cheapest policy and the reliable policy are nearly the same price — but only the simulation reveals that, because the deterministic comparison sees only the mean and never the stockout frequency.
The reorder-point trade-off frontier
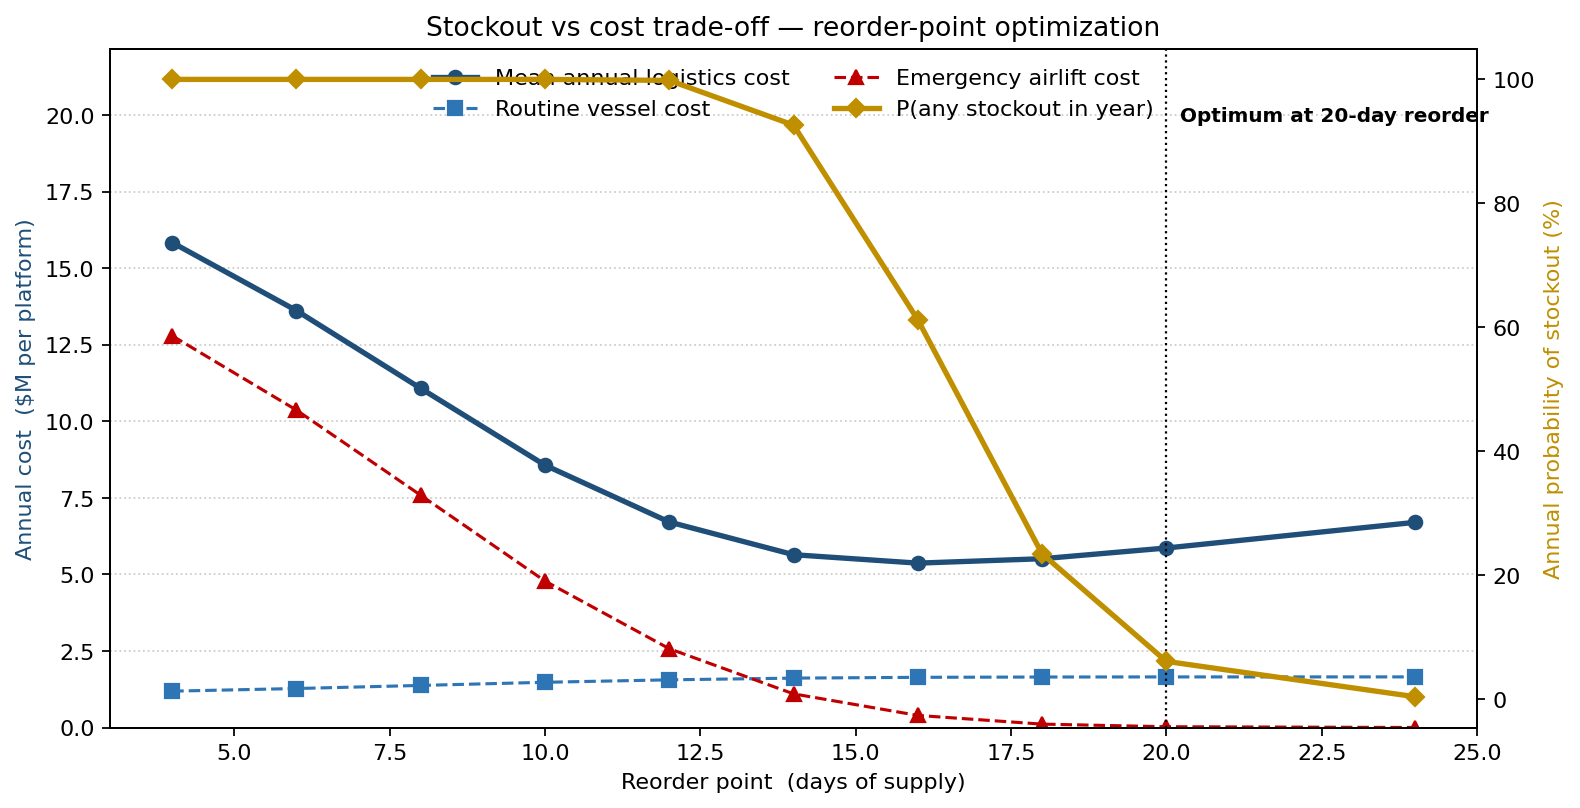
Sweeping the reorder point from 4 to 24 days of supply traces the classic inventory U-curve:
- At a lean buffer the emergency-airlift cost dominates — $12.8M/yr at 4 days — and falls steeply as the buffer grows.
- Holding cost rises with the buffer, so total cost bottoms out and then climbs again: the minimum total cost (~$5.4M) sits at about a 16-day reorder point.
- But that cost-minimum still stocks out in ~6 of 10 years. Stockout probability only drops below 10% at a 20-day reorder point, and below 5% at 24 days.
That gap is the decision. The cost-optimal buffer (16 days) and the reliability-optimal buffer (20 days) differ by only about $0.5M/yr — and on a platform where a stockout means halting a drilling program, operations bought the reliability. The selected policy was a 20-day reorder point, with a 24-day winter setting for the heavier-weather North Sea platforms. This is the newsvendor trade-off the Wilson EOQ — which assumes a deterministic lead time — cannot produce.
What actually drives stockout-day count
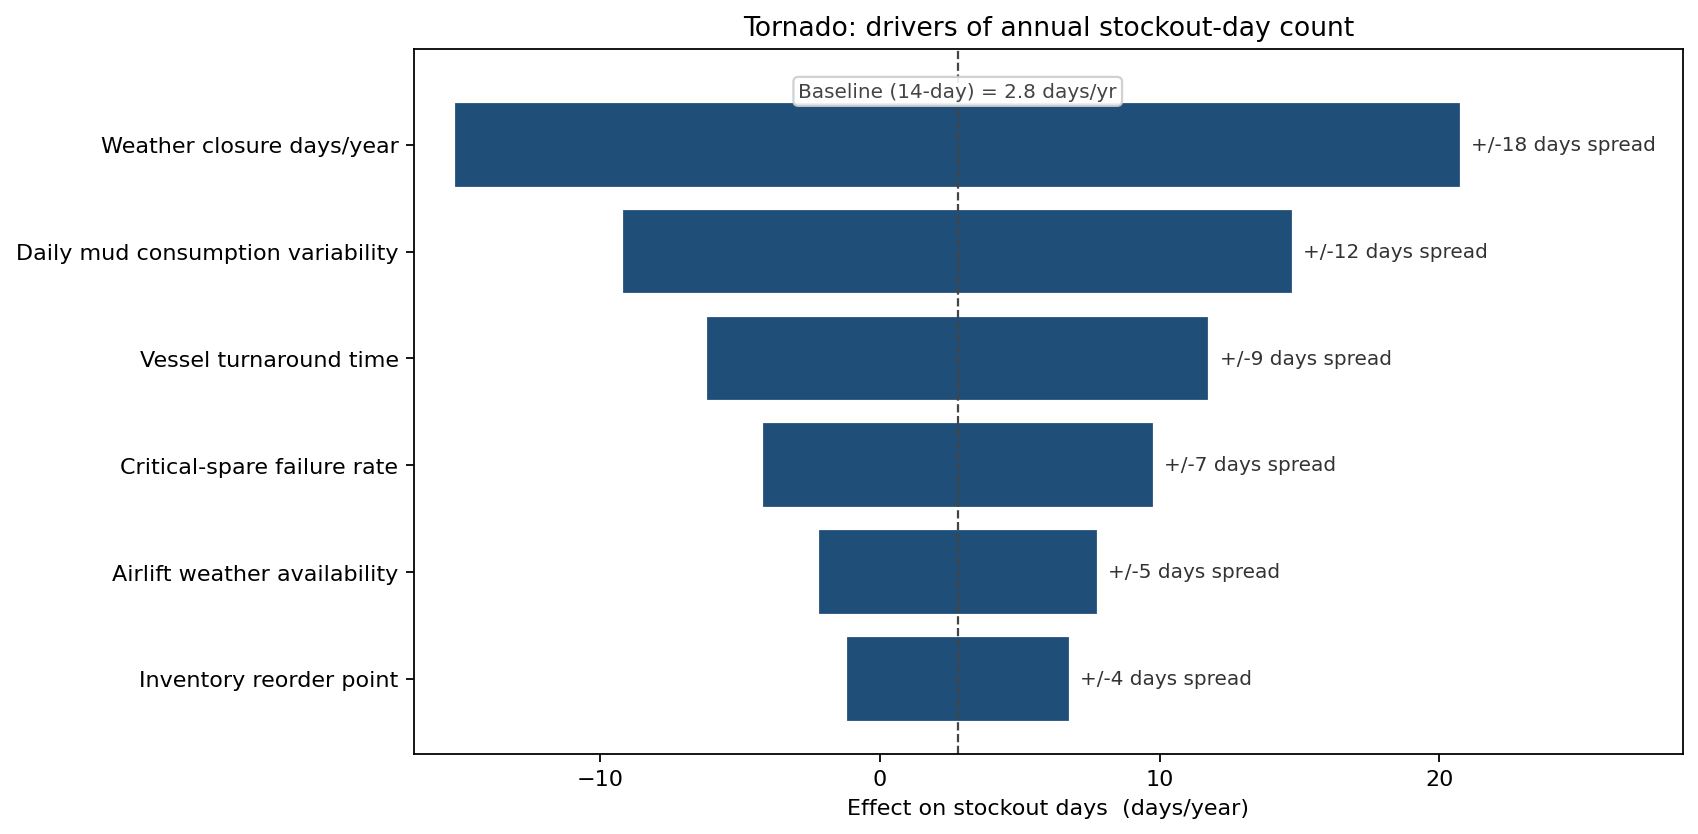
Around the balanced 14-day policy, weather-closure days dominate the spread of annual stockout-days, followed by daily-demand variability and vessel turnaround (lead time). Critical-spare failures and airlift availability follow. The reorder point itself sits low on the tornado once it is set into the reliable range — which is exactly why the next dollar of de-risking spend went not into still more inventory but into better short-term weather forecasting to optimize vessel dispatch, a forecasting-service contract estimated to cut the effective weather-closed-day rate by about 15%.
Where the budget actually goes
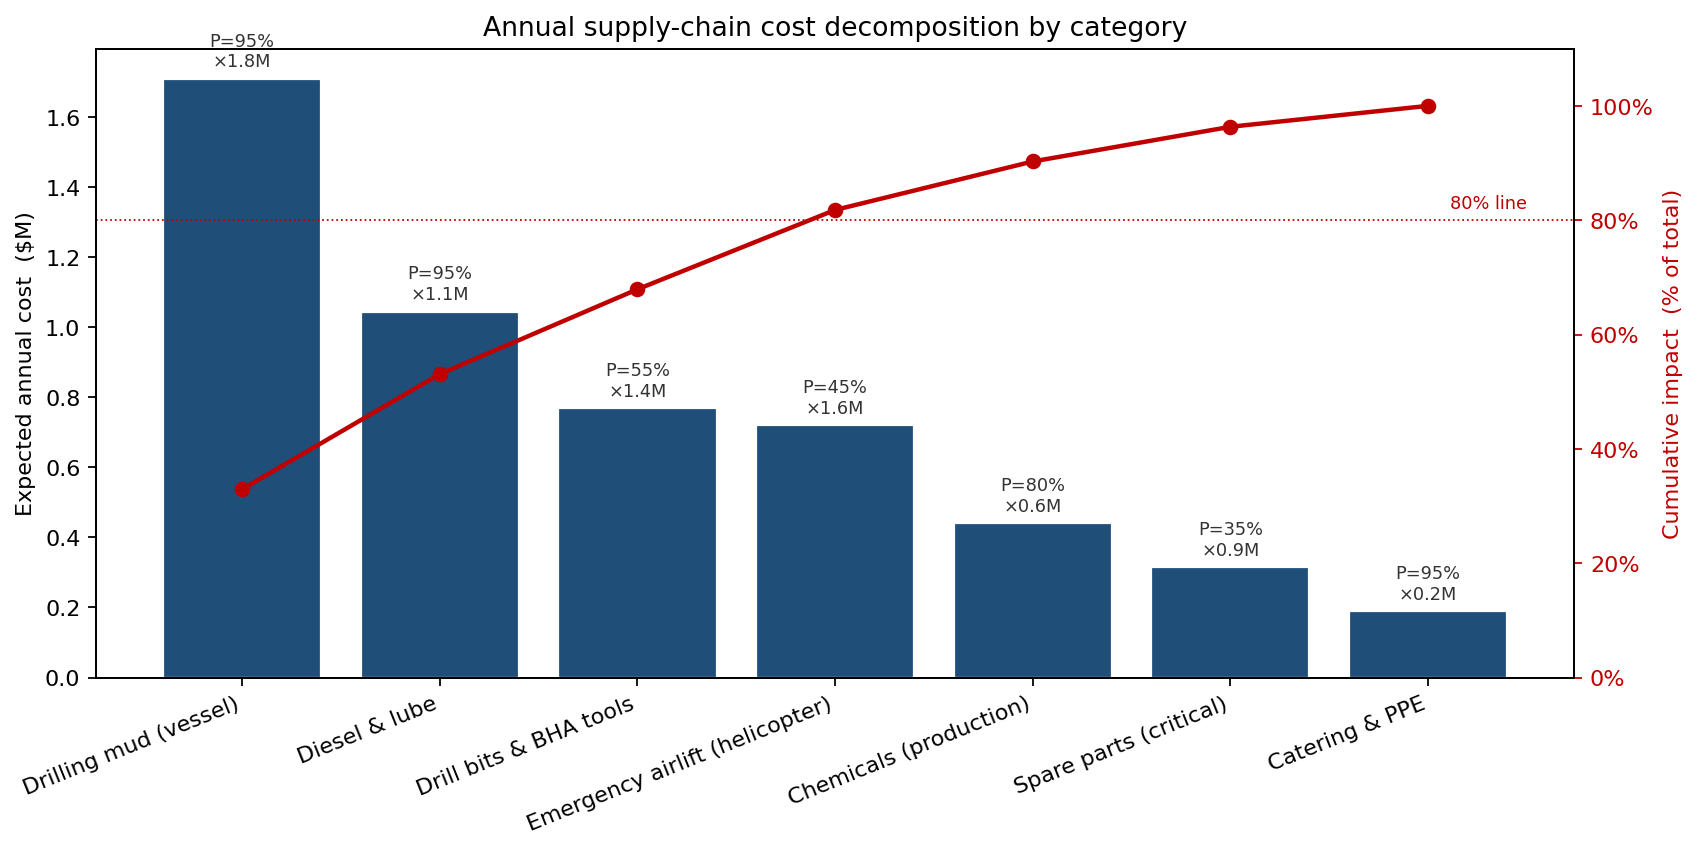
The Pareto across supply categories shows the familiar concentration: drilling mud, diesel, drill bits and emergency airlift together account for about 82% of annual logistics cost (mud alone 33%). Emergency airlift is the most painful line precisely because it is the most controllable through reorder-point policy — and it is the line that nearly disappears once the buffered policy goes into effect.
What changed
- Reorder point standardized at 20 days across the offshore fleet — the reliability-optimal point, only ~$0.5M/yr above the raw cost minimum — with a 24-day winter setting for North Sea platforms where weather closure runs above 25% in Dec–Feb.
- Forecasting-service contract signed, focused on the 72-hour vessel-dispatch window where weather closure has the largest impact.
- Emergency-airlift retainer renegotiated with the helicopter operator on the basis of the simulated number of expected emergencies rather than a per-event-only contract.
- Annual emergency-airlift bill fell from ~$7.6M (the lean-policy exposure) to roughly $0.03M once the 20-day policy went into effect — the saving that paid for the added holding cost several times over.
ModelRisk Functionality Used
- (Q, r) inventory simulation with a stochastic lead-time pipeline across 5,000 platform-years — LogNormal demand, Triangular vessel lead time, and seasonal weather closure — producing the joint distribution the deterministic newsvendor cannot.
- Reorder-point sweep producing the cost-vs-stockout-probability frontier directly from one engine — exposing the U-shaped total cost and the gap between the cost-optimal and reliability-optimal buffers.
- Holding / routine / emergency cost decomposition per policy, so the average-cost near-tie between the cost-min and the reliable policy is visible.
- Tornado on stockout days identifying weather closure and lead-time variance as the largest drivers — redirecting de-risking spend toward forecasting rather than inventory.
- Pareto decomposition of annual cost by category, identifying emergency airlift as the most controllable line.
A supply-chain plan written against a deterministic lead time and a calm-weather calendar is a plan written for a year that does not exist. ModelRisk is what shows that the cheapest buffer on paper is the one that runs dry — and that near-certain supply costs only a little more.