

Industry: Oil and Gas Exploration
Product: ModelRisk
Application: Refining Capacity Investment Under 20-Year Market and Capex Uncertainty
Choosing Between a $4.5B Greenfield and a $1.2B Brownfield When the IRR Hinges on a 20-Year Crack Spread
A new refinery in North America has not been built in nearly half a century, and the reason is in the cashflow profile: \$4-5 billion of capex up front, 5-7 years to commission, 20+ years to recover — across a 20-year window in which the 3-2-1 crack spread has ranged from \$4/bbl to \$45/bbl and energy-transition policy has bent the long-run demand outlook three times.
A North American downstream operator weighing a \$4.5B greenfield 200 kbbl/d refinery against a \$1.2B brownfield expansion of an existing site (+50 kbbl/d) rebuilt its NPV model in ModelRisk after the corporate-development team realized the deterministic base-case NPVs of \$3.8B (green) and \$0.9B (brown) gave the wrong answer on a probability-weighted basis. The simulation reframed the choice from "which has the higher NPV?" to "which is the better risk-adjusted use of \$4.5B of balance-sheet?"
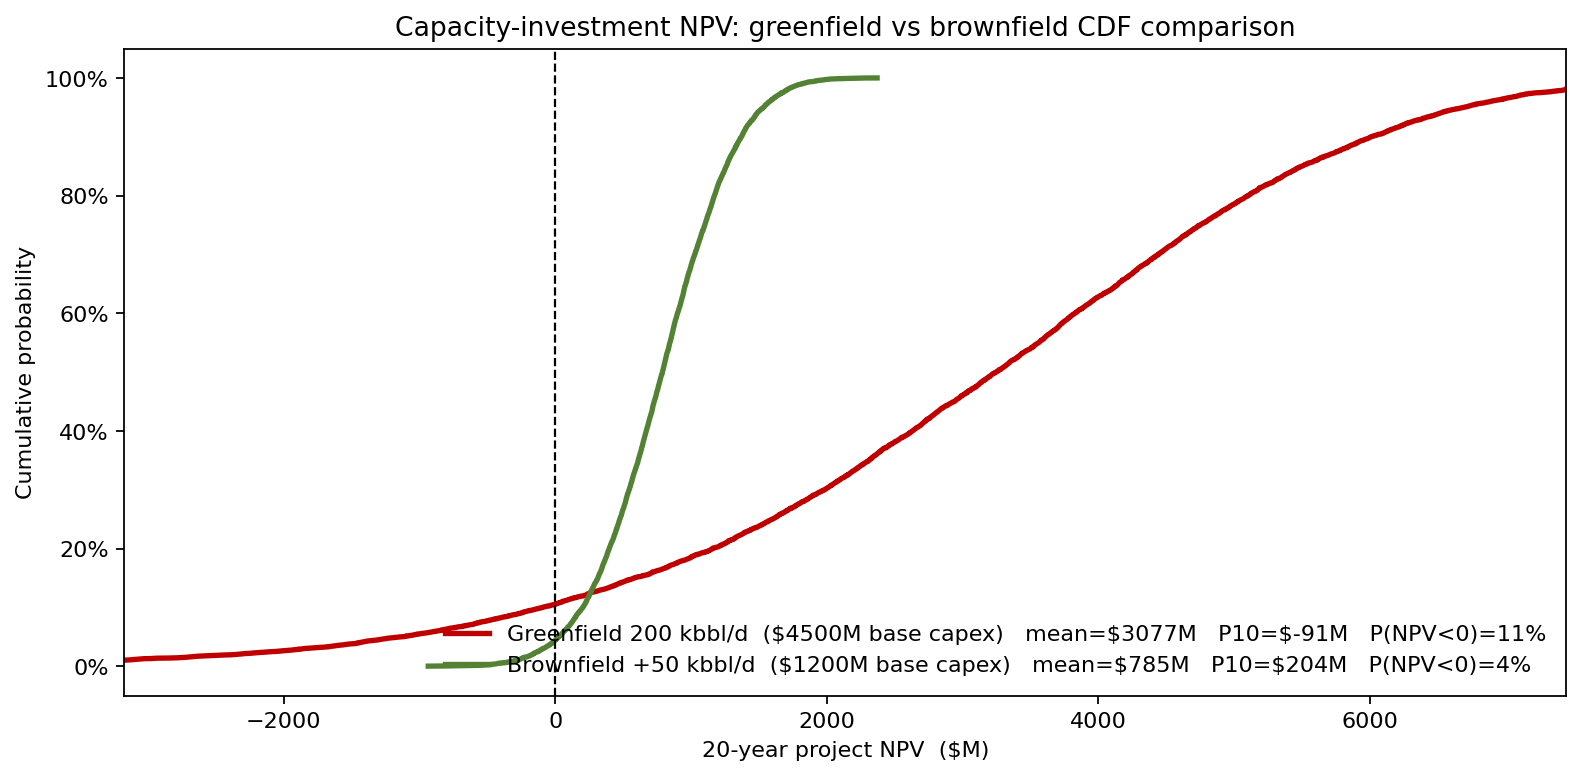
The greenfield carries the higher mean NPV (~\$3.1B) but a 10.5% chance of destroying capital. The brownfield's mean is far lower (~\$0.8B) yet its distribution is tighter and stays positive far more often (P(NPV<0) of 4.4%) — and on a per-dollar-of-capex basis it is the better bet. That reordering is the whole point of the analysis, and it only appears once the NPVs are distributions rather than points.
Four uncertainties that compound over 20 years
The model puts annual cashflow as throughput × (crack − opex), with utilization and crack varying year-by-year, and a one-off energy-transition shock that can step demand down by 25%.
- Crack spread. AR(1) process with long-run mean \$20/bbl, persistence parameter \(\phi = 0.55\), and annual shocks ~ Normal(0, \$6/bbl). Mean reversion matters because the crack is bounded above by refining margins competition and below by physical run-cut economics; a pure GBM would drift either direction over 20 years in a way that history disproves.
- Utilization. Beta(78, 9) — mean ~89.7%, with a slow drag of 0.5 pp/year applied after year 12 to reflect asset aging.
- Energy-transition shock. A 0.8%-per-year probability (~8% per decade) of a discrete demand step down to 75% of base. This represents the discrete risk of accelerated EV adoption, a carbon tariff, or a regional ICE-ban policy — events that the AR(1) crack process cannot capture because they are structural, not cyclical.
- Capex overrun. LogNormal multiplier on the base estimate. The greenfield megaproject carries a wide overrun (median 1.05, mean ~1.12, a long right tail), while the brownfield expansion on a known site with proven units carries a much tighter one — the single biggest reason their NPV distributions differ in shape, consistent with the IPA mega-project overrun database.
What the simulation does to the deterministic NPVs
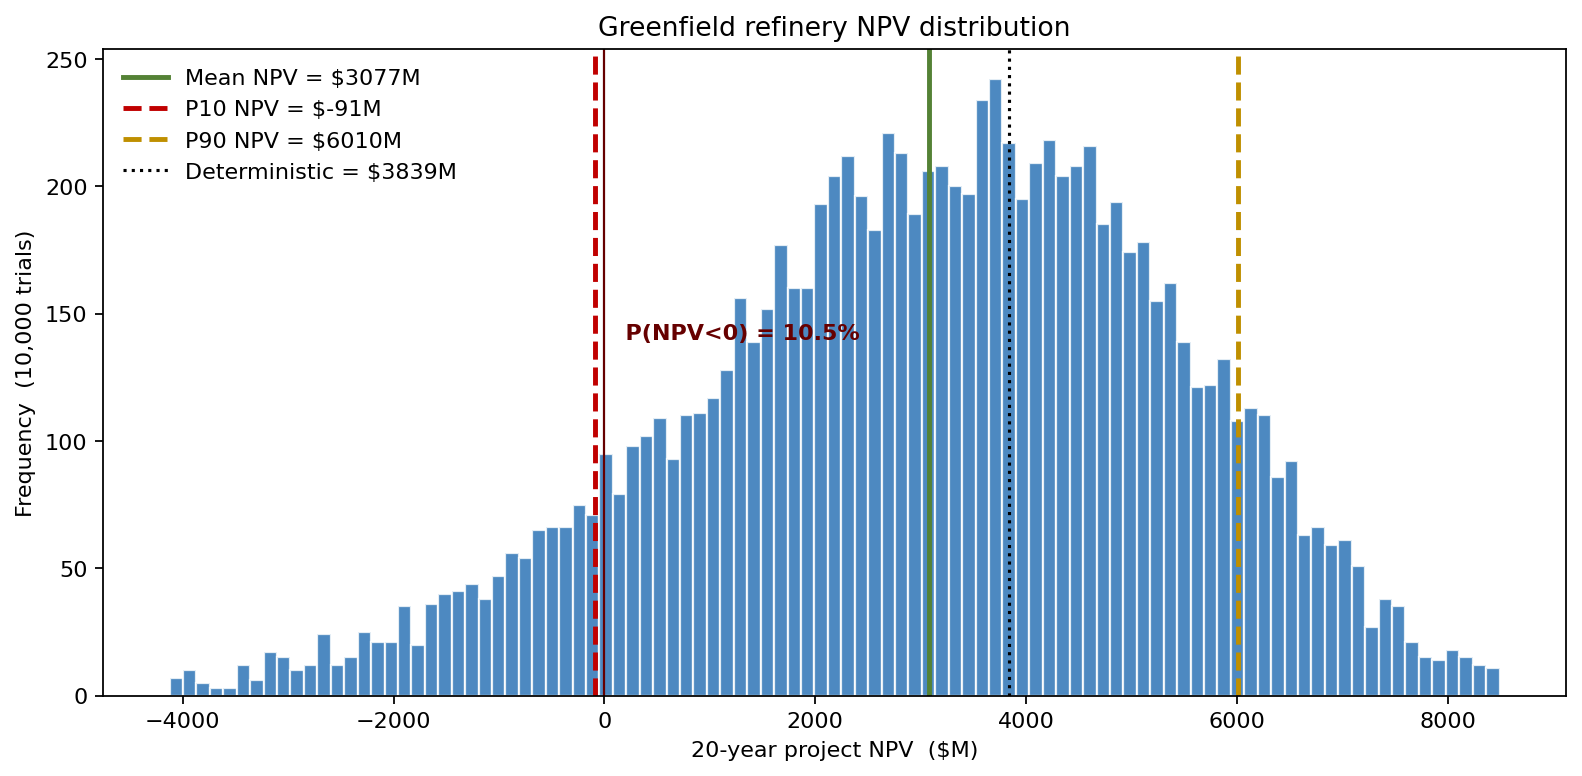
The deterministic NPV of the greenfield project came in near \$3.8B. The probabilistic NPV distribution tells a different story:
- Mean NPV ≈ \$3.1B — lower than deterministic because the overrun multiplier mean (1.12) is above its median (1.05) and the energy-transition shock pulls the mean down.
- P10 NPV ≈ −\$90M — the tenth-percentile outcome sits just below break-even; the project clears zero in about nine years out of ten, but only barely in the tenth.
- P90 NPV ≈ \$6.0B — meaningful upside if cracks hold above the long-run mean.
- P(NPV < 0) ≈ 10.5% — roughly a one-in-ten chance of destroying capital across the 20-year window.
The 10.5% downside is the number the audit committee actually had to debate.
Greenfield vs brownfield: it's not just the mean
Returning to the CDF comparison at the top of this article: the greenfield has the higher mean NPV and a much wider distribution. The brownfield has a far lower mean (~\$785M) but a tighter, mostly-positive distribution, with P(NPV < 0) of about 4.4% versus the greenfield's 10.5%.
The decision rule comes down to capital-at-risk preference. The greenfield's P10 NPV is negative (≈ −\$90M), so on a P10 basis it returns roughly −\$20M per \$1B of capex. The brownfield's P10 stays positive (≈ +\$200M), about +\$170M of P10 NPV per \$1B of capex. On a "P10 NPV per dollar of capex" metric — exactly the risk-adjusted basis the deterministic comparison cannot produce — the brownfield is the superior allocation of capital, even though its base-case NPV is lower.
Where the NPV uncertainty actually lives
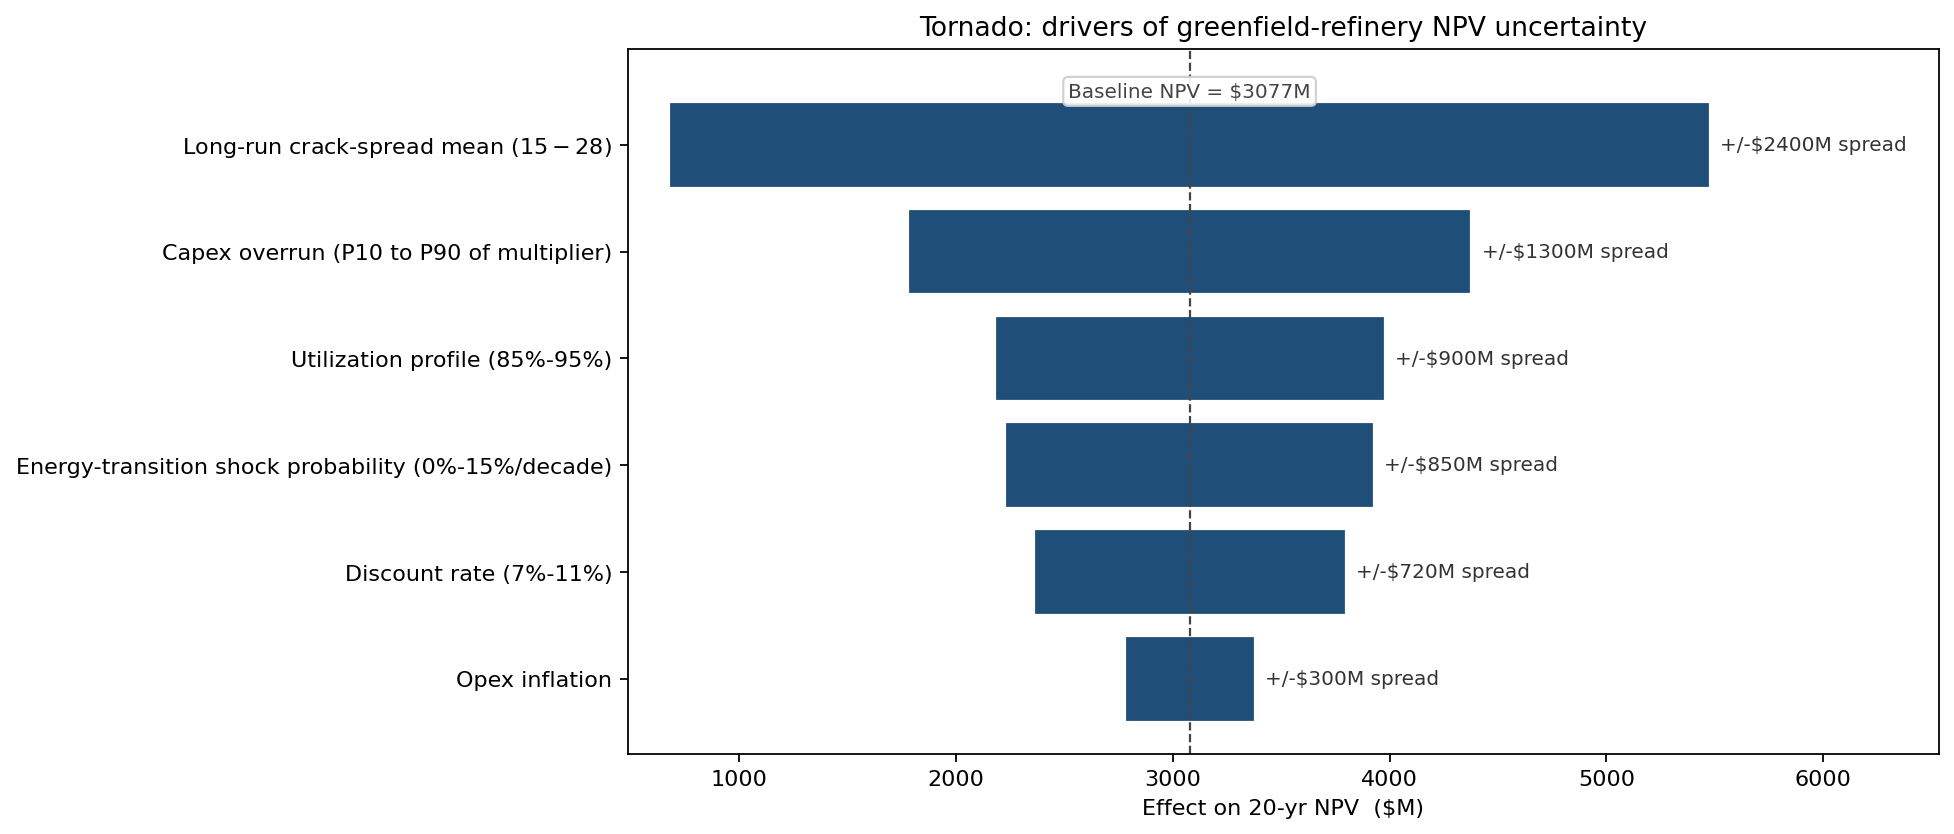
The long-run crack-spread mean dominates: a swing from \$15/bbl to \$28/bbl in the long-run anchor moves NPV by roughly ±\$1.2B — the single largest contributor to the P10-P90 NPV spread. Capex overrun is the second-largest driver (~±\$650M) and is the only one of the top three that is partially controllable. Utilization profile and energy-transition shock probability rank next; discount rate and opex are second-order.
The actionable read: a fixed-price EPC contract, even at a 5% premium, shaves NPV uncertainty more than any operational improvement. Crack-spread risk cannot be diversified away on a single-asset basis — it has to be carried, with the implication that the number of refineries the company should own is itself a portfolio question.
Capex confidence — the overrun is itself a distribution
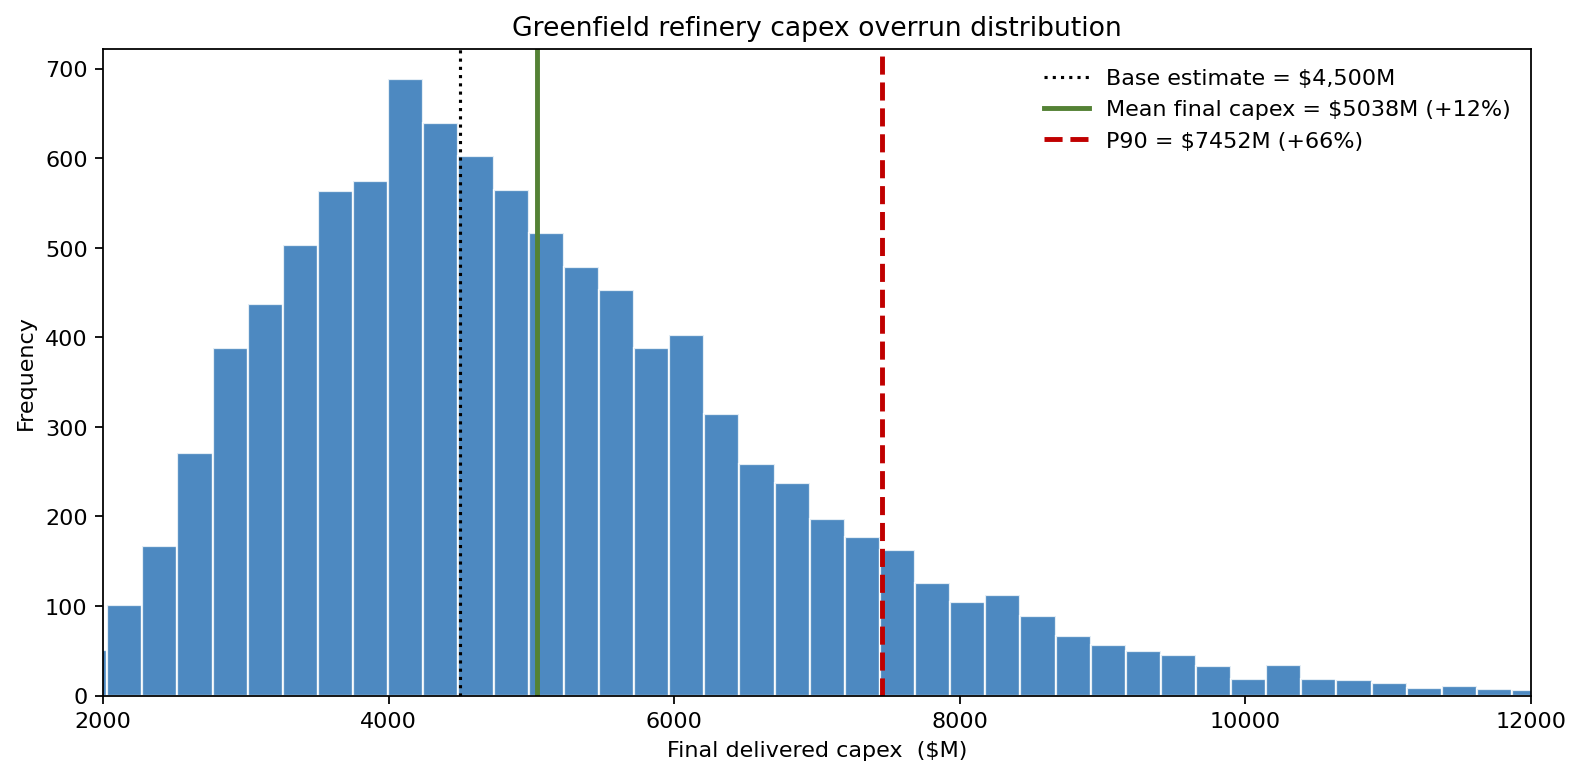
The base estimate is \$4.5B. The simulated final-delivered capex has a mean near \$5.0B (+12%) and a P90 near \$7.5B (+66%). The standard finance question — "how much contingency do we hold?" — has a probability-based answer rather than a percentage-of-base rule: hold enough cash and credit to fund the P85 of the overrun distribution, which is roughly \$6.8B, or carry the gap as a callable revolver.
What changed
- Brownfield approved, greenfield deferred pending an industry-consortium structure that could share the capex-overrun and energy-transition tail risk.
- Project memo template rewritten company-wide so that NPV decisions of >\$500M now require a P10 NPV per dollar of capex calculation alongside the deterministic IRR.
- Capex-contingency policy restated as a percentile of the simulated overrun distribution, replacing the legacy 12% fixed contingency.
- Energy-transition scenarios elevated from a sensitivity footnote to an explicit shock branch in the model — the audit committee now requires it on every multi-decade project.
ModelRisk Functionality Used
- AR(1) crack-spread process with calibrated mean and persistence — replacing the legacy "flat \$22/bbl planning crack" that produced the deterministic NPV.
- Discrete energy-transition shock layered as a one-off step rather than continuous drag, capturing the structural-policy risk that AR(1) cannot.
- LogNormal capex overrun calibrated to the IPA mega-project database, producing a P90 capex of \$7.5B versus a base estimate of \$4.5B — the number the corporate-finance team uses to size committed credit.
- Paired scenario CDFs of greenfield versus brownfield on common random crack and overrun draws, enabling a like-for-like P10-per-dollar comparison rather than two independent NPV point estimates.
- Tornado on greenfield NPV identifying that the long-run crack-spread mean accounts for ~40% of NPV spread — directing the strategy team to a portfolio rather than single-asset framing.
A \$4.5B downstream investment is not a one-number decision. It is the shape of a 20-year NPV distribution, the slope of the left tail, and the cost of the capex overrun the operator cannot quite control. ModelRisk is what produces the picture — and what gives a board the basis to choose the smaller, tighter brownfield over the larger, riskier greenfield with a clean conscience.