

Industry: Oil and Gas Exploration
Product: ModelRisk
Application: Refinery Optimization
When a $124M-a-Month Average Hides a 4% Probability of Losing Money
The 3-2-1 crack spread on the Gulf Coast traded between \$4/bbl and \$45/bbl over the past five years. For a 250,000 bbl/d refinery, a one-dollar shift in the crack moves monthly gross margin by \$7.5M. That kind of input volatility is exactly what deterministic refinery LP models — built around a single planning crack spread — cannot price into the next month's crude purchase or the next year's catalyst-upgrade decision.
A North American refining operator with a 250 kbbl/d facility rebuilt its planning model in ModelRisk after a quarter in which the planning-deck crack of \$24/bbl realized at \$11/bbl and a fully purchased medium-sour cargo turned a \$90M margin-plan month into a \$5M loss. The probabilistic re-run, applied retrospectively, had put the probability of negative monthly margin at roughly 4% — small, but in line with one bad month every two years, exactly the frequency the operator was experiencing.
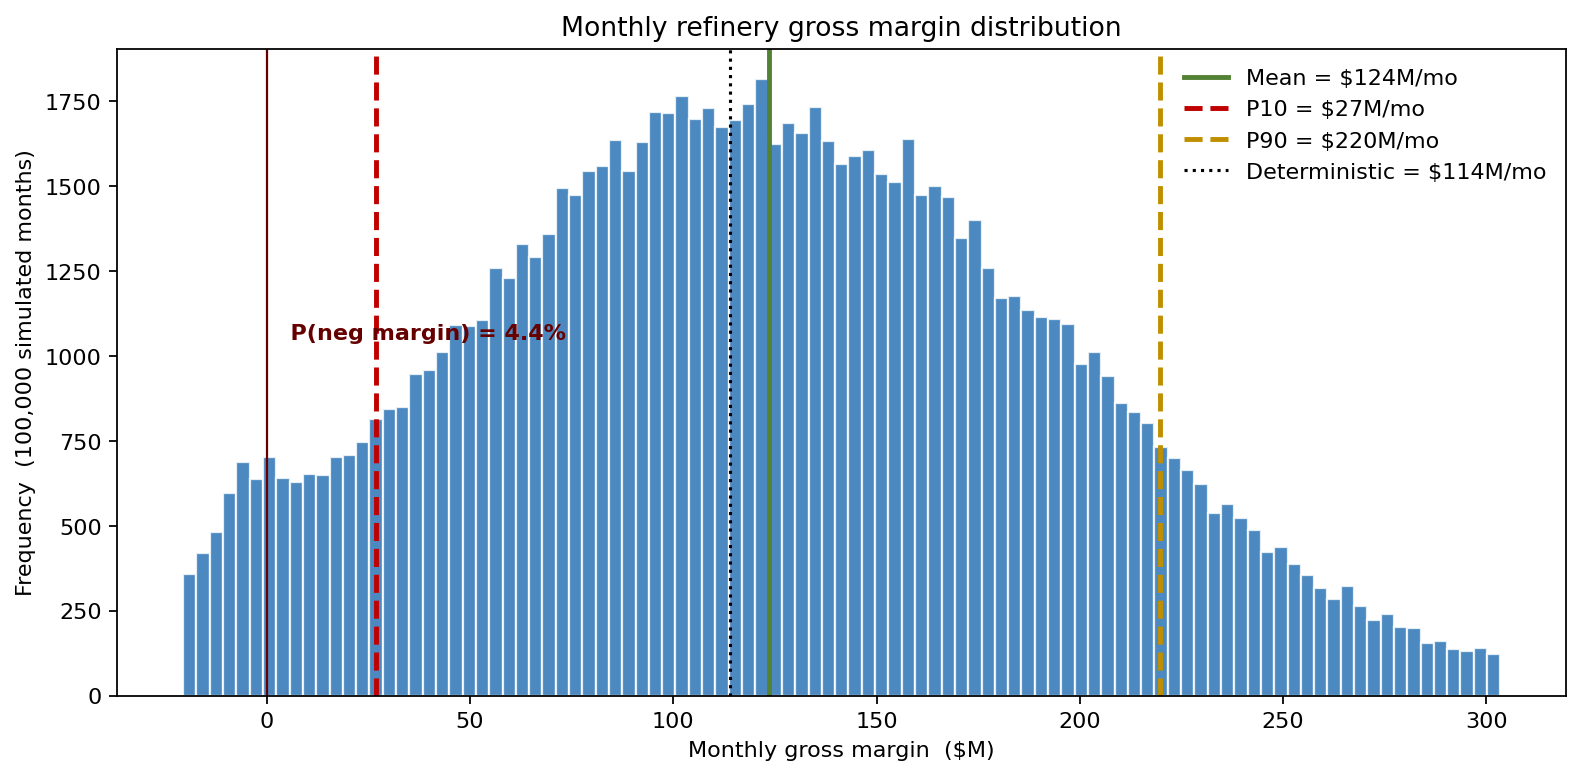
The simulated mean monthly margin is \$124M — close to the \$114M deterministic planning case — but the distribution runs from a P10 of \$27M to a P90 of \$220M, and 4.4% of months come out negative. That left tail, invisible to a single-crack LP, is the entire reason the model was rebuilt.
Five uncertain inputs into a single margin equation
Monthly gross margin (\$M) is
\[ M = \text{Throughput} \times \bigl(\text{Crack} + \text{BlendGain} - \text{Opex}\bigr) \]
with each input drawn:
- Crude price — LogNormal, median \$72/bbl WTI, sigma 0.20. (Not Normal: prices are bounded at zero with a right tail.)
- 3-2-1 crack spread — Truncated Normal, mean \$22/bbl, sd \$11, floor \$2. The wide spread is calibrated to the \$4–\$45/bbl five-year range; the floor matters because physical refining limits how negative the spread can go before run cuts close the gap.
- Throughput — Beta(80, 8) of 250 kbbl/d nameplate (mean utilization 91%) with an 8% monthly probability of a turnaround drag that drops utilization 15-50% for that month.
- Variable opex — LogNormal, median \$5.5/bbl, sigma 0.30. Captures energy-cost shocks and catalyst-replacement spikes.
- Crude-blend optimization gain — Triangular(0, \$1.5, \$5)/bbl, capturing the upside from feeding a heavier or lower-quality cut when the differential allows.
Crude price and crack are correlated negatively through a Gaussian copula (ρ ≈ −0.30): crude rallies typically compress the crack as products lag. Modeling them as independent — as several legacy spreadsheets did — overstates the joint probability of "crude up and crack flat," which is the conditioning event behind the worst loss months.
Margin distribution: where the mean lives versus where the tail lives
The deterministic planning case using mid inputs lands at \$114M/month. The simulation confirms a mean of roughly \$124M/month — close — but a P10 of about \$27M and a P90 near \$220M. The distribution is mildly right-skewed because of the crack-spread tail. The action number for the operator: probability of a negative monthly margin is about 4.4% — about one bad month every two years, consistent with the experienced frequency.
What actually moves the annual P&L
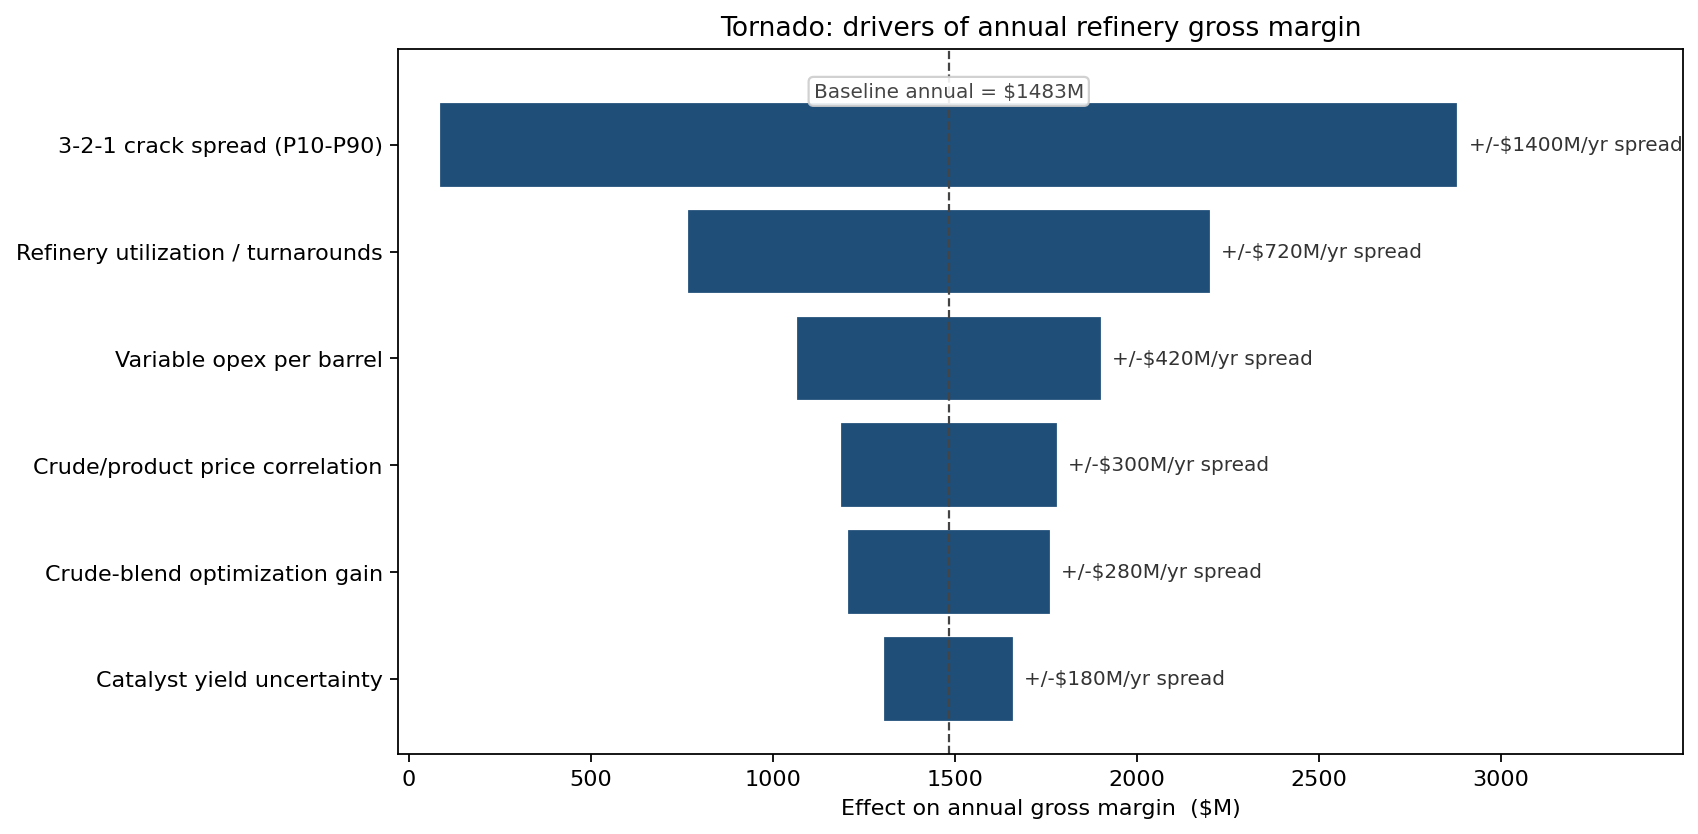
Crack spread dominates the annual margin variance — the single largest bar by a wide margin — followed by utilization and turnaround timing. Variable opex and the crude-product price correlation rank in the middle. Two operationally controllable levers, crude-blend optimization and catalyst yield, sit at the bottom of the chart — small per-bbl effects but reliable, and the only inputs the refinery actually decides on. The strategic implication: the crack-spread risk has to be hedged because it cannot be optimized; the controllable levers should be tuned hard because they are the only delta the operator owns.
Crude-slate selection: three feedstocks, three margin CDFs
The first downstream use of the model was choosing the monthly crude slate. Light sweet runs cleanly but expensively; heavy sour is discounted at the wellhead but punishes opex through coking and desulfurization energy. The three slates yield distinctly different margin CDFs:
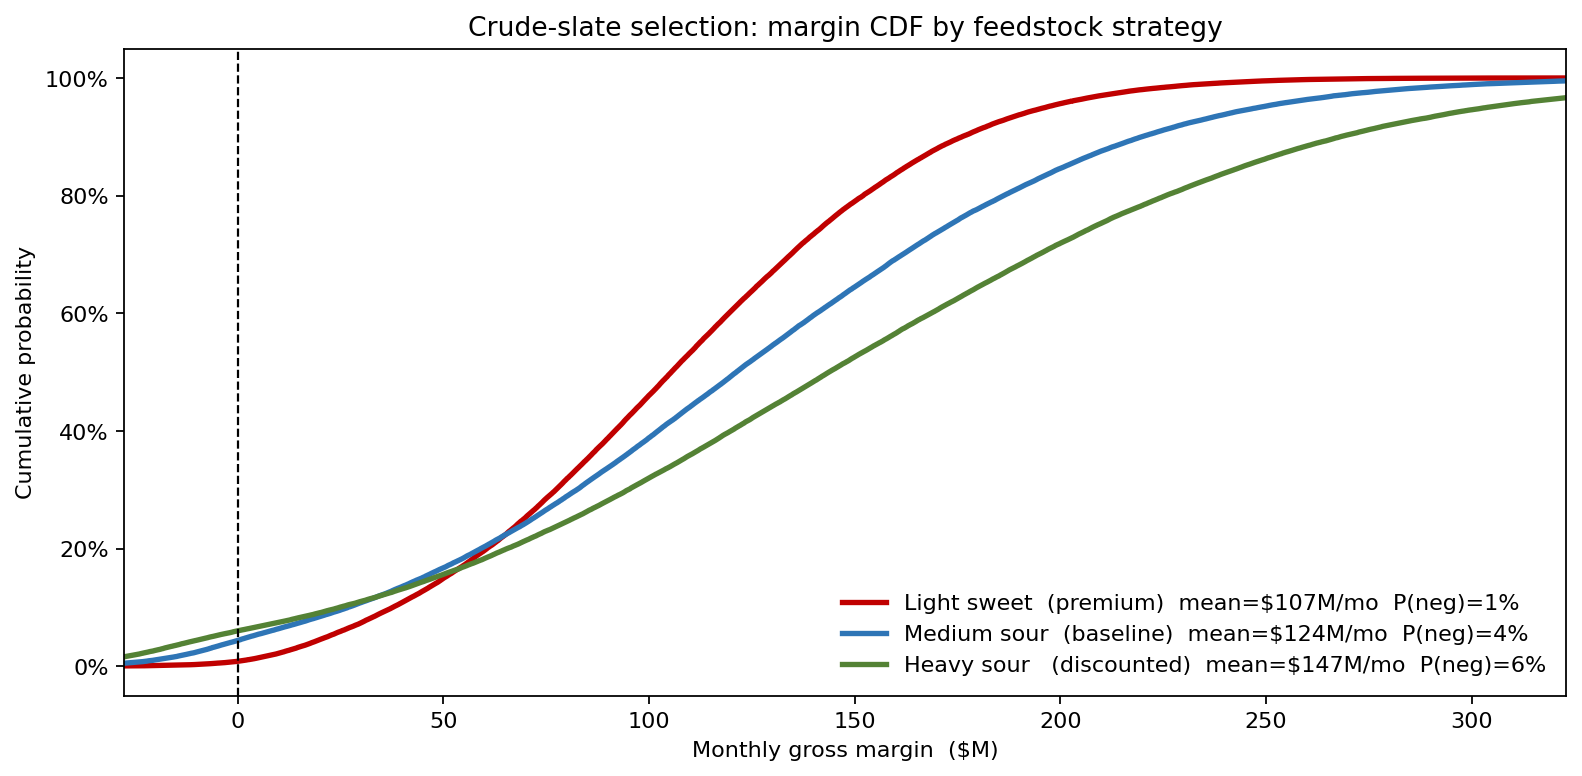
- Light sweet: mean monthly margin lower by ~\$17M, but the tail is tighter — its P10 (\$38M) is the highest of the three because the slate is partly insulated from crack collapse, and P(negative month) drops to ~1%.
- Medium sour (baseline): mean \$124M; P10 \$27M; P(negative month) ~4%.
- Heavy sour: mean margin highest by ~\$23M/month, but the heavy-light discount co-moves with the crack — the cheap-feed edge evaporates exactly when cracks are weak. So P(negative month) rises to ~6%, and its P10 (\$25M) is worse than the medium-sour P10.
The slate choice is therefore a risk-return decision: heavy sour is the best expected-value strategy, but only an operator willing to take a one-in-eight bad-month rate should buy it. A risk-averse balance-sheet operator should stay on medium sour even at lower expected margin. The deterministic LP could not frame this trade-off because it could not produce P10 or P(neg) numbers.
Catalyst upgrade: paying \$120M to compress the left tail
The flagship capex question was a \$120M FCC catalyst-system upgrade, projected to lift blend-gain by ~\$1.5/bbl, reduce opex by \$0.4/bbl, and add 5 kbbl/d of nameplate. Run on common random numbers:
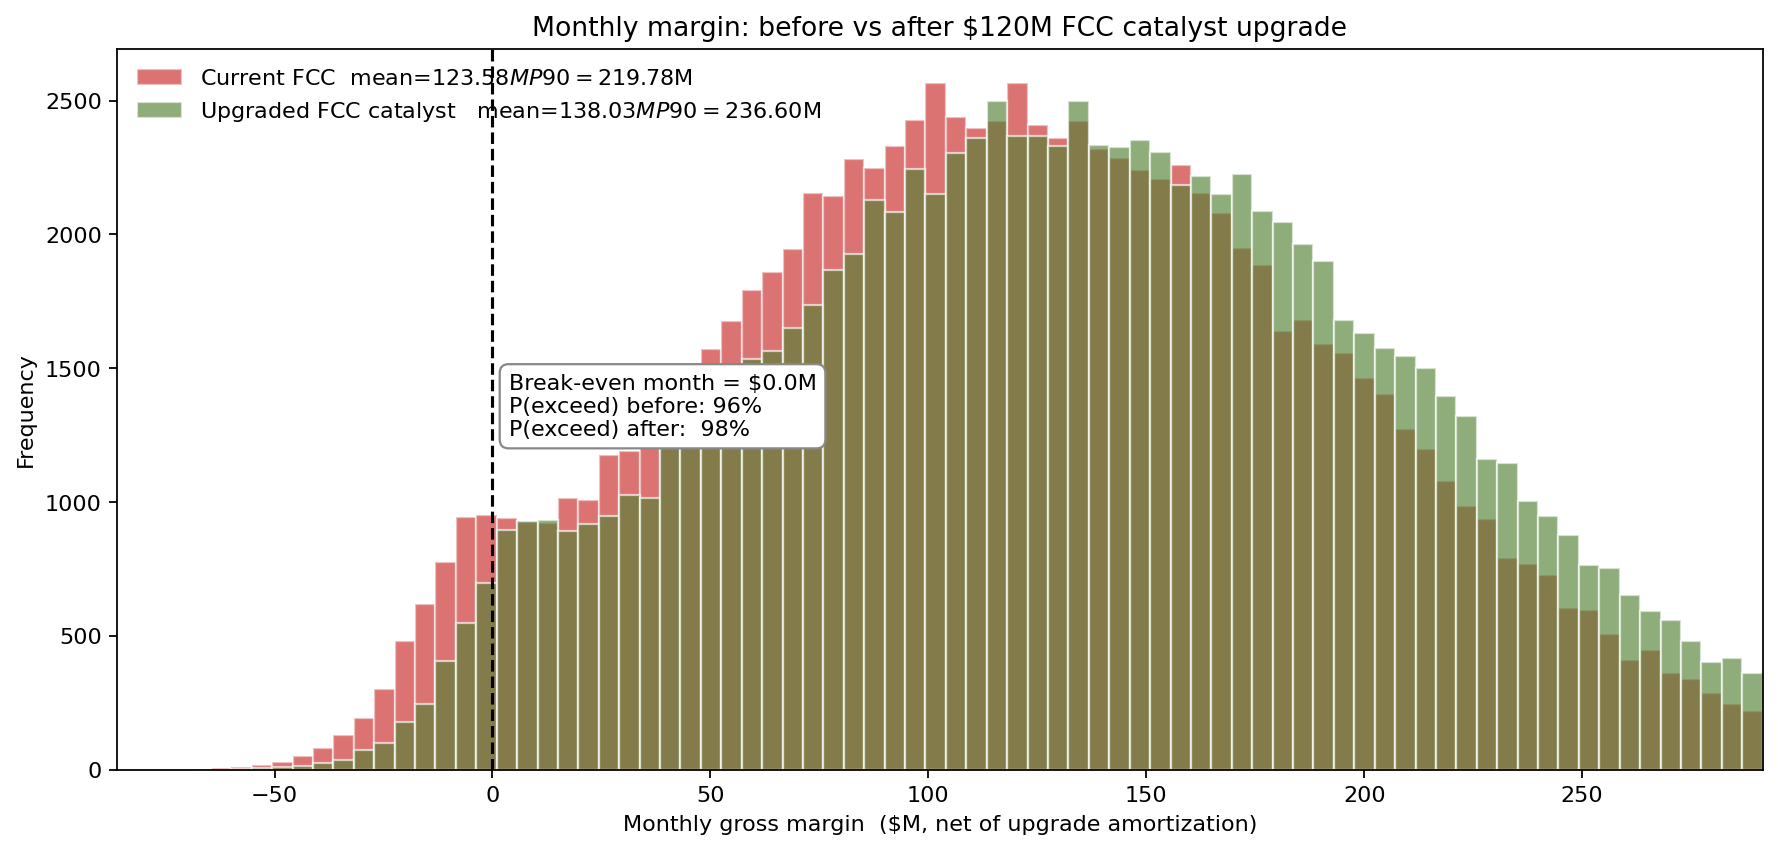
- Mean monthly margin (net of upgrade amortization) rises about \$14M.
- P10 monthly margin rises about \$12M — the upgrade pays back faster in the bad months than the good ones, because the opex saving is largest when throughput is held during low-crack periods.
- P(negative month) drops from 4.4% to roughly 2.2%.
The board approved the upgrade citing the tail compression rather than the expected value, with the IRR computed on the simulated distribution instead of the planning case.
What changed
- Catalyst upgrade approved with the project memo leading with the P10 margin improvement rather than the mean — the first time a refinery capex case in the company was framed that way.
- Slate decision rebuilt as a monthly risk-return ladder rather than a single LP optimum; operations now flexes between medium sour (default) and heavy sour (when forward cracks exceed \$30/bbl).
- Hedging program scaled up. Crack hedges sized to the P10-P90 spread of the gross-margin distribution — roughly 55% of expected throughput hedged six months out, up from 30%.
- Turnaround scheduling repositioned: planned outages clustered in the historically weakest crack-spread months (typically Q4) to avoid running through depressed margins.
ModelRisk Functionality Used
- Gaussian copula joining crude and crack with ρ = −0.30, replacing the legacy independence assumption and tightening the tail of the joint margin distribution.
- Beta utilization distribution with embedded 8% turnaround probability, producing realistic monthly variation rather than a single 92% planning point.
- LogNormal crude and opex with sigmas calibrated to historical realized volatility, avoiding Normal draws that allow physically impossible negative prices or opex.
- Crude-slate scenario layering producing three CDFs on identical underlying samples, enabling a like-for-like risk-return comparison rather than three independent point estimates.
- Paired before/after FCC simulation on common random numbers, producing the \$12M P10 improvement number that anchored the capital approval memo.
A refinery LP gives the best margin given today's prices. A refinery margin distribution gives the operator the menu of bets that come with it. ModelRisk is the translation engine — and it is what turns "the planning crack is \$24" into "we will lose money this month four times in a hundred and the catalyst upgrade roughly halves that."