

Industry: Oil and Gas Exploration
Product: ModelRisk
Application: Oil Spill Response Planning Under Uncertainty
When a Blowout Becomes a $5 Billion Question 87 Days Long
The Deepwater Horizon blowout released 4.9 million barrels over 87 days. The total bill — response, cleanup, fines, civil settlements — landed north of $65 billion, with the statutory Clean Water Act penalty alone at $4,300 per barrel of oil released. For an operator running deepwater wells today, an oil-spill response plan is not a regulatory checkbox; it is a probability distribution whose right tail can erase a decade of upstream margin in one quarter.
A deepwater operator with assets in the Gulf of Mexico, the North Sea, and Southeast Asia rebuilt its spill-response planning in ModelRisk after a deterministic "worst-credible" exercise pegged the response cost at a single point estimate of roughly $2.7B — a number the executive risk committee correctly suspected was the average of two very different futures, not the planning case. Run as a full distribution instead, the released-volume model that sits underneath that cost is heavily right-skewed, with a median release near 870,000 barrels and a tail that reaches the Deepwater Horizon scale:
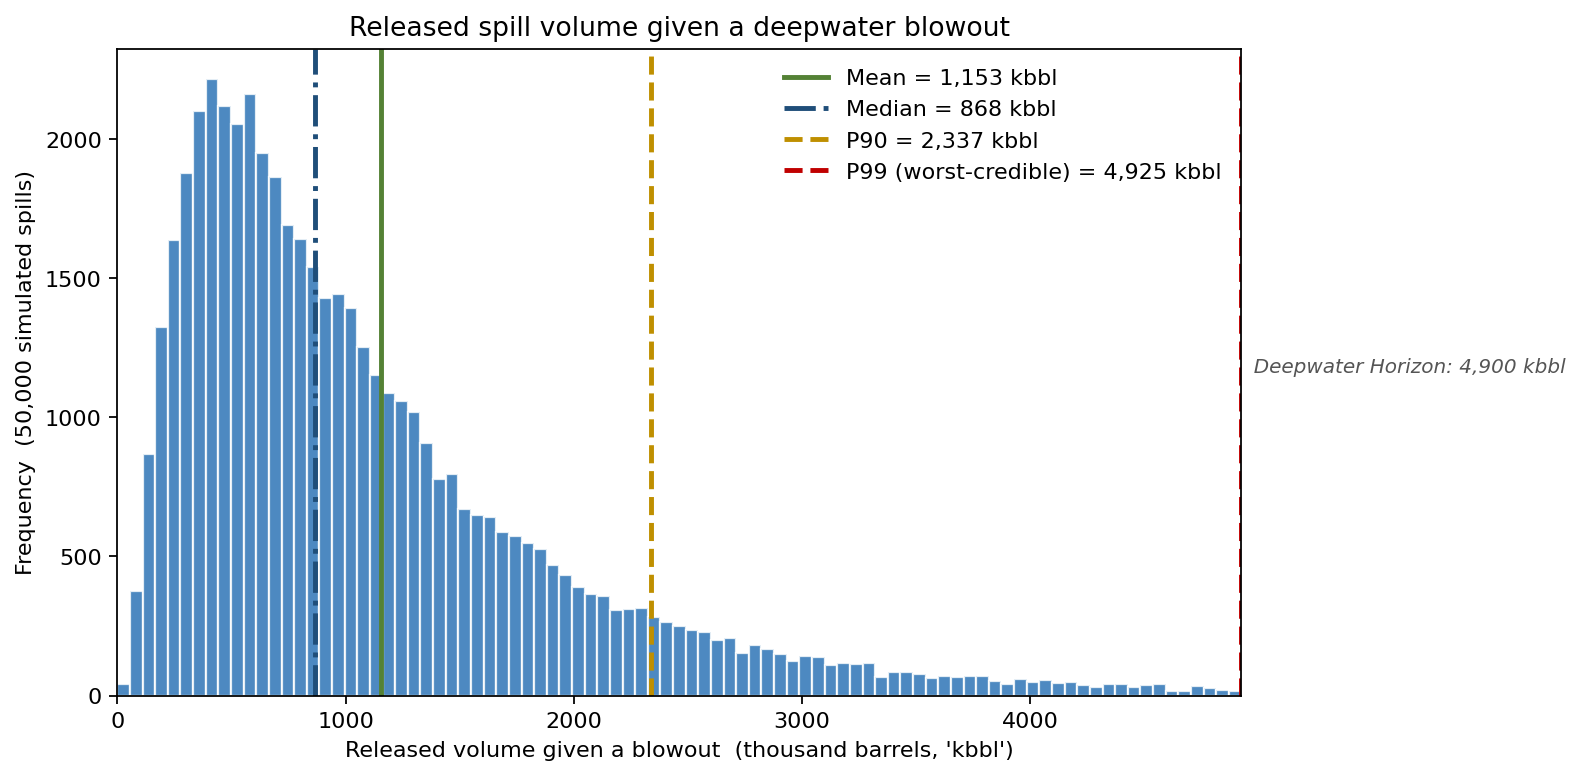
The median release is roughly 870,000 barrels, the P90 about 2.3 million barrels, and the P99 worst-credible release reaches 4.9 million barrels — squarely at the Deepwater Horizon outcome. The deterministic plan that used "expected" values term-by-term reported 600,000 bbl — a number that lives below even the simulated median and badly understates the tail the contingency budget actually needs to cover.
Three independent sources of spill-size uncertainty
The released volume given a blowout was modeled as:
\[ V = Q \times T \times (1 - E_c) \]
where each term is itself uncertain:
- Well flow rate \(Q\) — LogNormal, median 30,000 bbl/day, sigma 0.6 (matching the asymmetric distribution of historical deepwater blowout flow rates). LogNormal here, not Normal, because flow rate is bounded at zero and has a heavy right tail.
- Time to cap \(T\) — Triangular(5, 25, 90) days. The minimum reflects a best-case relief intervention; the mode reflects modern well-control timelines; the 90-day maximum is the Deepwater Horizon analog.
- Containment efficiency \(E_c\) — Beta(2, 8), mean 20%. Beta is the right choice for a fraction bounded on [0, 1]; using a Normal here, as some legacy plans do, allows draws of negative or >100% efficiency.
The released volume distribution that falls out of these three terms is the heavily right-skewed shape shown above — a long body and a tail that runs to the Deepwater Horizon scale.
From volume to dollars
Each barrel released triggers four cost lines: response (\$0.5M/day fixed plus capture handling), cleanup (\$80/bbl industry average), environmental damage (LogNormal-scaled to volume), and the statutory \$4,300/bbl Clean Water Act penalty. Multiplying through the volume distribution gives the total cost distribution:
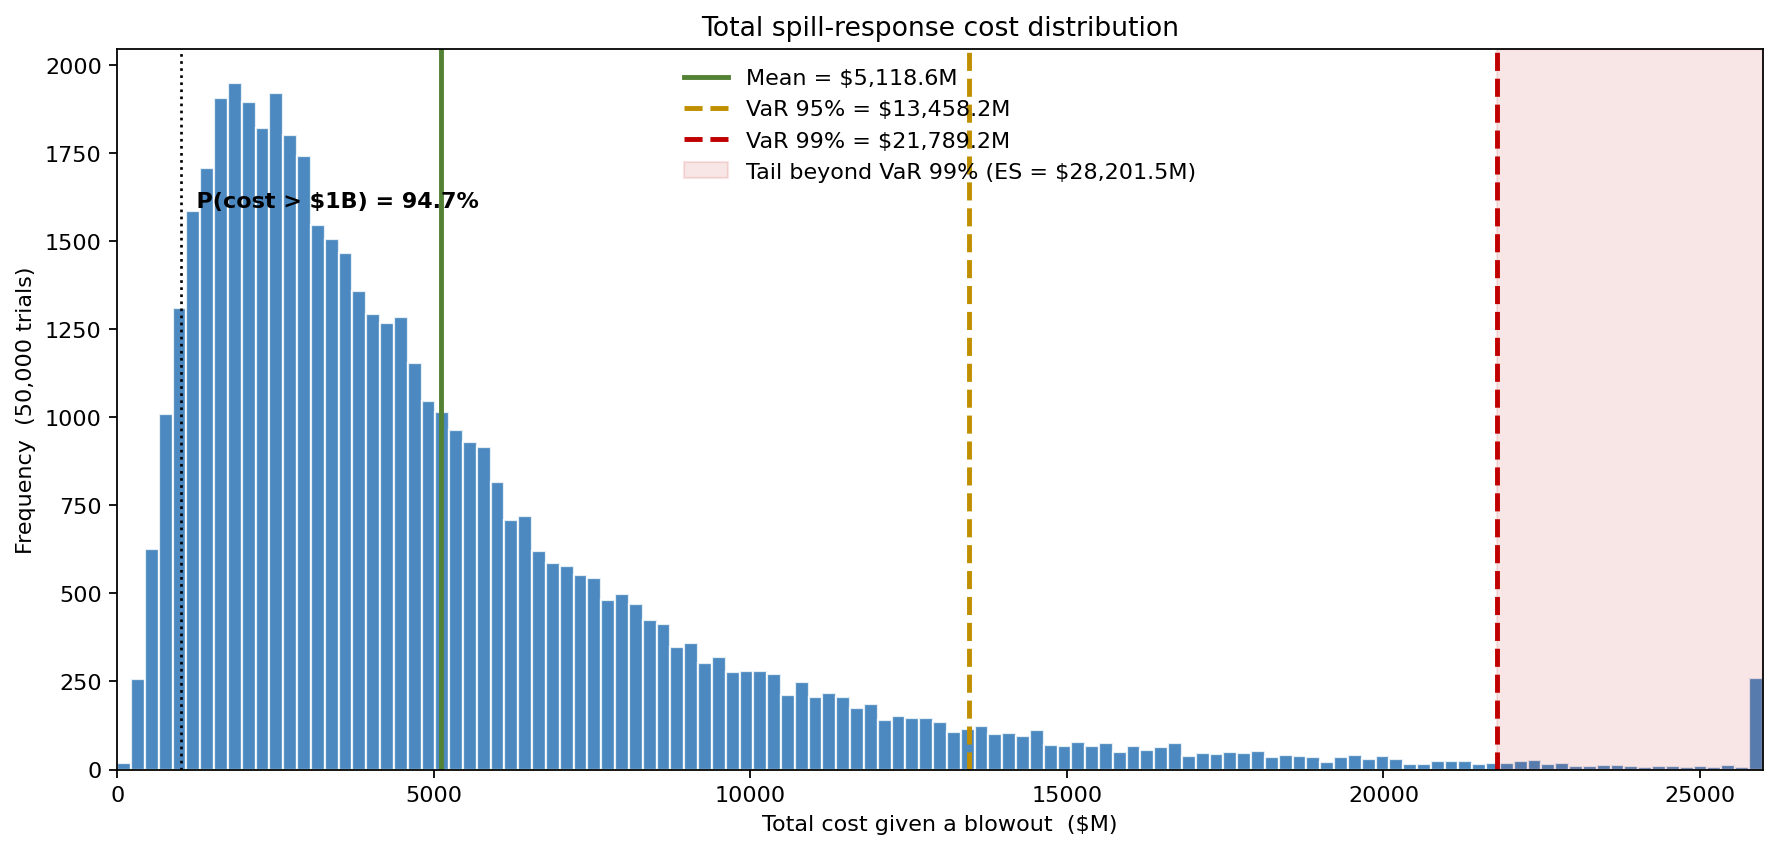
The deterministic point estimate of \$2.7B sits below the median of \$3.9B. The mean is dominated by the right tail at roughly \$5.1B, the VaR 95% sits near \$13.5B, and the probability of a billion-dollar-plus event is 95% conditional on a blowout occurring. The statutory penalty alone — \$4,300/bbl times the P90 release — is about \$10B. A contingency reserve sized on the deterministic number leaves the operator solvent in fewer than half of plausible futures.
What drives the cost the most
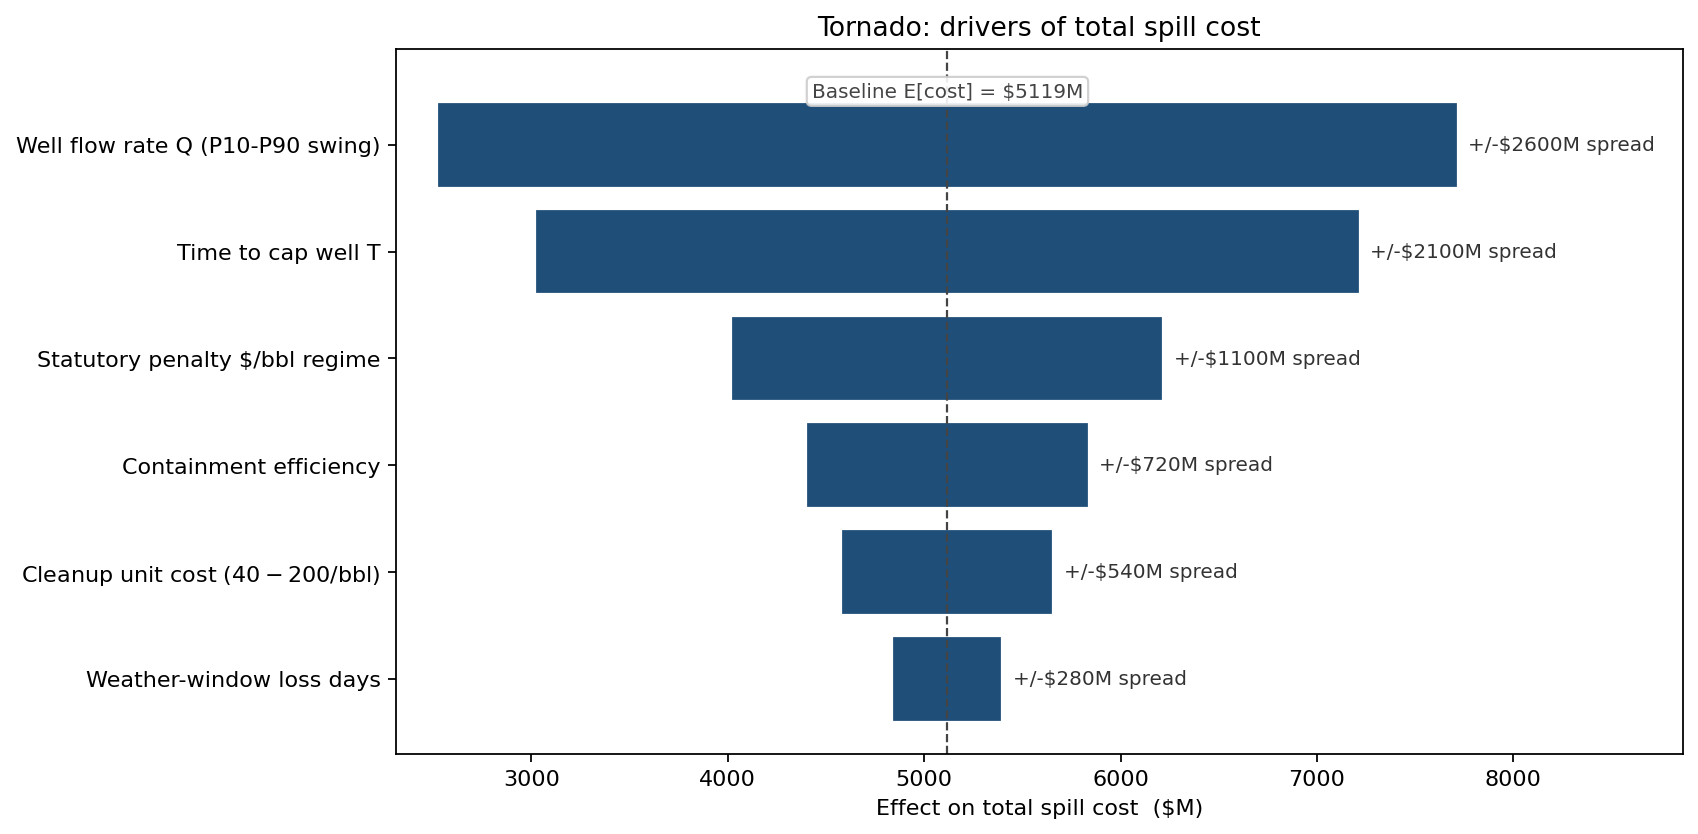
Well flow rate and time-to-cap dominate the P10-P90 spread of total cost — each contributing more than \$2B of swing — because both feed multiplicatively into the volume term. The statutory penalty regime is the third-largest driver, which made the case for engaging proactively in policy discussions about per-barrel fine ceilings. Containment efficiency and cleanup unit cost are second-order: shaving five days off the response timeline saves roughly five times what a 5% containment-efficiency gain saves.
Pre-positioned cap-stack: where the money pays back
The headline mitigation decision was whether to fund a \$40M/year shared cap-stack program at a regional hub. The program cuts the modal time-to-cap from 25 days to 12 days. Re-running the simulation with the faster response distribution gives:
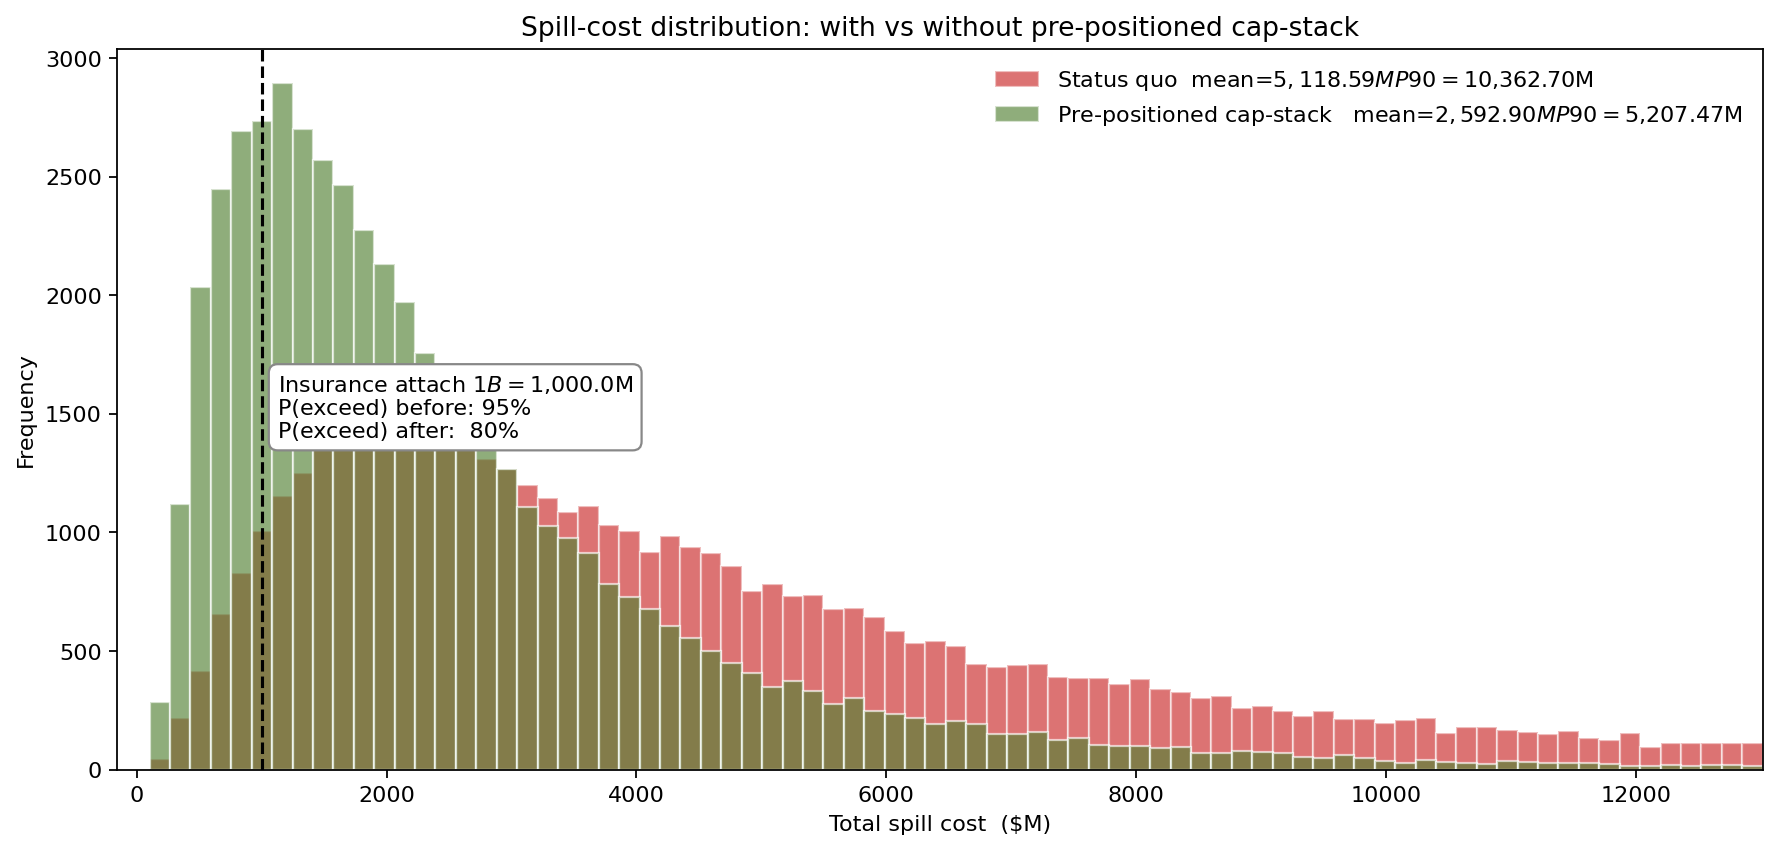
- Mean total cost falls from \$5.1B to roughly \$2.6B — a \$2.5B expected-loss reduction.
- P90 cost drops from roughly \$10.4B to roughly \$5.2B.
- Probability of exceeding the \$1B insurance attachment falls from 95% to 80%.
Discounted over the program lifetime, the cap-stack pays back in well under one credible-blowout event — which is the calculation the deterministic comparison could not produce because it had no probability of a blowout to begin with.
What changed
- Funded the regional cap-stack program on the strength of the expected-loss reduction, with the board minute citing the P90-to-P90 change rather than the mean.
- Increased pollution-liability cover from \$2B to \$5B attachment, sized to the P90 of the with-mitigation distribution.
- Drilling-schedule sequencing in the Gulf reordered so that two hurricane-season campaigns moved into November-March windows — directly cutting the weather-loss days input to the cost stack.
- Joint-industry data pool that the operator joined as a paying member, specifically to tighten the flow-rate distribution which the tornado identified as the single largest spend-to-reduce-variance opportunity.
ModelRisk Functionality Used
- Multiplicative volume model \(V = Q \cdot T \cdot (1 - E_c)\) sampled with three distinct distributions per trial, producing the heavy-right-skew volume PDF rather than a Normal approximation.
- Beta distributions for containment efficiency so that simulated draws are bounded on [0, 1], avoiding the legacy-model artifact of negative or super-100% efficiency.
- LogNormal flow-rate fits to historical blowout records from the BSEE and IOGP databases, including a sensitivity to the 2010-2024 subset.
- Tornado analysis ranking the six cost drivers, identifying flow-rate and time-to-cap as accounting for >70% of P10-P90 spread — directing the mitigation budget.
- Before/after scenario comparison of the cap-stack program against status-quo response, with both arms run on identical 50,000-trial samples so the comparison is paired (common random numbers).
A contingency plan written against the average spill protects the operator against the average spill. The blowouts that show up in the press are not average. ModelRisk's distribution of cost outcomes is what tells a deepwater operator how much reserve, how much insurance, and how much pre-positioned equipment is needed to survive the tail that one day actually appears.