

Industry: Oil and Gas Exploration
Product: ModelRisk
Application: Oil Price Forecasting
When a Flat $72 Forecast Hides a 26% Probability of Project Loss
A flat price deck draws one line. The future draws a fan. The chart below shows the same WTI starting mark — $72/bbl — propagated forward five years as 50,000 simulated price paths: the median, the P25–P75 band, and the P10–P90 envelope, against the dashed flat-$72 line the capital plan actually used.
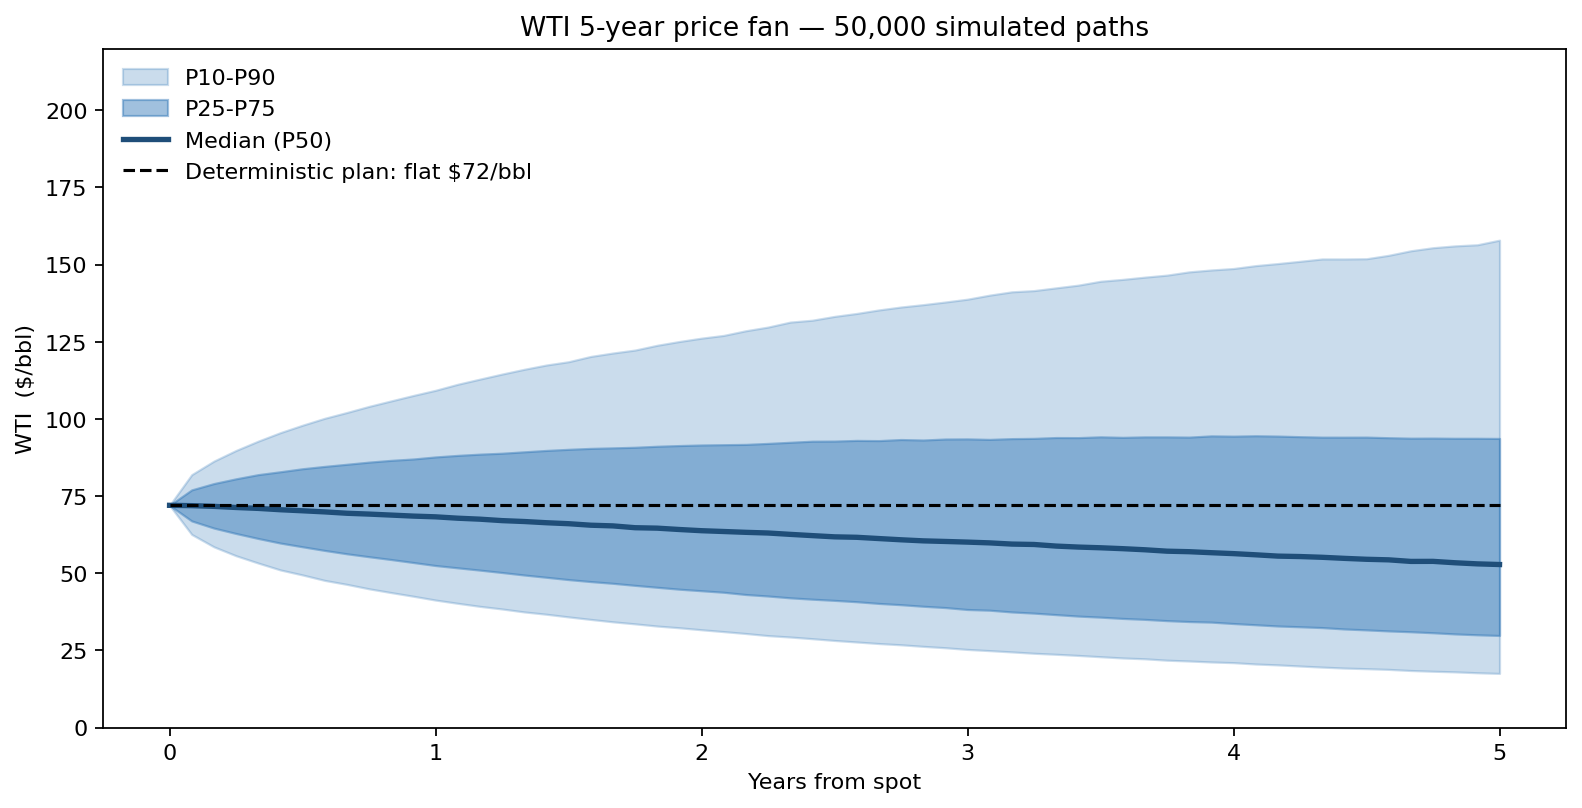
By year five the P10–P90 band runs from roughly $18 to $158. The mean tracks the long-run trend near $72, but the median drifts into the mid-$50s as the negative-skewed jump and demand-shock components pull the body of the distribution below the headline number. None of that asymmetry is visible in the flat line — and it is exactly the asymmetry that decides whether a $1.5 billion deepwater development creates value or destroys it.
A North American IOC rebuilt its long-term price view in ModelRisk after a deterministic $72/bbl deck cleared a Gulf-of-Mexico project that the probabilistic re-run showed had a 26% chance of negative NPV. The mandate from the CFO: every project economics submission to the capital committee from then on would carry a full price distribution and a P10 NPV, not just a base case.
Why plain GBM is not enough
The textbook Geometric Brownian Motion model — \( dP = \mu P \, dt + \sigma P \, dW \) — captures the diffusive component of price moves, but oil prices do not diffuse smoothly. They jump on OPEC headlines, gap on geopolitical shocks, and occasionally collapse for two years on a demand recession. A pure GBM calibrated to 35% annualized volatility understates the left tail and overstates the central tendency.
The model the team built layered three processes on top of the GBM core:
Jumps. OPEC announcements and supply-side shocks were modeled as a Poisson process with rate \(\lambda = 0.6\) per year, with jump magnitude drawn from a Normal distribution with mean \(-15\%\) and standard deviation \(12\%\) — a negative-skewed jump distribution that matches the asymmetry of historical announcement-day moves.
Demand-shock regime. A 4% annual probability of entering a sustained recession state was added — calibrated to the empirical frequency of major demand collapses (2008, 2020). Once triggered after month 6, the regime adds a slow \(-4\%\)/year drag for the remainder of the horizon.
Energy-transition scenarios. Three discrete macro paths — accelerated transition, base, and tight-supply — bracket the long-run drift, with weights set by the strategy team's house view.
One year out: where the next budget actually lives
The 12-month forward distribution from 50,000 paths is the input the corporate planning team needs for the annual budget:
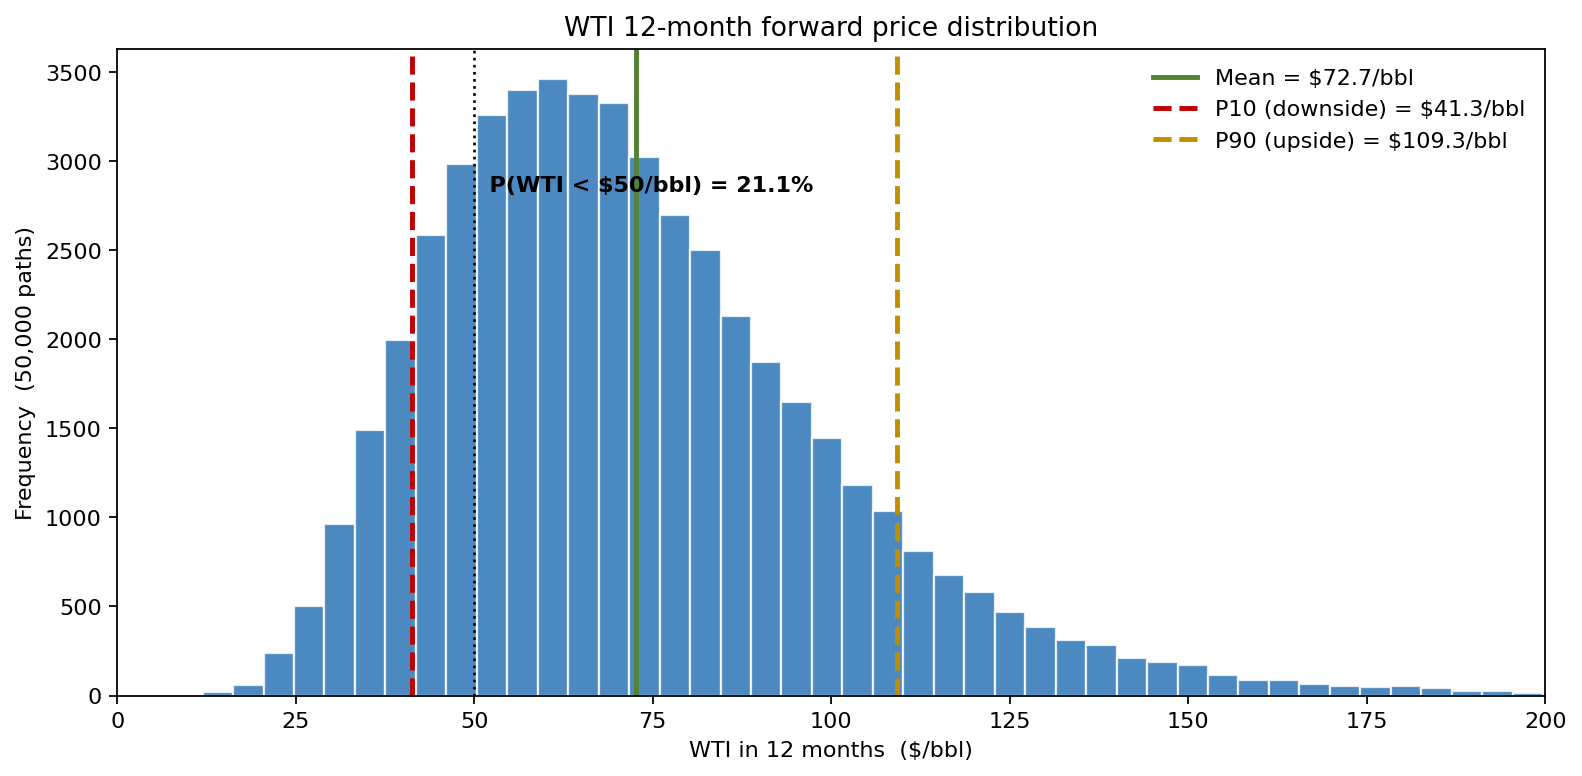
The deterministic plan held WTI flat at $72/bbl. The simulation puts the P10 around $41 and the P90 around $109 — a 68-dollar interquantile range that the point estimate hides entirely. The probability of WTI trading below $50/bbl at the one-year horizon is roughly 21% — too large to be waved away in a base case, and large enough to make hedging cheap insurance.
Five years out: the fan is wider than the boardroom thinks
By year five the P10–P90 fan has opened from $41–$109 at the one-year horizon to roughly $18–$158, as the opening chart shows. The mean holds near $72 but the median drifts to the mid-$50s, and the distribution is what matters when discounting a 25-year cashflow stream. Two consequences fall out of this fan that the deterministic deck never produced. First, the P10 strip is below most of the company's heavy-oil-sands break-evens, which moved three projects from "go" to "defer." Second, the P90 strip would make a fast-cycle Permian acquisition immediately accretive — which created a real-options case for keeping dry powder.
Project NPV under three macro scenarios
The price model fed directly into project economics. For a \$1.5B deepwater development producing 50 MMbbl over five years at \$10/bbl opex and a 10% discount rate:
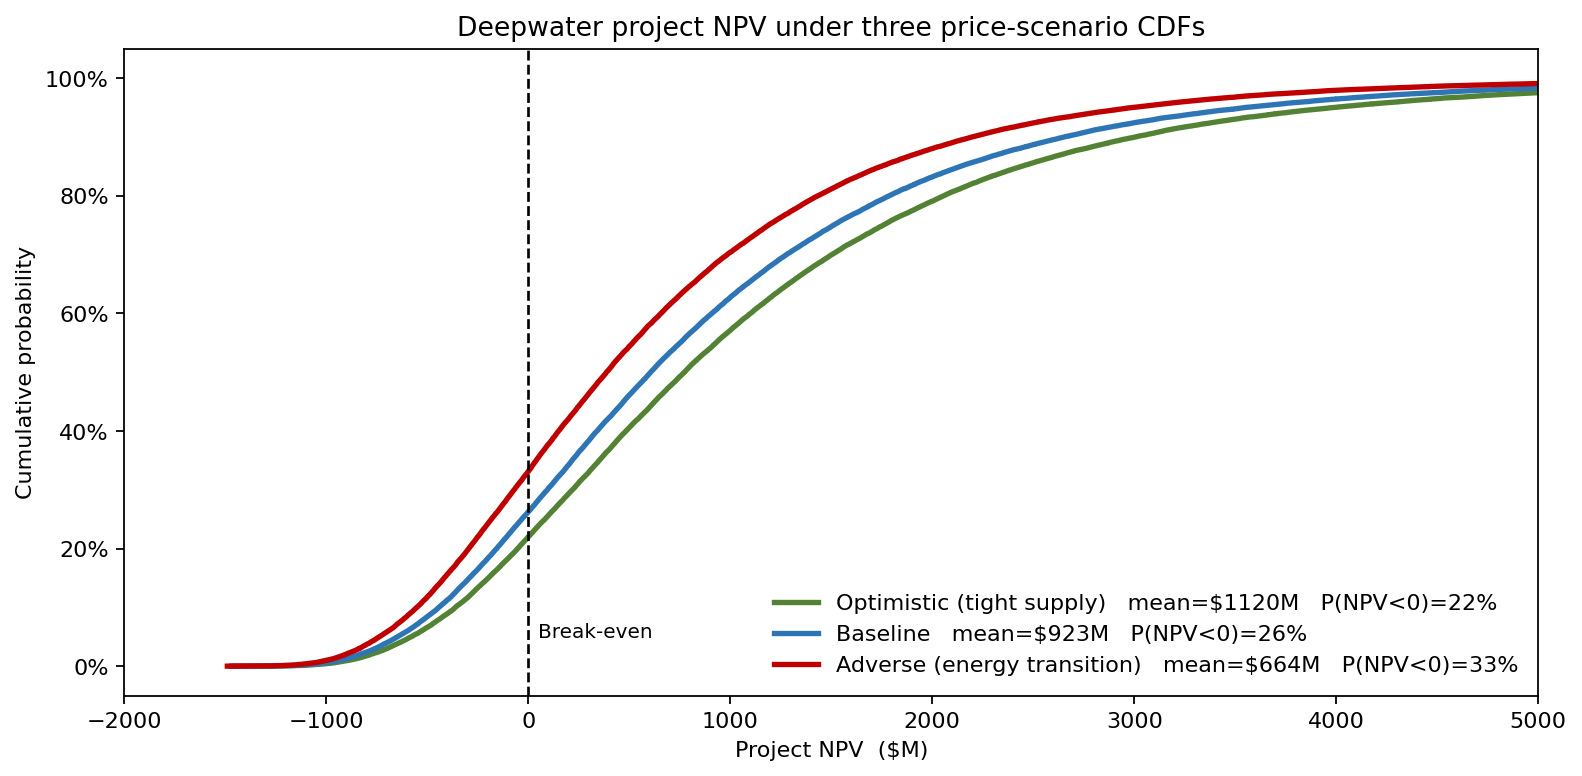
The deterministic NPV at \$72 flat was a comfortable \$2.1 billion. The probabilistic re-run revealed:
- Baseline scenario: mean NPV \$923M, but P(NPV < 0) = 26%.
- Adverse (energy transition): mean NPV \$664M, P(NPV<0) climbs to 33%.
- Optimistic (tight supply): mean NPV \$1.12B, still with P(NPV < 0) = 22%.
The deterministic answer that "the project clears the hurdle" was true on average and false in roughly a quarter of futures. That quarter is the conversation the capital committee needed to have.
What actually moves the NPV number
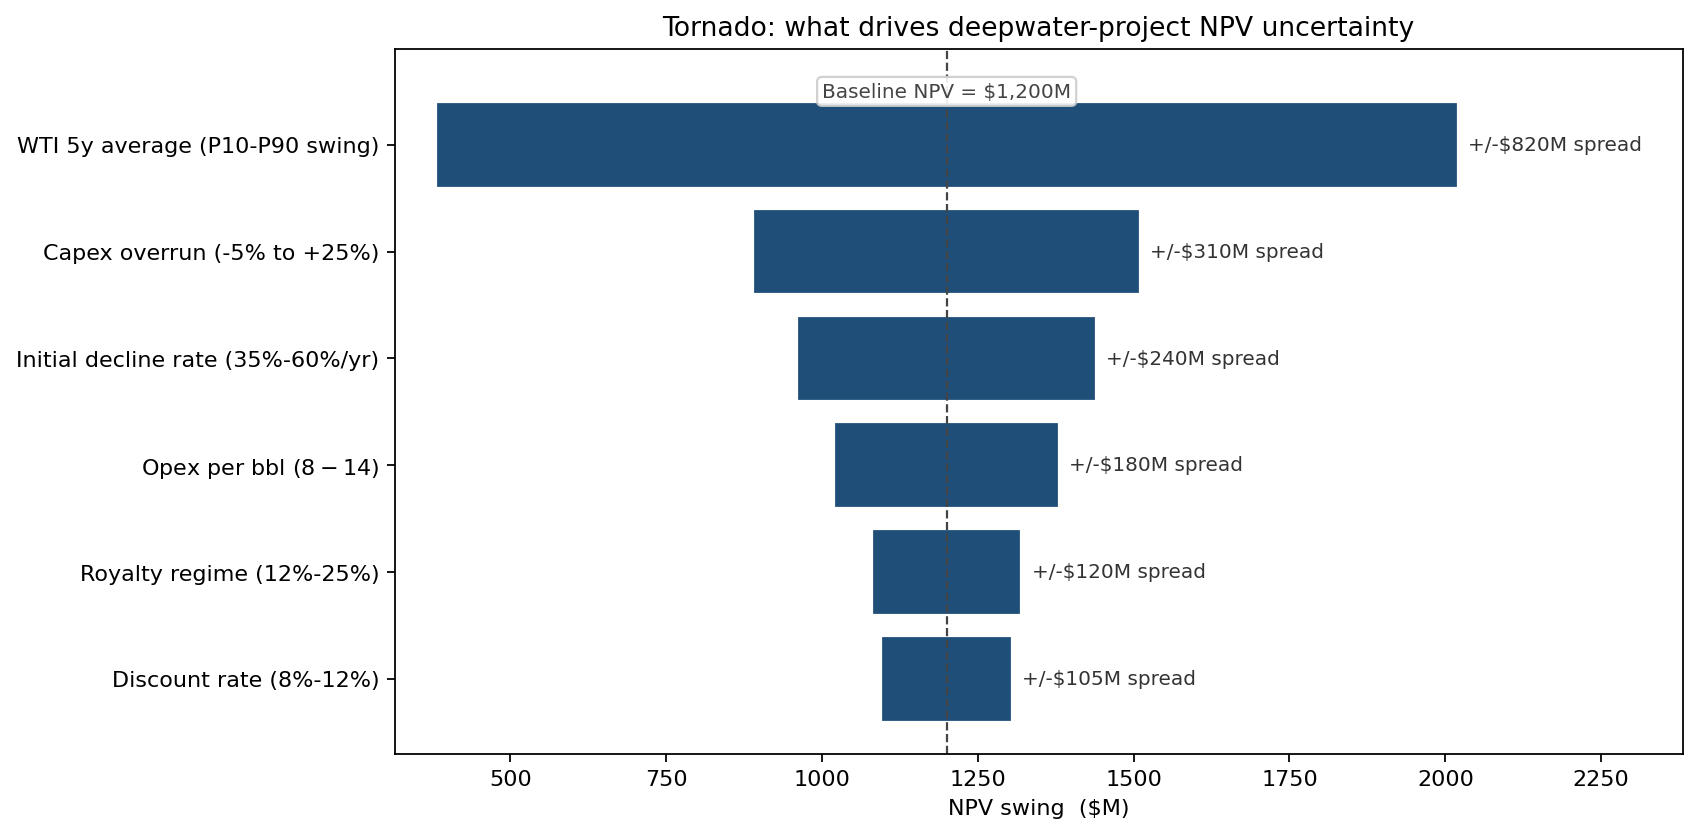
The price swing dominates — the WTI five-year average is the single largest bar, contributing a ±$410M swing and roughly 46% of the combined driver spread. Capex overruns and initial decline rate come next, with opex and royalty regimes as second-order. The ranking told the project team where to spend the next dollar of de-risking work: a fixed-price drilling contract closes more NPV variance per dollar than another month of subsurface modeling.
What changed
- Three deferrals. Two heavy-oil-sands projects and one West African brownfield expansion were pushed back after their P10 NPVs failed the new hurdle.
- Hedge ratio raised from 25% to 45% of next-year production, based on the 21% probability of WTI below \$50/bbl and the cost of put protection at that strike.
- Capital committee process rewritten. Every project memo now carries the P10/P50/P90 NPV table on page one; the deterministic NPV is a footnote.
- Strategic options budget created. A \$300M dry-powder allocation was funded specifically to acquire fast-cycle Permian assets if the P10 of the price fan is breached.
ModelRisk Functionality Used
- Jump-diffusion price-path generation with Poisson OPEC-shock jumps and a regime-switching demand-recession state, calibrated to 124 months of WTI front-month history.
- Copula-linked drivers — WTI drift, US natgas, and the dollar index were joined with a Gaussian copula so that adverse-scenario paths correlated realistically across markets.
- Project-NPV simulation that fed each price path through a per-year production schedule and discount calculation, producing a 50,000-trial NPV distribution per project.
- Tornado ranking on NPV which assigned the price-fan width roughly 46% of the combined driver spread, capex 17%, and the remaining drivers below that — directing the de-risking workplan.
- Scenario layering to compose energy-transition, baseline, and tight-supply paths on top of the same stochastic engine, so the three CDFs are directly comparable.
The boardroom version of an oil price forecast is a number; the planning version is a distribution. ModelRisk is what turns "we expect $72 oil" into "we will lose money in roughly one future in four at this capex level" — and that is the sentence that changes a capital decision.