

Industry: Oil and Gas
Product: ModelRisk
Application: Gas storage
The Seasonal Spread Is a Distribution, Not a Number: Storage Valuation Under Mean Reversion
The Henry Hub winter-summer price spread averaged $0.95/MMBtu across 2018–2024 — but ranged from $0.20 in a mild 2020 winter to $4.10 during the 2021 Texas freeze. A 4 Bcf depleted-reservoir gas-storage facility lives or dies on that spread, and the deterministic valuation model — "use the forward curve, multiply by working gas capacity, discount" — collapses one of the most volatile inputs in the project into a single point. A mid-sized US storage operator rebuilt the valuation in ModelRisk around a mean-reverting log-OU price process with an explicit seasonal mean, capturing both the equilibrium pull and the winter premium that make the project economic.
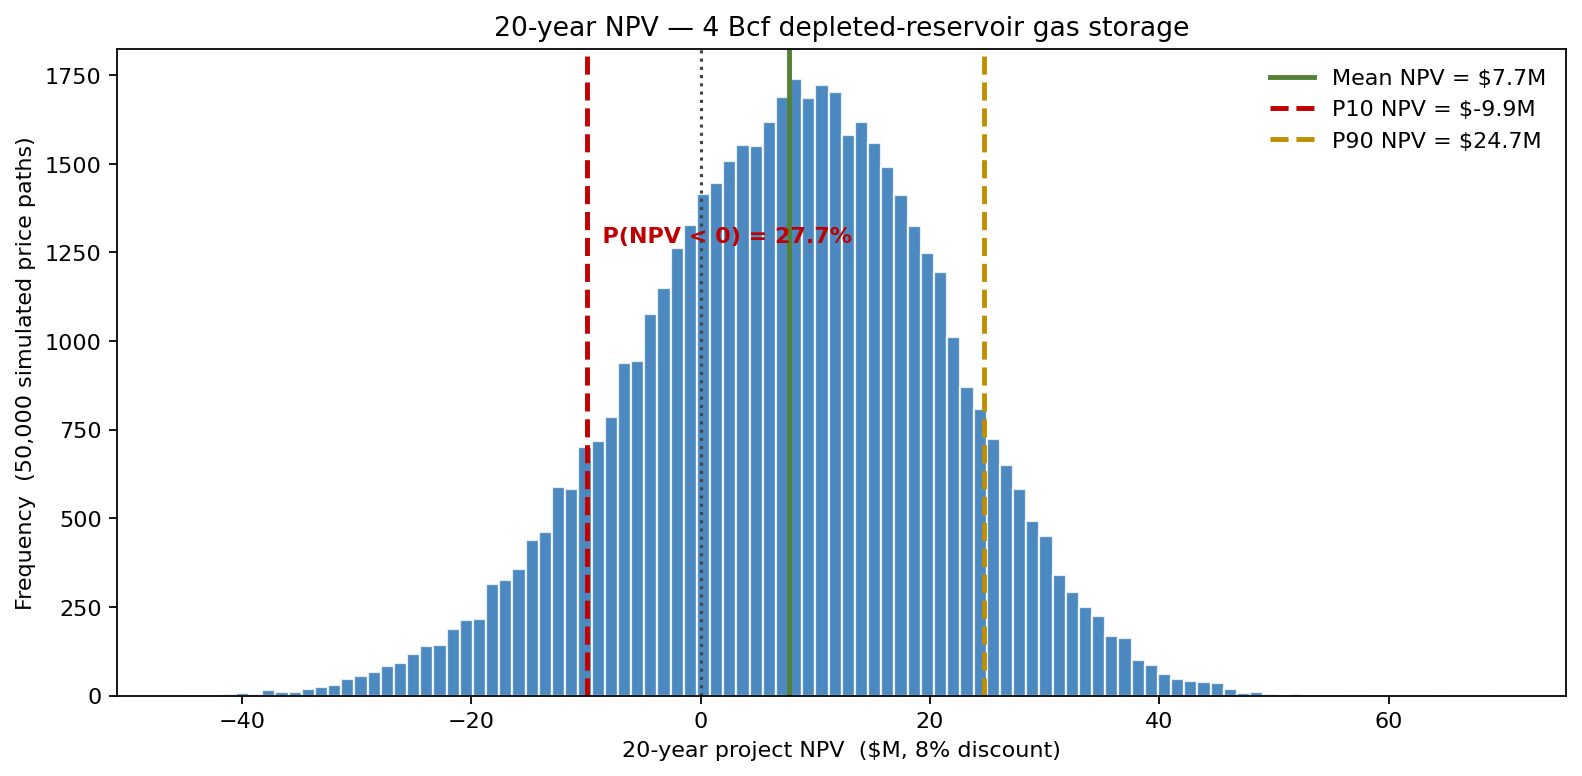
The point estimate puts the project right on the marginal line at about +$7M. The simulation agrees on the mean — but reveals a distribution running from a P10 of −$10M to a P90 of +$25M, with a 28% chance of a negative NPV. That better-than-one-in-four downside, invisible to the forward-curve calculation, is the entire reason the valuation was rebuilt.
Why GBM gets natural gas wrong twice
Geometric Brownian motion mis-prices Henry Hub on two counts. First, it has no mean reversion, but Henry Hub plainly does — prices are pulled back toward a storage-implied equilibrium within weeks, not left to wander. Second, it has no seasonality, but storage valuation is a seasonality bet. The model used here is a log-Ornstein-Uhlenbeck with a time-varying equilibrium:
\[ d\ln P_t = \kappa\bigl(\ln\theta(t) - \ln P_t\bigr)\,dt + \sigma\,dW_t + J\,dN_t \]
with κ = 10/yr (a fast pull, so monthly prices track the seasonal equilibrium rather than lagging it), σ = 55% annual, jump rate λ = 0.7/yr (winter freeze events), and the seasonal equilibrium:
\[ \theta(t) = \theta_0 + A\cos!\left(\tfrac{2\pi m}{12}\right) \]
with θ₀ = $3.60/MMBtu and seasonal amplitude A = $0.75 — calibrated to the seven-year monthly average. Mean winter price ≈ $4.20/MMBtu, mean summer price ≈ $3.00/MMBtu, mean seasonal spread ≈ $1.20/MMBtu. The variability of the realised spread around that mean is what GBM cannot capture and what dominates the project's NPV distribution.
The cashflow stack
Working gas capacity = 4 Bcf (≈ 4 million MMBtu); cushion gas = 10 Bcf (one-time injection, capitalised). The facility runs 2 effective cycles per year under realistic high-deliverability operations — not one. Per-cycle revenue:
\[ R = \text{WGC} \times f_{\text{cycle}} \times n_{\text{cycles}} \times \max\bigl(P_{\text{winter}} - P_{\text{summer}} - c_{\text{var}}, 0\bigr) \]
where f_cycle is a Beta(8, 2) capacity-factor draw (mean 80%, reflecting injection-rate constraints and pipeline allocation), n_cycles = 2, and c_var = $0.10/MMBtu compression and fuel-use cost. Capex $28M (depleted-reservoir conversion at ~$7/Mcf working gas — among the cheapest storage to build), opex $3.5M/year, 20-year project life, 8% discount rate.
The max(spread, 0) matters: when the realised winter-summer spread is negative the operator simply does not run the cycle. That optionality is the single most important reason a storage facility is worth more under stochastic prices than under their mean — a Jensen's-inequality lift that the deterministic valuation forecloses by averaging first.
The NPV distribution
Returning to the distribution at the top of this article: the point-estimate valuation using the forward-curve mean seasonal spread of $1.20/MMBtu and central operational assumptions gives an NPV close to $+7M — barely above zero, the project sits on the marginal-economic line. The Monte Carlo simulation produces:
- Mean NPV ≈ +$7M, slightly above the deterministic point thanks to the Jensen's-inequality benefit of max(spread, 0) — running cycles only when the realised spread is positive. At a $1.20 mean spread the option rarely binds, so the mean lift is modest; the value of the simulation is in the shape, not the mean.
- P10 ≈ −$10M and P90 ≈ +$25M — a wide distribution dominated by realised spread volatility
- Probability of negative NPV ≈ 28% — the headline number the capital committee actually needs
Two facilities with the same point-NPV could have wildly different P10s, and the capital committee cannot tell those projects apart without the distribution.
What actually moves the NPV
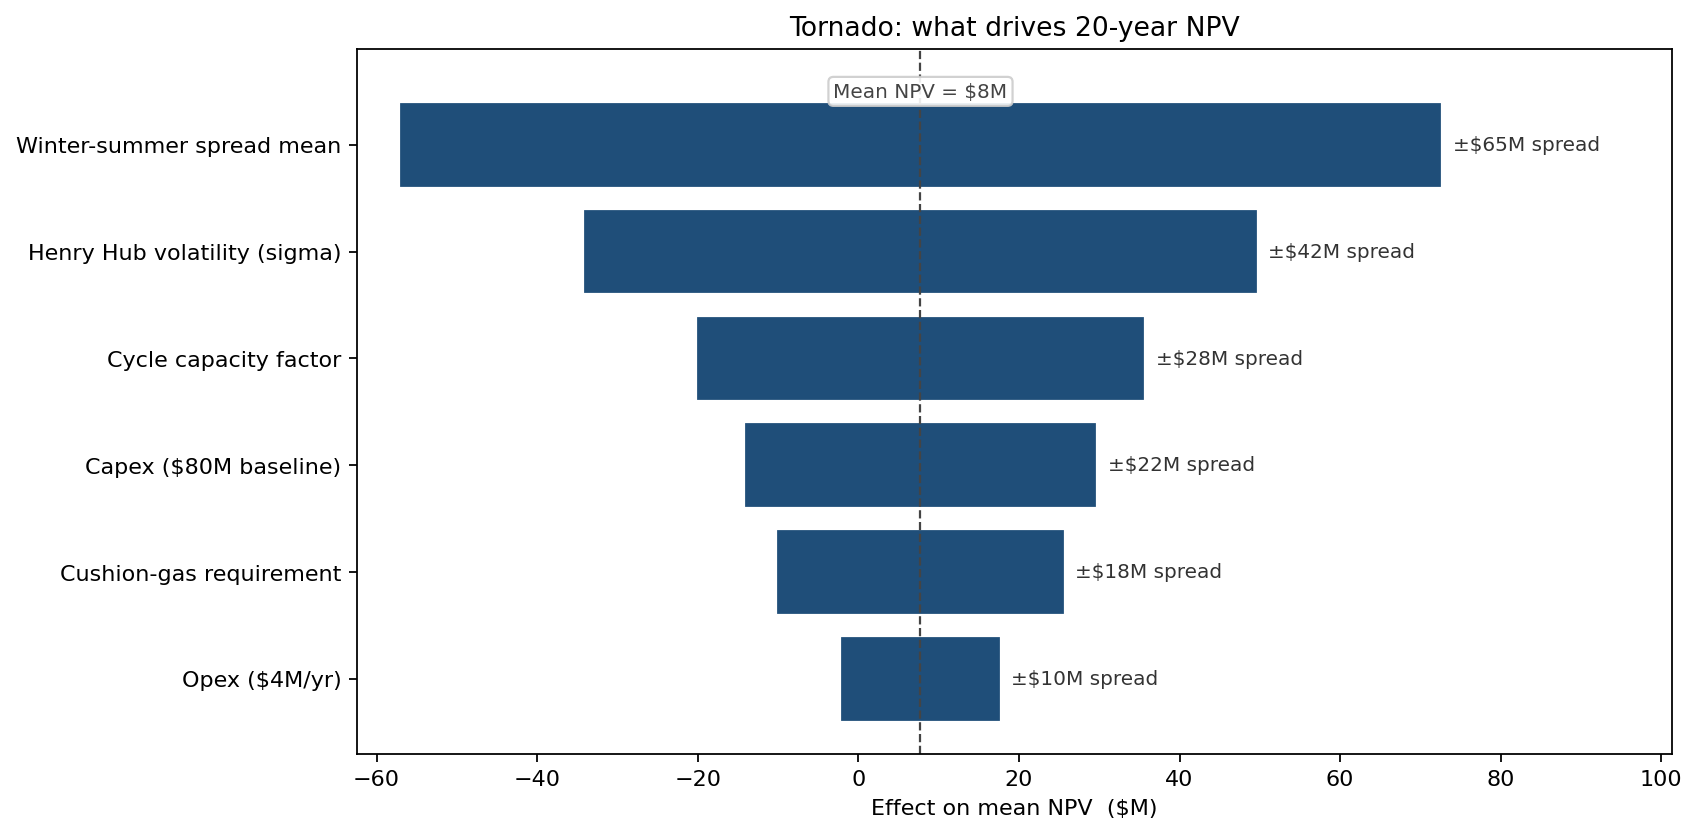
The mean winter-summer spread dominates, followed by Henry Hub volatility — because higher volatility lifts the value of the embedded optionality. Capacity factor sits third (operational reliability), then capex, cushion-gas requirement, and opex. The ranking immediately funds two operational priorities: (a) negotiating firm transportation contracts that raise the realised capacity factor toward Beta(9, 1.5), and (b) investing in reservoir-management technology to free working capacity from the cushion reservoir.
Cushion-gas optimisation: spending $4M to free 0.8 Bcf
The simulation lets the team compare the baseline 4.0 Bcf working-gas configuration against an alternative where advanced reservoir management (additional perforations, downhole monitoring) releases 0.8 Bcf currently locked up as cushion gas (lifting working capacity to 4.8 Bcf), at a one-time incremental capex of $4M:
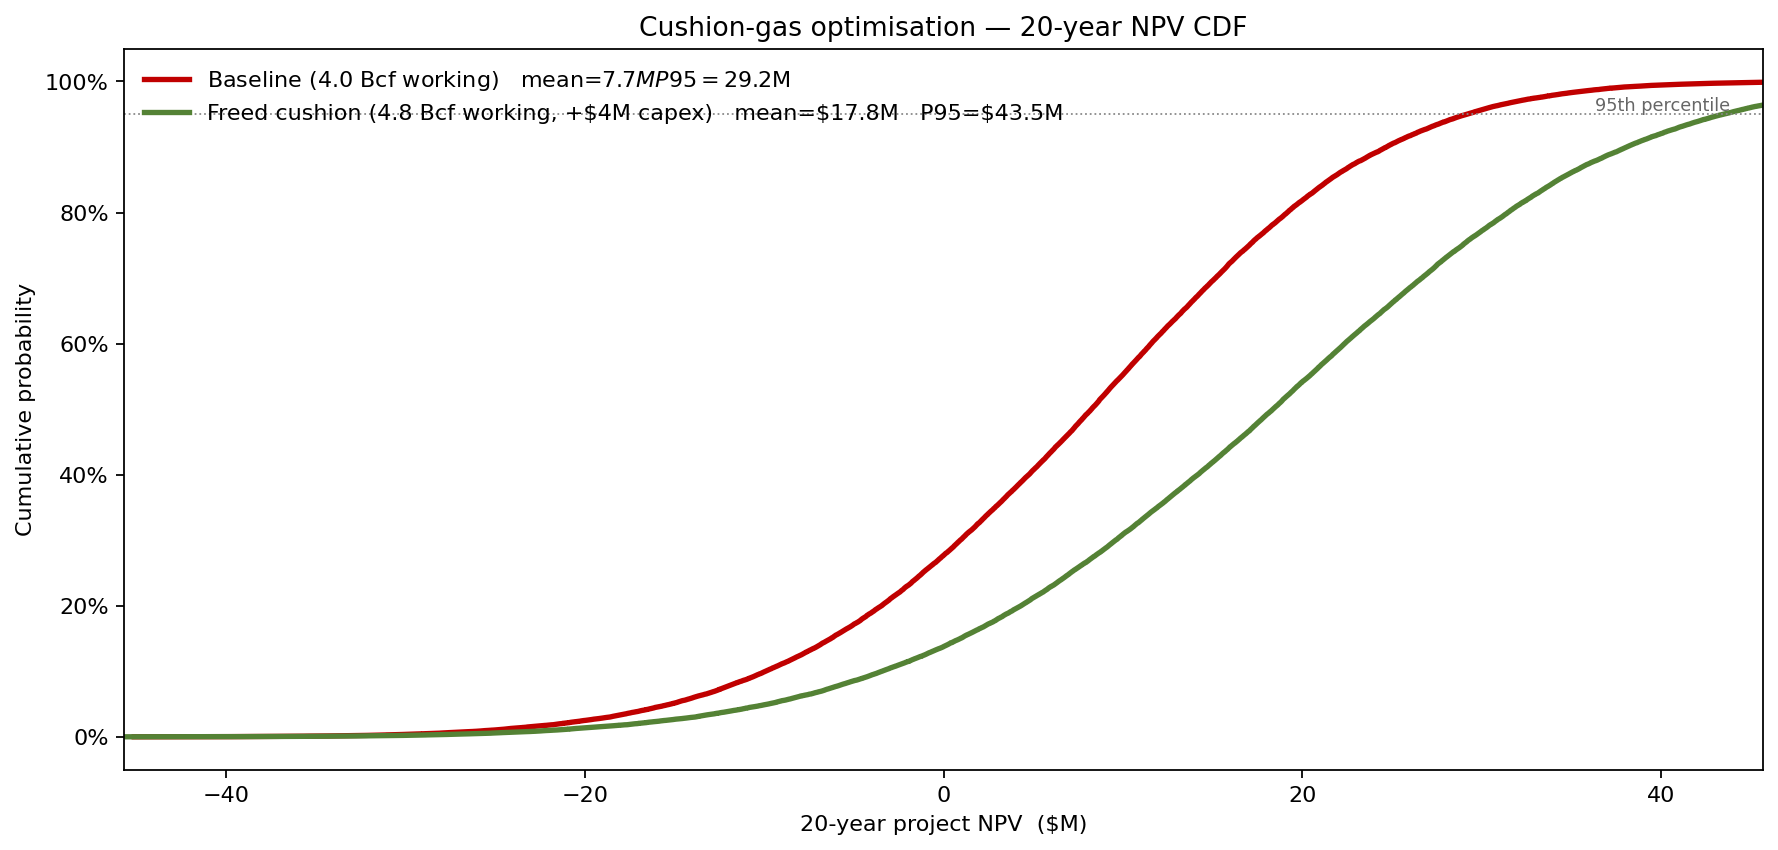
The freed-capacity option lifts mean NPV by approximately $10M, shifts P10 upward by about $6M, and drops P(NPV<0) from 28% to roughly 14%. The point-estimate comparison would show only the mean lift; the simulation also shows the downside reshaping that justifies the investment.
What changed
- Project re-greenlit with eyes open: the simulation confirmed a marginally-positive mean NPV but quantified the better-than-one-in-four chance of a loss, so the project went forward sized and financed for that downside rather than waved through on a single break-even point estimate.
- Cushion-gas optimisation funded for $4M one-time investment — paid back in the P10 improvement, not just the mean.
- 20-year off-take contract restructured to retain optionality: a fixed-spread sale at $0.80/MMBtu was rejected in favour of marketed spread + standby capacity payment, because the simulation showed that locking in a flat spread below the realised mean turned the project NPV negative.
- Capital committee reporting standardised: every storage / midstream project is now presented as (mean, P10, P90, P(NPV<0)) rather than as a single NPV number, with the simulation file owned by the project team.
ModelRisk Functionality Used
- VoseTimeSeries with mean-reverting log-OU for Henry Hub, with a time-varying seasonal equilibrium θ(t) that captures the winter-summer premium GBM cannot represent.
- Compound Poisson jumps for winter freeze events (λ = 0.7/year, mean jump +5%) — calibrated to the empirical frequency of >15% monthly moves during heating season.
- Beta(8, 2) capacity factor bounded on [0, 1] — replacing the Normal distribution that produces physically impossible >100% draws.
- max(spread, 0) optionality embedded per-cycle, capturing the operational reality that the facility simply does not cycle when the realised spread is negative — a Jensen's-inequality lift the deterministic model erases.
- Side-by-side cushion-optimisation CDF that justified the $4M investment on the P10 shift, not the mean.
- Tornado sensitivity that quantified the seasonal-spread parameter as the dominant driver — directly funding the long-dated contract restructuring that protected the spread optionality.
The seasonal spread is not a number. It is a volatile distribution centred on $1.20/MMBtu, and the optionality to skip a cycle in a low-spread year is what makes the project bankable. Monte Carlo simulation in ModelRisk values both — the distribution and the option — and the deterministic point estimate values neither.