

Industry: Oil and Gas
Product: ModelRisk
Application: Environmental impact
When 60% of Years See Zero Spills and 1% Cost $270M: Probabilistic Spill Liability
Deepwater Horizon released 4.9 million barrels of oil and ultimately cost BP over $65 billion in cleanup, settlements, and fines — and the deterministic spill-risk model in use at the time gave it a probability so small that the response capability was sized to handle 200,000 barrels per day, a number Macondo blew through in hours. For a 40-well portfolio spread across Arctic prospects and Gulf of Mexico deepwater, the operator's environmental liability is exactly the shape of statistical problem that deterministic averages get most wrong: the modal year sees zero spills, the mean year sees one small spill, and the 1-in-100 year sees a blowout that defines the capital reserve. The environmental team rebuilt its liability model in ModelRisk around a compound-Poisson frequency-severity structure with an explicit Generalized Pareto tail for blowout-class events.
The result is a distribution almost nothing like its own average. In a typical year, nothing happens. But the cost of the years where something does happen — plotted below, conditional on at least one spill — runs from a few million dollars to a blowout-class tail that reaches into the hundreds of millions:
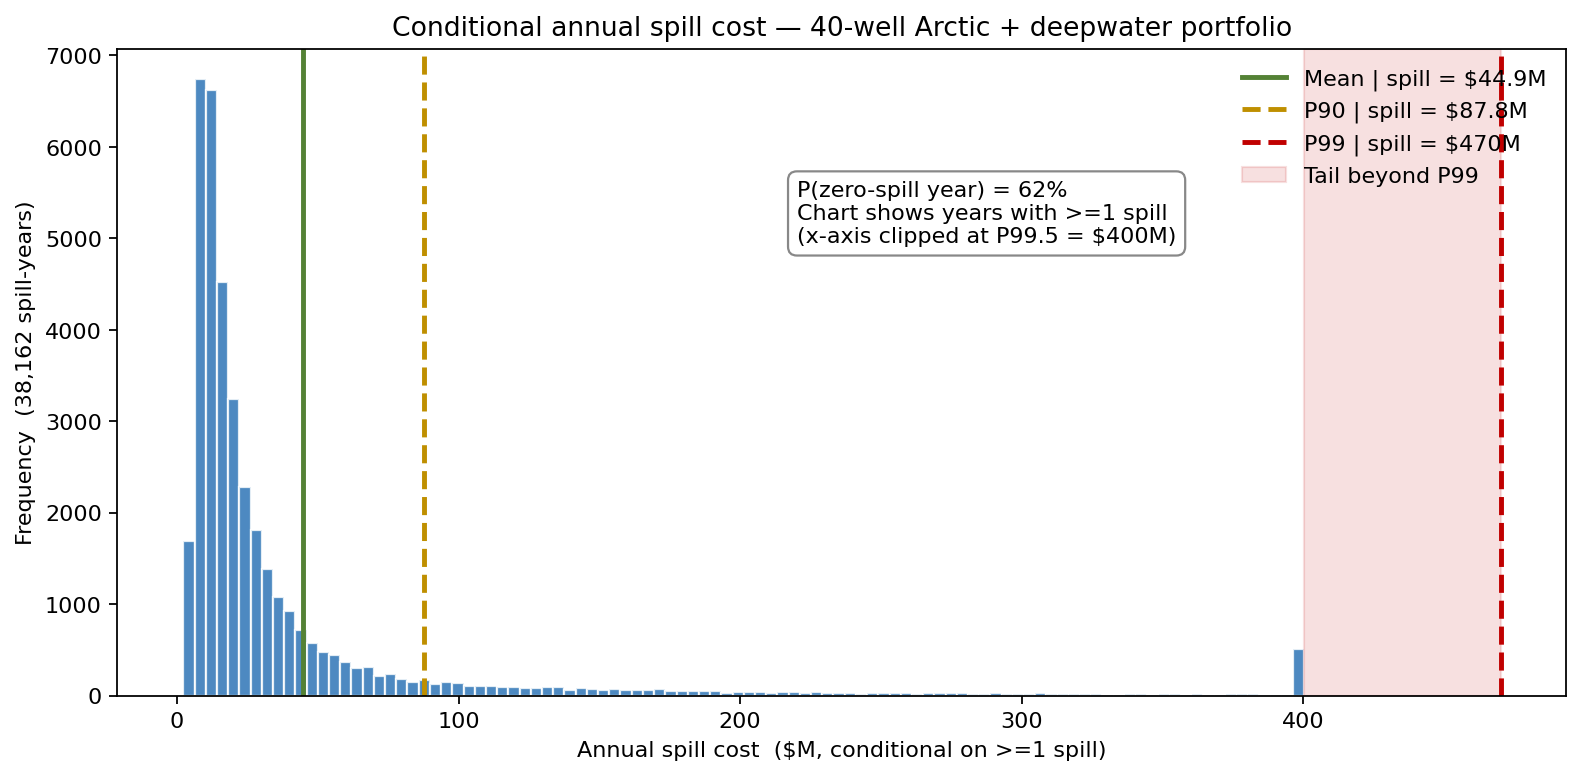
The chart is plotted conditional on at least one spill, because a histogram of all years would be one enormous spike at zero with the entire distribution invisible — the zero-inflated-histogram trap. Conditional, the right tail is what matters: the 1-in-100 spill-year is around ten times the conditional mean and is driven almost entirely by the Generalized Pareto blowout component.
Three layers, each with the right distribution
Spill frequency. Offshore industry data shows a spill rate of approximately 0.012 spills per well-year (>10 bbl, OGP and BSEE benchmarks combined). For a 40-well portfolio that is a Poisson rate λ = 0.48 spills/year — which means the probability of a zero-spill year is e^(-0.48) ≈ 62%. The mean and the median diverge sharply from the start.
Severity body. Per-spill volume is LogNormal with median 1,500 bbl and log-σ = 1.6 — a deliberately heavy body, calibrated to the long historical record of incidents in the 100–20,000 bbl range. Mean per-spill volume in the body is approximately 5,400 bbl.
Severity tail. Treating spill severity as LogNormal-only is the catastrophe-modelling error analogous to "Weibull-only for hurricane intensity": the tail wears out. The model swaps to a Generalized Pareto distribution above the 50,000-bbl threshold (peaks-over-threshold construction with shape ξ = 0.6, scale 30,000). Blowout-class events occur in 3.5% of all spills — the rare but defining cases where the per-event volume can be hundreds of thousands of barrels.
Mitigation effectiveness. The fraction of released volume contained by booms, skimmers, and dispersants before it reaches a sensitive shoreline is Beta(2, 4) with mean 33% — bounded on [0, 1], as a fraction must be. Using a Normal distribution here, as several in-house models do, lets the simulation draw negative or >100% mitigation effectiveness.
Cost per barrel. Cost-per-barrel-released depends on location sensitivity, regulatory regime, and litigation exposure. Modelled as LogNormal centred on $4,500/bbl (median; mean ~$5,000), calibrated to settled cases in Alaska, the Gulf, and the North Sea since 2010.
\[ \text{Annual cost} = \sum_{i=1}^{N(\lambda)} \bigl[ V_i \cdot (1 - E_i) \cdot C_i + F_i \bigr] \]
where N is the Poisson event count, V the spill volume (LogNormal body / GPD tail mixture), E the Beta mitigation fraction, C the LogNormal $/bbl cost, F the LogNormal fixed mobilisation cost.
Why the deterministic "expected spill cost" misleads
The deterministic point estimate plugs the means in term by term: λ × mean(V) × (1 − mean(E)) × mean(C) ≈ 0.48 × 5,400 × 0.67 × $5,000 ≈ $8.7M/year. The full simulation produces a mean of $17M/year — roughly double the point estimate, because the heavy-tailed GPD blowout component pulls the true average well above the "plug-in-the-means" figure. And 62% of all years have zero cost, the median year has zero cost, and the 99th-percentile year costs around $270M. The capital reserve a company must hold to survive the 1-in-100 year is on the order of sixteen times the mean — and the 1-in-200 year, the P99.5, is more than twenty times.
What actually drives the liability number
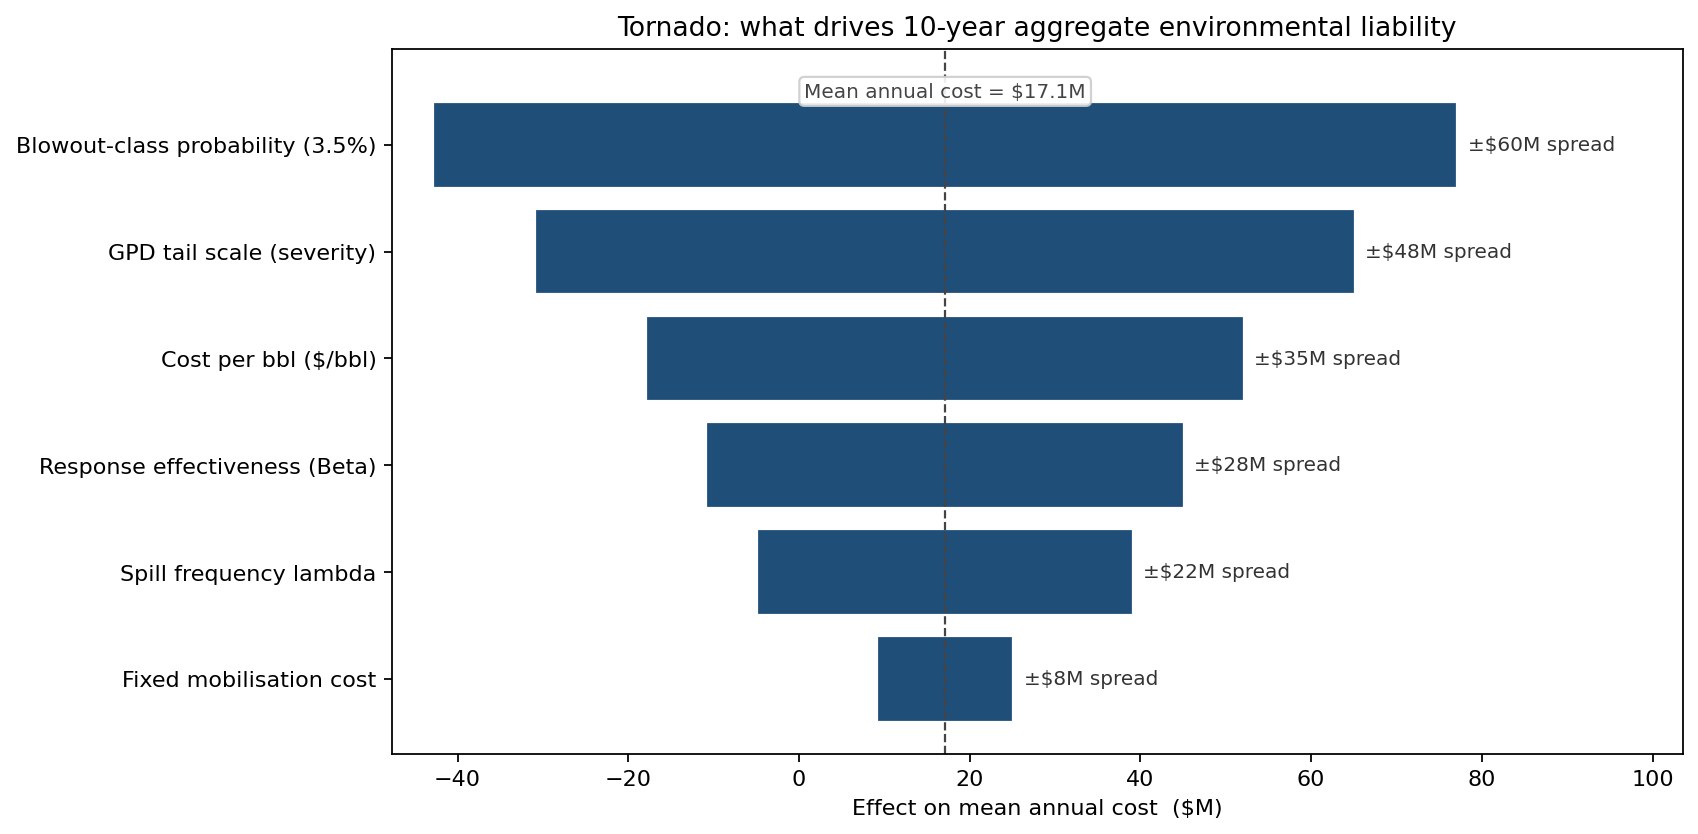
The blowout probability and the GPD tail scale dominate — together they account for more than half the variance of the mean annual cost. Cost per barrel and response effectiveness rank third and fourth, which directs spending: an additional $4M/year on real-time leak detection and pre-positioned booms can plausibly shift the Beta mitigation distribution from mean 33% to mean 57%. Spill frequency itself ranks lower than commonly assumed — because the rare blowout dominates, halving the small-spill rate barely moves the tail.
Cost-benefit of enhanced response
The "what if we spend $4M/year on better response" scenario rebuilds the simulation with: (a) 15% lower spill frequency from real-time leak detection, (b) 35% lower blowout-class probability from automated shut-in logic, (c) Beta(4, 3) response effectiveness (mean 57%, up from 33%), plus the $4M/year programme cost. The overlay:
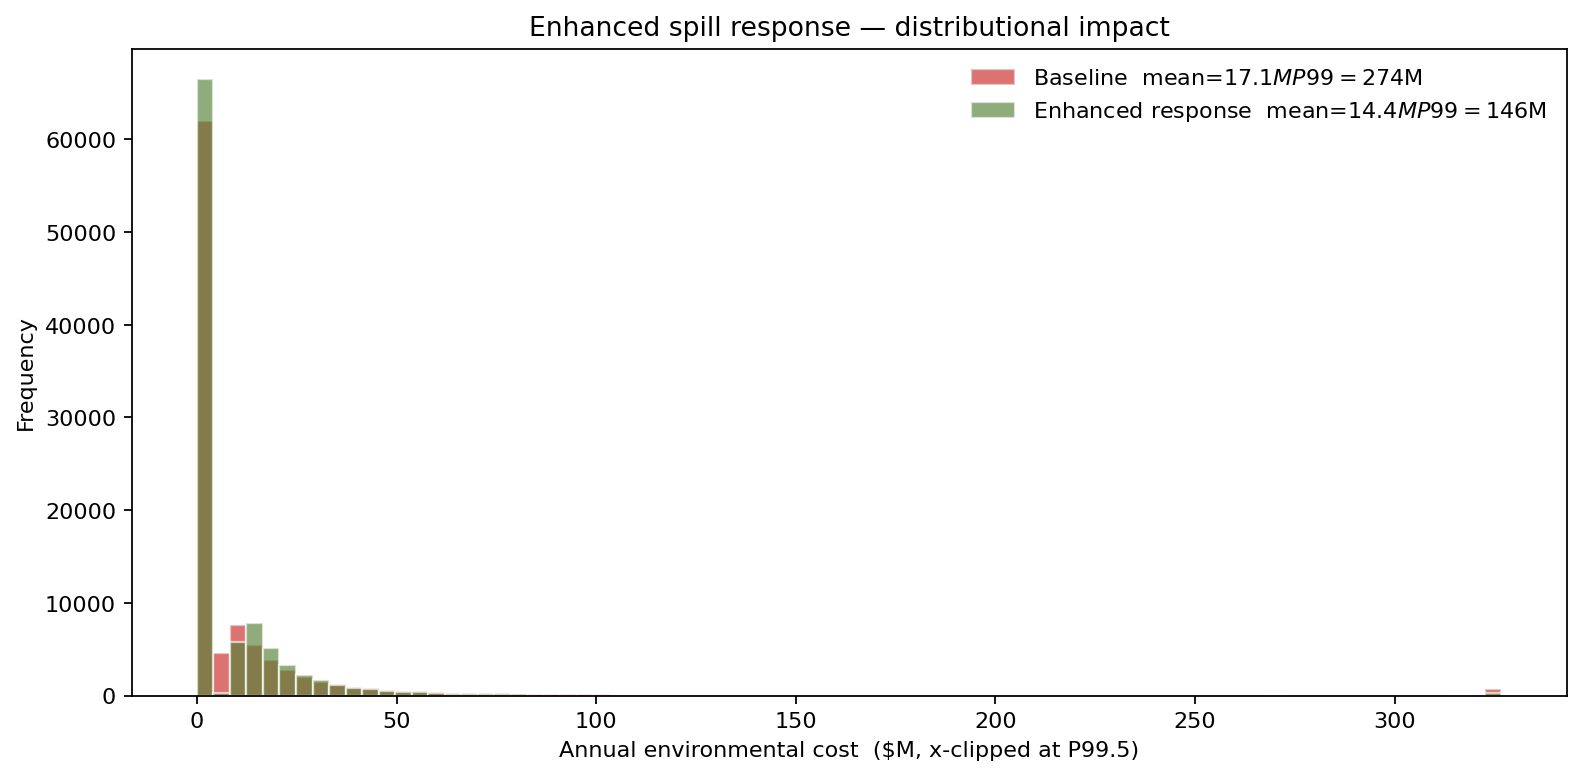
The mean annual cost moves modestly — from $17M to about $14M (the programme costs $4M/year, so the headline number barely moves) — but the P99 drops by roughly 47%, from about $270M to $146M — exactly the tail that matters for capital reserves, insurance pricing, and regulatory ORSA-style reporting. A decision based on mean cost would reject the programme; a decision based on tail cost approves it.
What changed
- Capital reserve resized from $50M to $400M to match the P99.5 of the corrected liability distribution — the number the insurance broker uses for reinsurance pricing.
- Real-time leak detection programme approved at $4M/year ongoing, justified entirely on the tail reduction rather than the mean.
- Arctic operations re-prioritised: simulation showed that two Arctic prospects accounted for 38% of the tail liability despite holding only 12% of the portfolio's wells, because Arctic cost-per-barrel is 2.5× deepwater. Drilling cadence in Arctic was reduced to a single well per year.
- ORSA-style environmental risk submission for the corporate sustainability report now includes the full P50, P90, P99 distribution rather than a single point estimate — closing a finding from the prior year's audit.
ModelRisk Functionality Used
- Compound Poisson frequency with rate calibrated to OGP/BSEE per-well incident statistics, producing the realistic 62% zero-spill probability that single-point estimates erase.
- LogNormal body + Generalized Pareto tail for per-spill volume — the peaks-over-threshold construction from extreme value theory, which a single LogNormal undersells in the >50,000 bbl range where the capital reserve lives.
- Beta mitigation effectiveness bounded on [0, 1] — replacing the Normal distribution that allows the physically impossible draws of negative or >100% recovery.
- Conditional-distribution plotting for the cost histogram, avoiding the zero-spike trap that makes the actual loss shape invisible.
- Sensitivity tornado that ranked the blowout probability and GPD scale as the dominant drivers — directly funding the leak-detection investment that the mean-only model would have rejected.
- Side-by-side mitigation comparison showing the P99 drop rather than the mean change, because the mean change is the wrong number for a tail-driven liability.
The shape of environmental liability is not the mean — it is a long zero spike, a small-loss body, and a fat blowout tail. Monte Carlo simulation in ModelRisk is what makes that shape visible, and visibility is what gets the $4M-a-year leak-detection programme through the capital committee.