

Industry: Mining and Natural Resources
Product: ModelRisk
Application: Tailings Storage Facility (TSF) Risk and Lifecycle Cost
A 1% Tail That Costs $4 Billion: Probabilistic Risk for a Tailings Storage Facility
Brumadinho killed 270 people in 2019. The Mariana failure in 2015 cost Samarco roughly $7 billion. The dam-break tail in tailings management is small in probability and huge in consequence, and a deterministic lifecycle-cost spreadsheet that returns "$740 million over 20 years" is mathematically right and decision-theoretically useless. The number that matters is the conditional expectation given a failure and the annual probability of one — the two inputs to the only risk metric a board can actually act on.
A large-scale copper-gold tailings facility — 200 Mt of tailings over 20 years of mine life, conventional upstream-raised wet TSF — was rebuilt in ModelRisk so that geotechnical stability, lifecycle cost, and the catastrophic tail lived in the same simulation, with the same draws. The result is a cost distribution with two utterly different regimes living inside it:
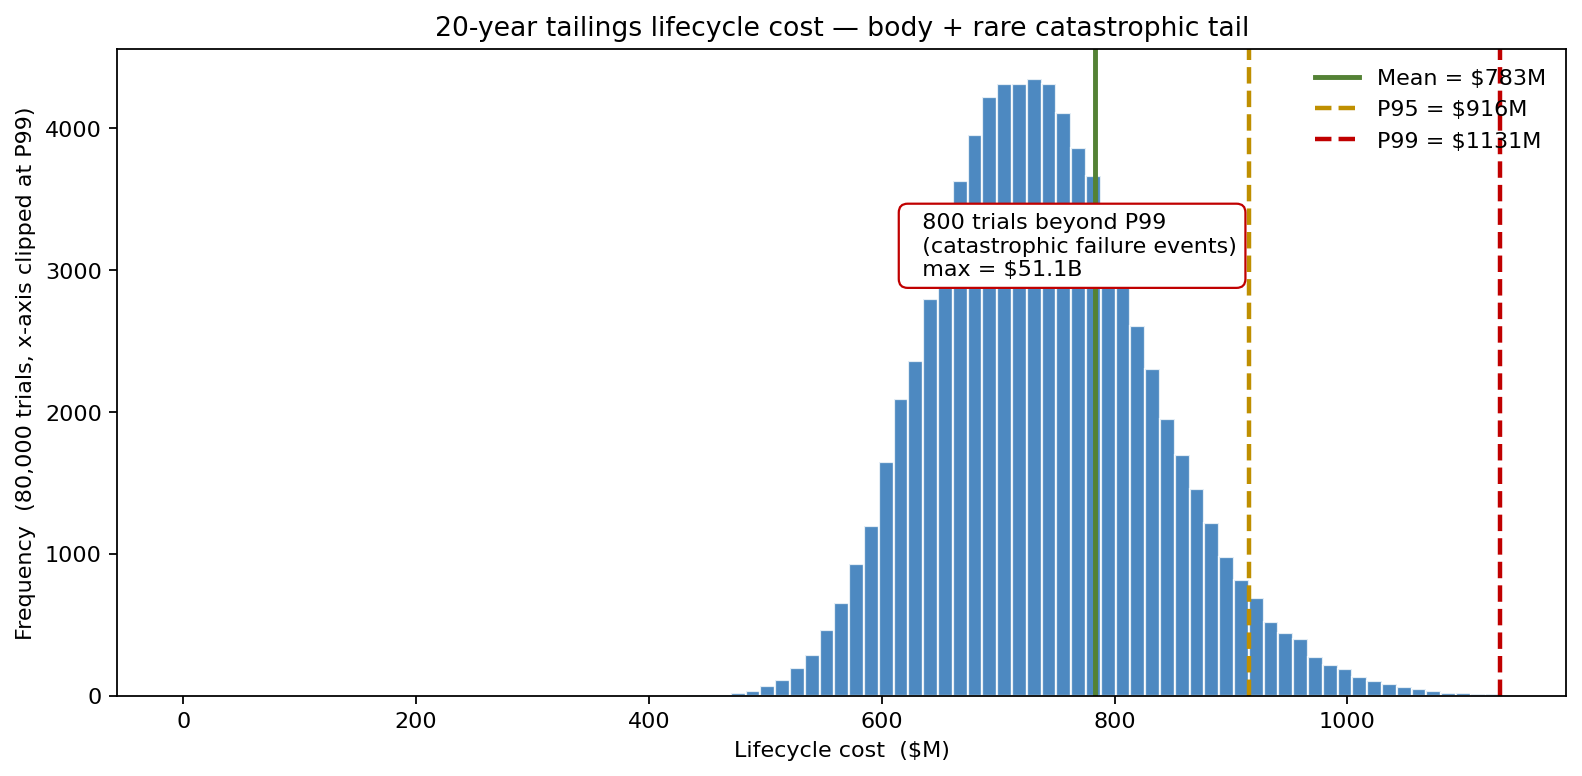
The body of the distribution — construction, operation, closure, no failure — runs to a mean near $740M with P95 around $916M. But in 800 of 80,000 simulated lives a catastrophic dam failure fires, and the cost in those lives runs to a maximum of $51B. That rare tail lifts the overall mean to $783M, leaves P50 and P95 almost untouched, and dominates everything from P99 ($1,131M) outward. A deterministic spreadsheet built on the body alone cannot see any of it.
Where the FS really lives
The slope-stability factor of safety (FS) under the limit-equilibrium method is the ratio of resisting forces (shear strength times area, reduced by pore-water pressure) to driving forces (gravity along the slope). Each ingredient is uncertain:
- Effective friction angle φ' — Normal, mean 32°, sd 3° (triaxial tests on tailings composites).
- Shear strength — Normal, mean 38 kPa, sd 6 kPa.
- Pore-pressure ratio r_u — Beta, mean 0.30, sd 0.10 — Beta because r_u is bounded on [0, 1] and using Normal here lets the simulator draw negative or > 1 ratios.
- Slope angle — Uniform 14°–22° across the perimeter (construction tolerance plus design variation by lift).
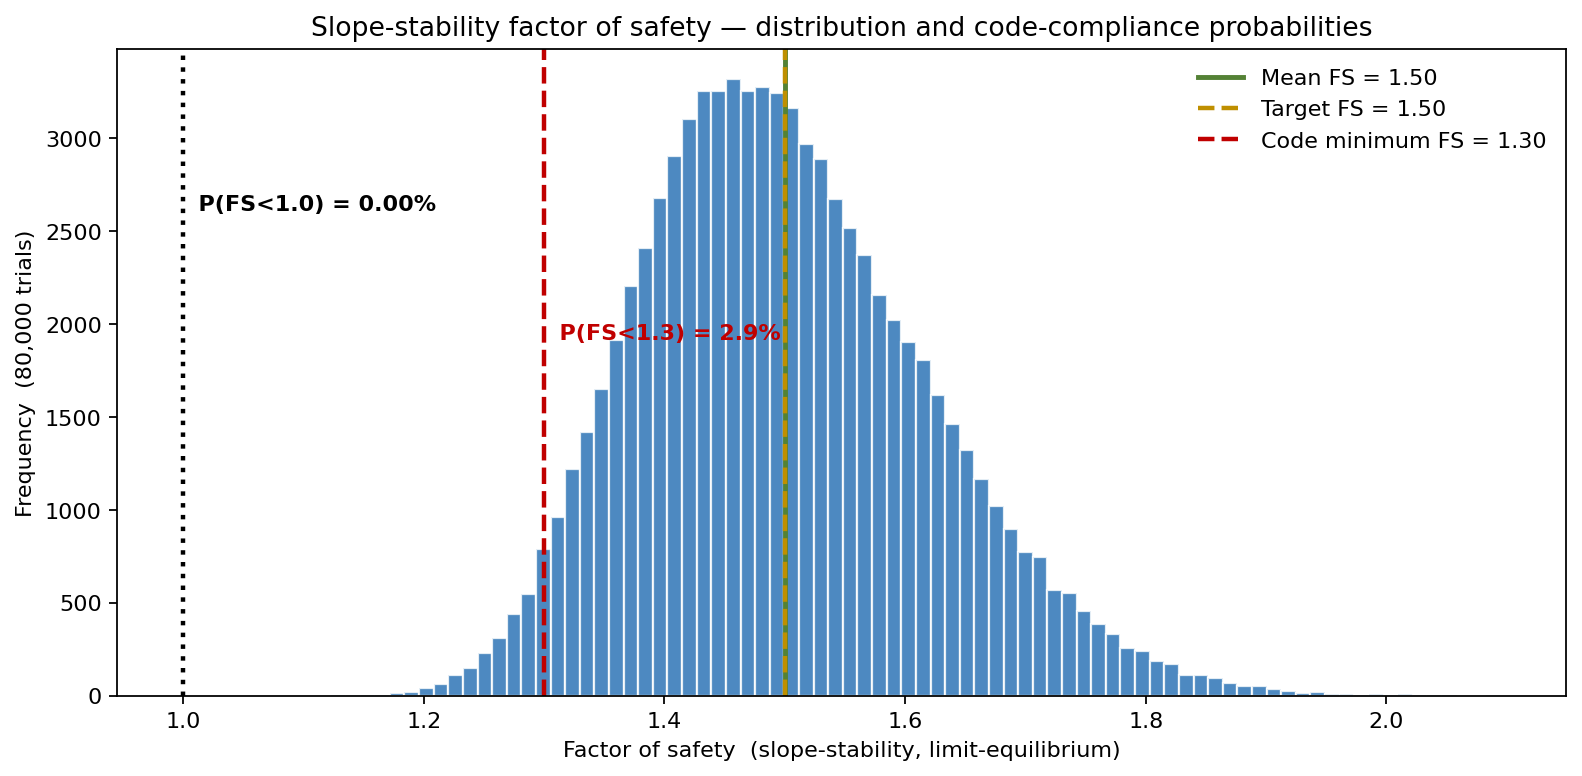
The mean FS sits at the target 1.50 (Canadian Dam Association and ANCOLD guidance), with a P10 of 1.35. The probability of falling below the code minimum FS = 1.30 is about 2.9% — meaning roughly one lift in thirty-five has a non-trivial chance of being declared non-compliant on a strict reading of the code. The probability of FS < 1.0 (theoretical failure) is effectively zero for a dam designed to 1.5 — no draw in 80,000 trials breaches it — but the 2.9% sub-code mass is precisely the population the monitoring programme has to watch, because it is the leading indicator of the catastrophic-failure trigger.
The catastrophic-tail beat — and why a single LogNormal is wrong
Lifecycle cost is the sum of four components — construction, operation, closure, liability — each modelled with its own LogNormal body. The liability component, however, is not a single LogNormal. It is a Bernoulli × LogNormal mixture: with annual probability of catastrophic failure p ≈ 0.05% per year (calibrated to global TSF incident records, Roche & Oberle 2017), the probability of at least one failure over the 20-year life is roughly 1%. When a failure occurs, the financial severity is itself LogNormal with mean ≈ $4.5B and σ_log ≈ 0.7 (Brumadinho-scale at the upper end, more modest releases at the lower end).
A single fat-tailed continuous distribution over liability misses the structure: in 99% of simulated lives nothing happens, in 1% the liability dwarfs the other three components combined.
Why Monte Carlo, not a point estimate?
The lifecycle-cost chart above earns its place as the lead because of what it does not show in the body: the rare tail is held in a callout precisely because it is off-axis on any plot scaled to the everyday cost. Body mean lifecycle cost runs around $740M. The catastrophic tail lifts the overall mean to ≈ $783M, contributes nearly nothing to P50 ($735M) or P95 ($916M) — these are dominated by the construction-operation-closure body — and dominates P99 ($1,131M) and beyond. A deterministic spreadsheet built on the body alone underprices catastrophic risk by roughly $44M of expected liability, hidden inside a 1%-over-life event the spreadsheet structurally cannot see. The probabilistic view turns that $44M into a defensible insurance premium and a defensible financial provision.
What actually moves lifecycle cost
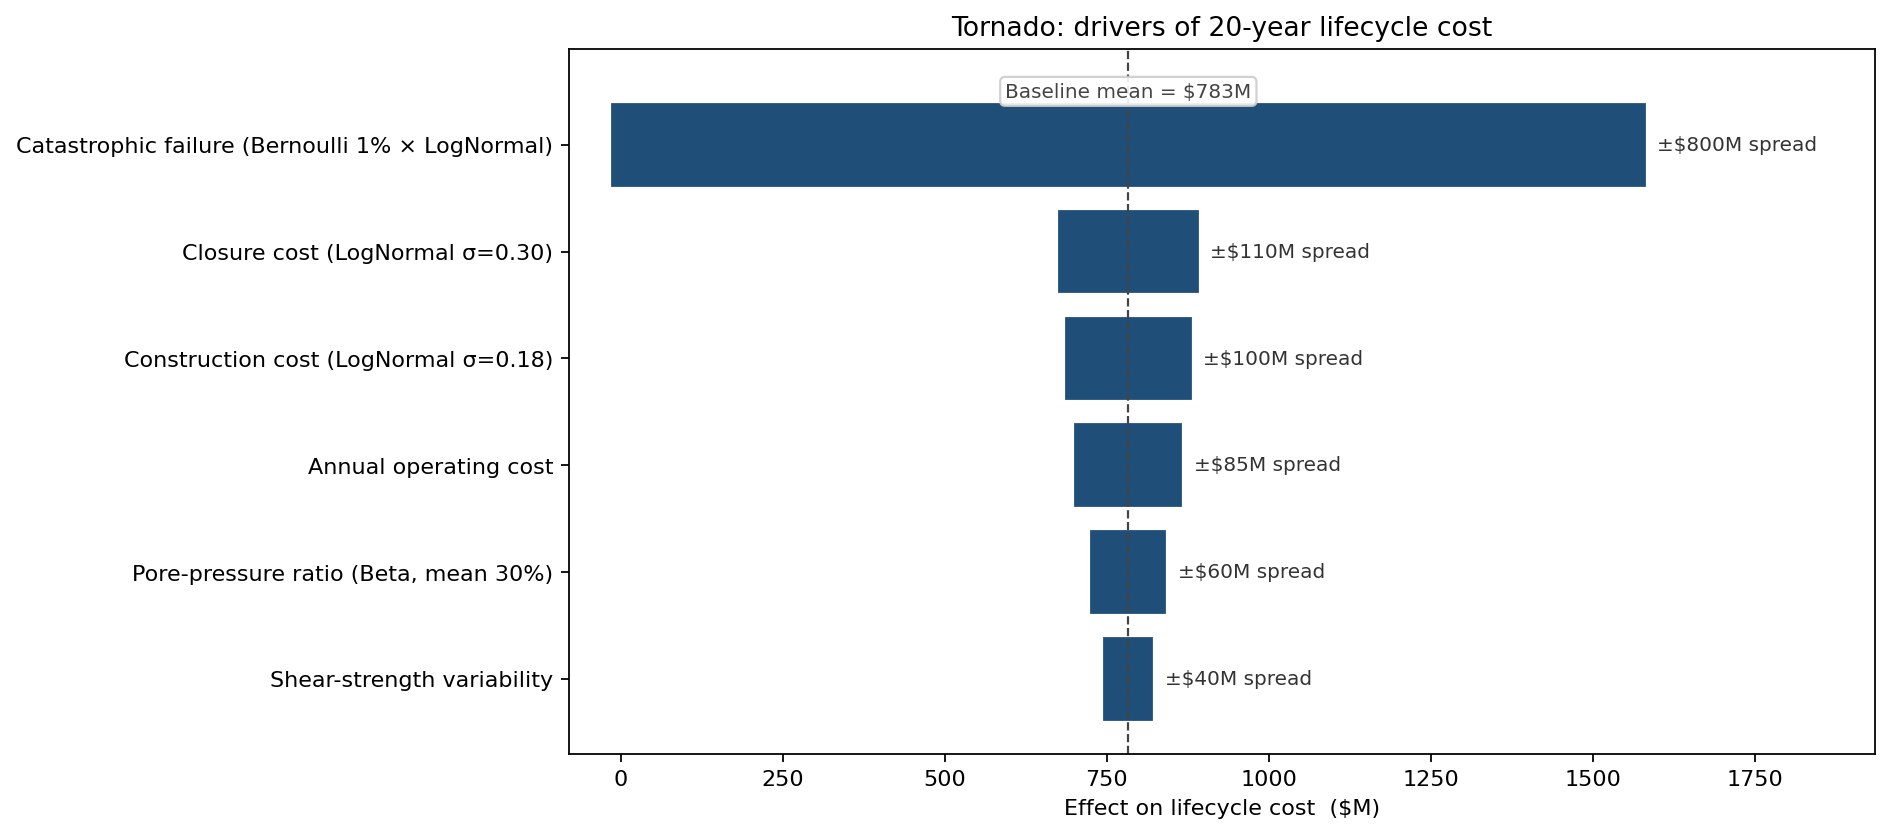
The catastrophic-failure mixture dominates every other input by an order of magnitude — its conditional severity bar dwarfs the construction, closure, and operation lines combined. Closure cost variability is second, reflecting the genuine uncertainty in reclamation technology and regulatory standards 20 years out. The geotechnical inputs (pore pressure, shear strength) rank lower than the financial inputs on the cost tornado, because the geotechnical inputs influence cost only through the failure-trigger probability, which is itself small.
Conventional wet TSF versus dry stack
Dry-stacking the tailings (filter-press, then trucked or conveyed to a stack with a moisture content below 18%) costs more in construction (~$480M vs $280M) and operation (~$18M/yr vs $14M/yr), but cuts the annual failure probability by roughly an order of magnitude and reduces the conditional severity (no impoundment to liquefy).
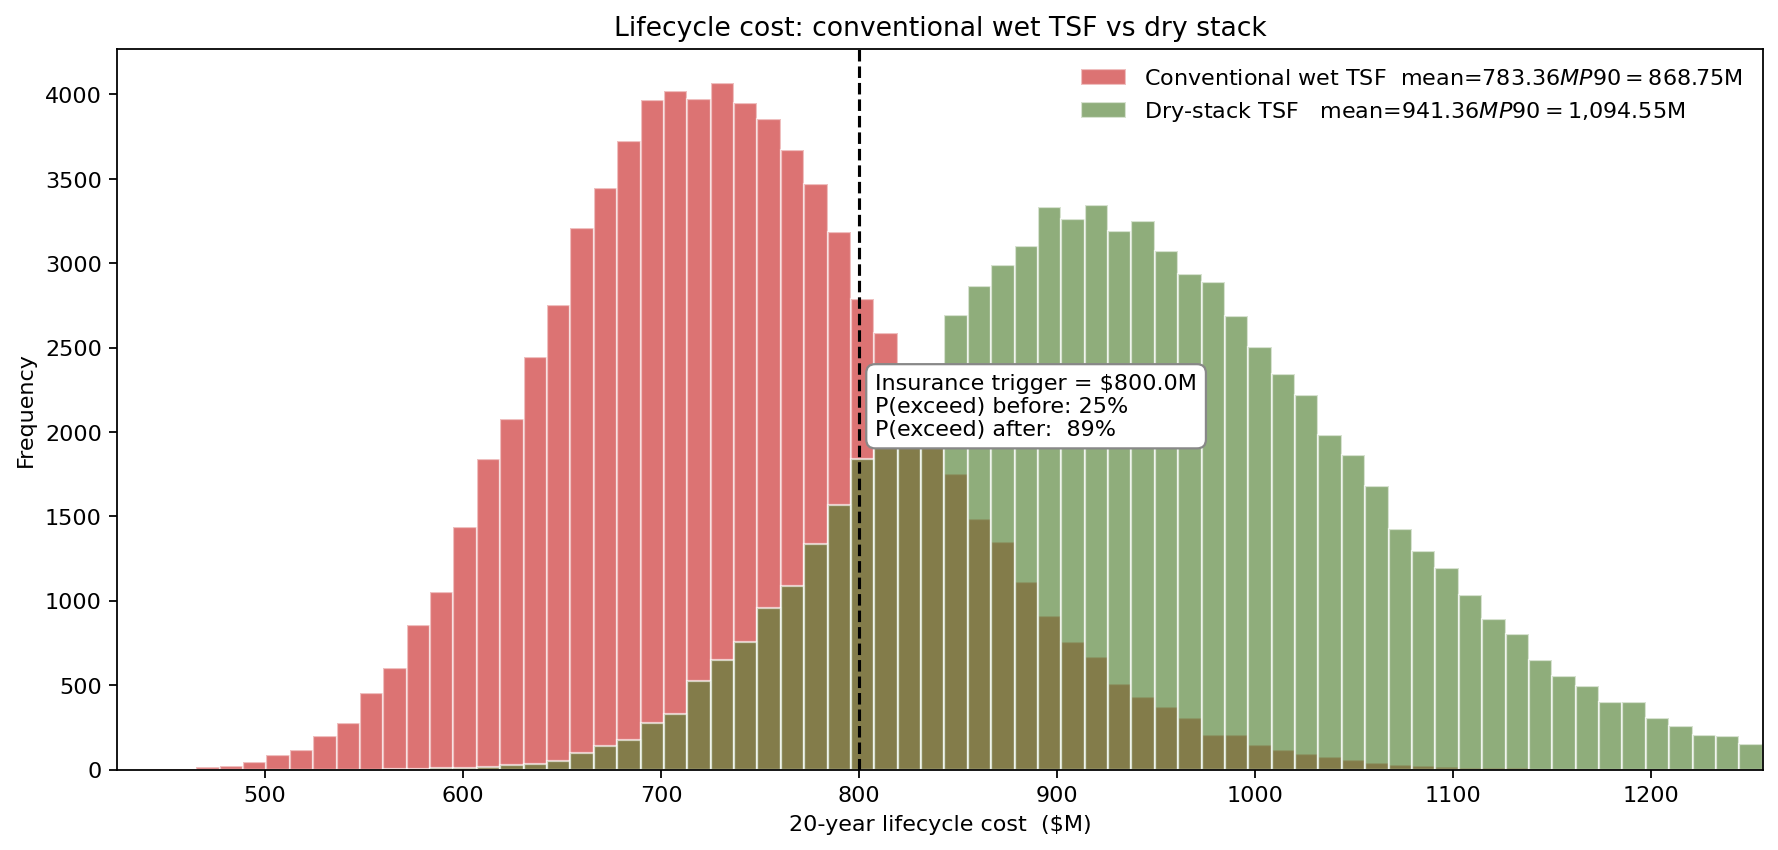
The dry-stack distribution is centred higher — mean ≈ $941M vs ≈ $783M, about $158M more — because the up-front construction ($480M vs $280M) and operating costs are larger. That higher centre is plainly visible on the chart. What the chart's P99 clip cannot show is where dry stack actually pays off: in the deep catastrophic tail. Dry stack cuts the annual failure probability roughly ten-fold and caps the conditional severity at ≈ $1.5B (no liquefiable impoundment) versus ≈ $4.5B for the wet TSF — so the dam-break mass that drives the conventional facility's $51B worst case shrinks by well over an order of magnitude. For a board with an explicit catastrophic-risk appetite, dry stack pays the extra $158M of mean cost as an effective insurance premium against a multi-billion-dollar tail the everyday cost figures never reveal. The Monte Carlo turned what was a qualitative ESG argument into a quantified options-style decision.
What changed
- Dry-stack option adopted at this site, with the $158M mean-cost premium framed against a quantified expected catastrophic-loss avoidance of roughly $40M plus board-level risk-appetite considerations the deterministic spreadsheet could not score.
- Insurance tower repriced using the simulated exceedance probability curve — attachment at $800M, limit set at the 99.5th percentile of the conventional distribution, replacing the prior actuarial estimate.
- Geotechnical monitoring re-prioritised around pore-pressure piezometers (the largest controllable driver of FS), with a $2.8M instrumentation programme funded.
- Closure provision re-baselined to the P75 closure-cost number (≈ $210M) instead of the mean ($180M), because the regulator's view of "best estimate" had shifted.
ModelRisk Functionality Used
- Bernoulli × LogNormal mixture for the catastrophic-failure liability — the only honest way to represent a rare, high-consequence event in a lifecycle-cost model. A single fat-tailed continuous distribution gets the mean roughly right but the structure of risk wrong.
- Beta pore-pressure ratio with method-of-moments parameterisation, bounded by construction.
- Normal effective friction angle and shear strength with σ derived directly from triaxial test scatter.
- Limit-equilibrium FS computation wired into the same simulation, so geotechnical and financial outcomes share the same draws.
- Conventional-vs-dry-stack comparison under shared market and cost-inflation streams, so the comparison is fair on each simulated future.
- Exceedance-probability output at 95th and 99th percentiles in the format the insurance broker and the rating agency both consume.
Tailings risk is not the mean lifecycle cost — it is the joint distribution of "almost certain" (the $740M body) and "rare catastrophic" (the $4B tail), and the cost of the decisions that separate them. Monte Carlo simulation in ModelRisk, with an explicit mixture for the catastrophic component, is what makes that joint distribution computable, insurable, and defensible in front of the regulators, the auditors, and the communities downstream of the dam.