

Industry: Mining and Natural Resources
Product: ModelRisk
Application: Portfolio Capital Allocation Across Mining Projects
Six Projects, One Budget: Correlated Commodity Risk and the Allocation Question
A $1.5-billion mining major routes its growth capex across six projects on three continents and three commodities — gold, copper, iron ore — under a single annual capex budget of roughly $750 million. The deterministic ranking is straightforward: take the highest mean-NPV project until the budget is gone. The probabilistic ranking is not, because the projects are not independent. When copper prices fall, the LME price feeds into all three Cu and Fe projects at once; when capex inflation spikes, every greenfield project's cost line moves together. Treating six correlated projects as six independent ones is the single most common mistake in mining portfolio modelling — and the one with the largest tail consequence.
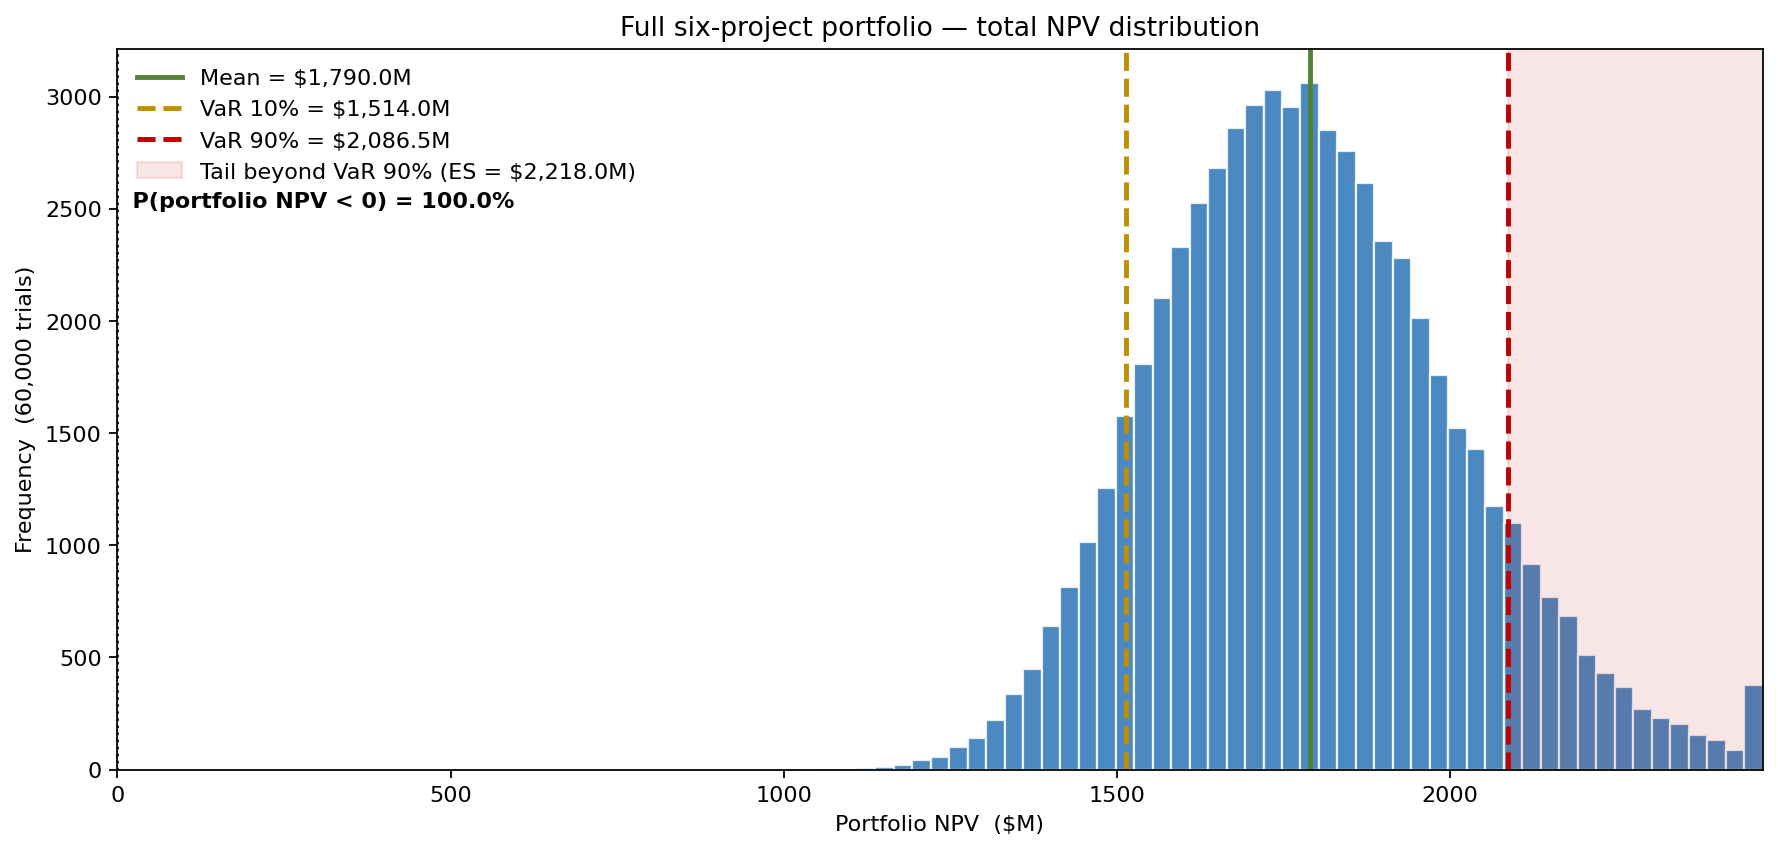
The portfolio team rebuilt the capital-allocation engine in ModelRisk around an explicit Gaussian copula over six macro drivers (Au, Cu, Fe prices, FX, diesel, capex inflation), with project-specific risk layered on top. Summed across the six projects, the answer is not a number but a distribution — mean NPV near $1.79B, but a P10-to-P90 spread from $1.51B to $2.09B that the deterministic ranking never sees:
Where the diversification really lives
A single LogNormal per commodity captures price skew. A Gaussian copula stitches the six macro drivers into a joint distribution that respects the historical co-movements:
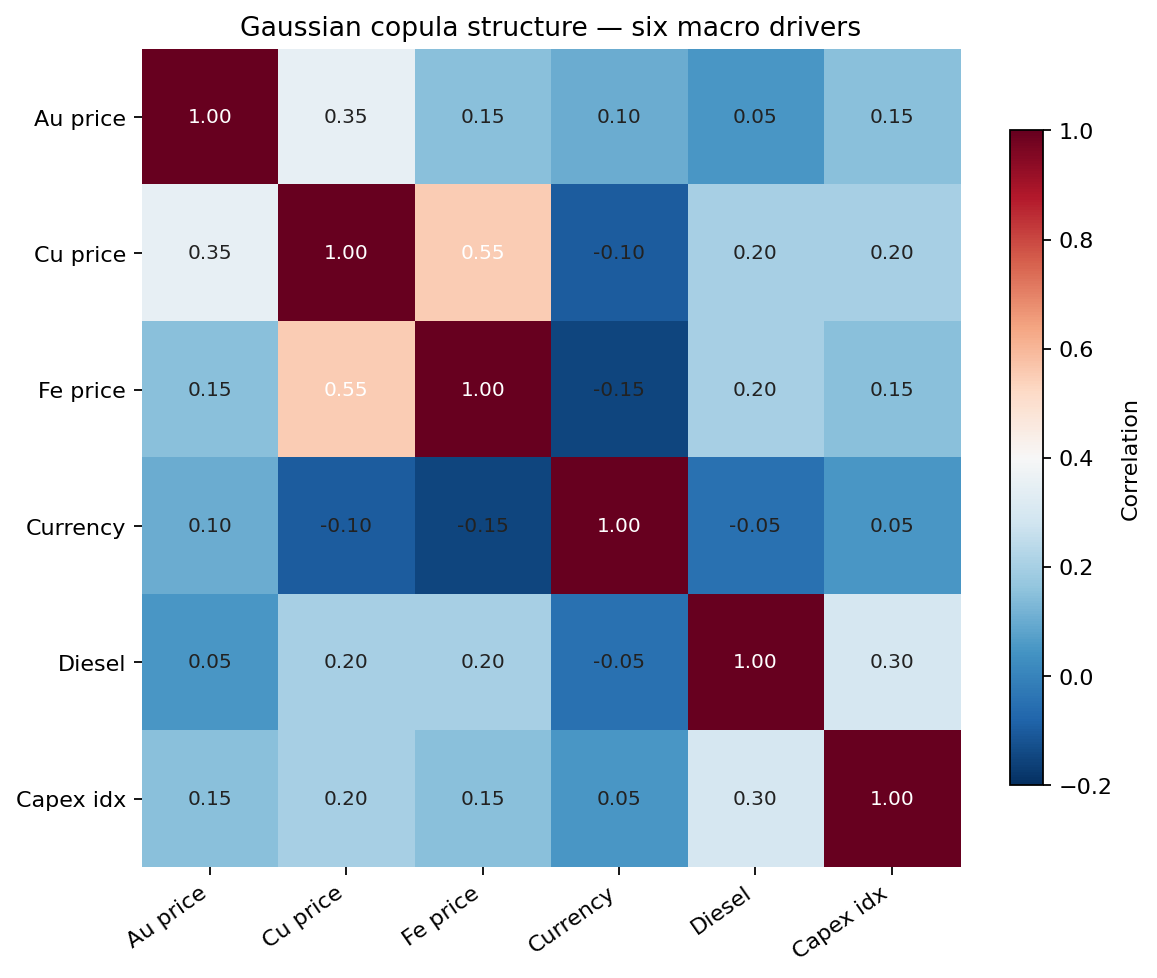
The numbers that matter: Cu and Fe price correlation ≈ 0.55 (both driven by China steel and global industrial demand), Au and Cu ≈ 0.35 (looser link via global growth), FX negatively correlated with both Cu and Fe because emerging-market currencies typically strengthen alongside commodity-price upcycles. The diesel and capex-inflation indices correlate positively with the metals (≈ 0.20–0.30) — when the cycle is hot, the cost line runs hot with the revenue line, eating into the apparent diversification benefit.
Six projects, each its own distribution
The portfolio contains:
| Project | Commodity | Base NPV | Capex | Project-specific σ_log |
|---|---|---|---|---|
| Gold A (Andes exploration) | Au | $320M | $90M | 0.45 |
| Gold B (West Africa, advanced) | Au | $210M | $60M | 0.30 |
| Copper C (Chile expansion) | Cu | $480M | $220M | 0.30 |
| Copper D (DRC greenfield) | Cu | $350M | $180M | 0.45 |
| Iron E (Pilbara expansion) | Fe | $280M | $120M | 0.20 |
| Iron F (Brazil) | Fe | $150M | $80M | 0.25 |
The high-σ projects (Gold A, Copper D) are the speculative end of the portfolio — large mean NPV per dollar of capex, but with project-specific risk that the copula does not capture. Most of the macro dispersion comes from the shared price draws.
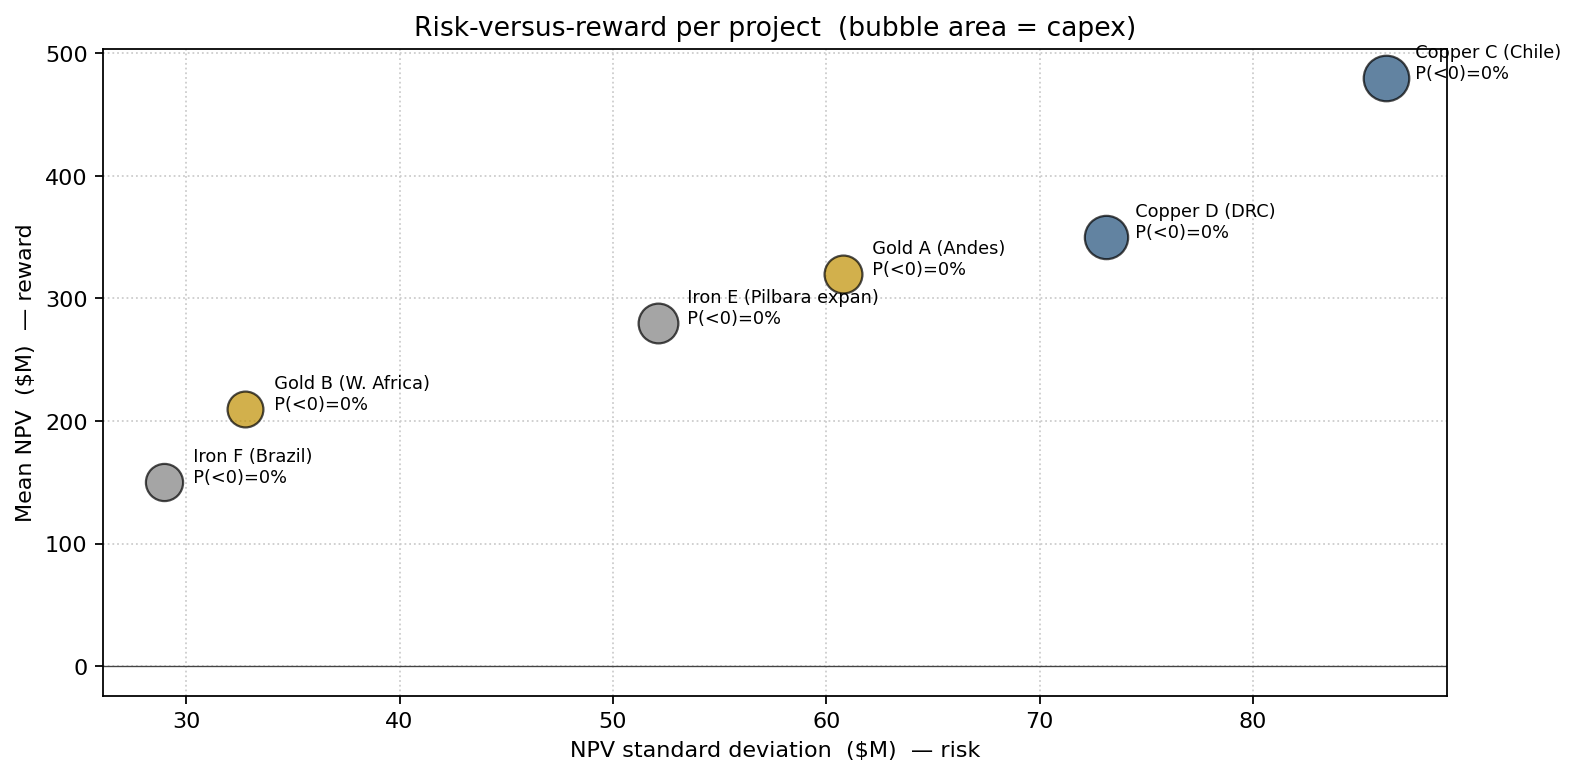
The Pareto frontier of mean NPV against standard deviation is clear: Copper C dominates the upper region (high reward, moderate risk), Gold B dominates the lower-left (low risk, low reward), and the two Iron projects sit comfortably on the defensive axis. Gold A and Copper D are the high-variance bets that the deterministic ranking flags as "go" but that the probabilistic ranking will price differently.
Why Monte Carlo, not a point estimate?
Returning to that portfolio NPV distribution: mean portfolio NPV is about $1.79B. P10 is roughly $1.51B, P90 about $2.09B. The probability the full portfolio delivers negative NPV is effectively nil, but the P10-to-mean ratio of ≈ 0.85 is what controls how much of next year's capex the treasurer can pre-commit, and how much must sit in a contingency reserve. If the projects were independent the P10 would sit much closer to the mean — the copula's price correlations widen the dispersion materially: the portfolio standard deviation of ≈ $225M is roughly 55% wider than the ≈ $145M an independence assumption would imply.
Three allocations, three risk profiles
The portfolio committee evaluated three strategies under the same simulation:
- Full portfolio — all six projects, $750M total capex.
- Balanced — drop the two high-σ_log projects (Gold A and Copper D), keep the other four, $480M capex.
- Defensive — Iron-heavy plus Gold B only, $260M capex, balance redeployed to buyback.
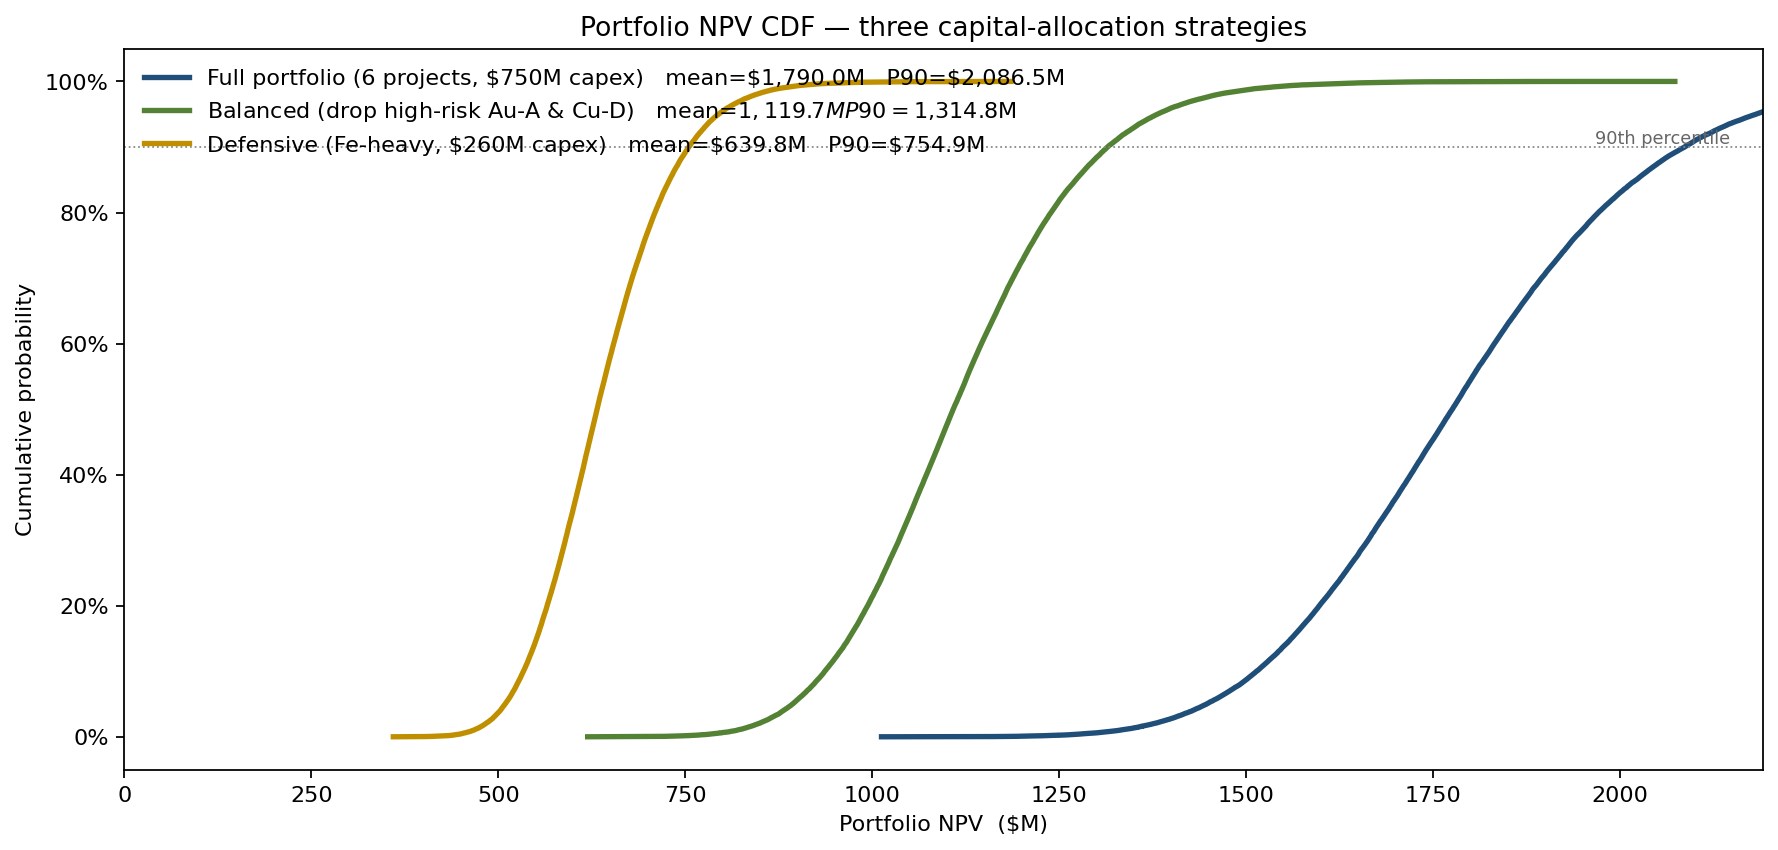
The full portfolio leads on mean NPV by roughly $670M over Balanced (mean $1,120M) and $1.15B over Defensive (mean $640M). Balanced gives up about 37% of the mean, but by dropping the two high-σ_log projects it trims the project-specific dispersion the copula does not capture — and the capex difference of $270M frees the dividend the treasurer wanted to underwrite. Defensive trades nearly two-thirds of the expected return for the tightest, most predictable NPV band of the three.
What changed in the boardroom
- Balanced allocation adopted for the year — Gold A deferred to next cycle pending infill drilling, Copper D advanced only after a partner farm-in to share the geological risk.
- $270M of freed capex redeployed to a $200M share buyback (recommended by the model's CDF crossover with the buyback breakeven) and $70M to a strategic exploration reserve.
- Reporting reframed: portfolio committee minutes now reference P10 portfolio NPV alongside the mean, in line with the bank credit committee's covenant view.
- Correlation matrix recalibrated quarterly from a rolling 10-year window of LME and price-deck data, with the copula fit re-estimated whenever the rolling correlation drifts more than 0.10 from the in-force estimate.
ModelRisk Functionality Used
- Gaussian copula across six macro drivers (three commodity prices, FX, diesel, capex inflation) with the historical correlation matrix fit from a 10-year window — the lever that most mining portfolio spreadsheets miss.
- LogNormal per-project shocks layered on top of the shared price draws, with σ_log calibrated to the engineering-confidence level of each project (exploration vs advanced study vs expansion).
- Portfolio NPV summation producing the joint distribution, including the diversification erosion from positive correlations between the cost and revenue lines.
- Allocation comparison via overlaid CDFs — the format that made the trade-off between mean uplift and P10 protection legible to the portfolio committee in one chart.
- Per-project risk-vs-reward scatter to identify the high-variance candidates whose project-specific risk dominated their copula-linked risk.
- Sensitivity ranking that confirmed copper price (single largest macro driver) was worth a hedging review for the next two years.
A six-project mining portfolio is not the sum of six independent NPVs — it is a draw from a joint distribution stitched together by commodity-price physics. Monte Carlo simulation in ModelRisk, with an explicit copula over the macro drivers, is what makes that joint distribution computable and the allocation question framable in P10/mean/P90 terms instead of single-point rankings.