

Industry: Mining and Natural Resources
Product: ModelRisk
Application: Flotation Circuit Optimization Under Recovery Uncertainty
A Two-Point Move in Copper Recovery: Stochastic Optimization of a Cu-Au Flotation Plant
A two-percentage-point lift in copper recovery on a 10-million-tonne-per-year flotation plant running ore at 0.75% Cu is worth roughly $11 million a year at $8,500/t copper. The deterministic plant model and the LIMS dashboard both report a single recovery number — typically the rolling thirty-day mean, around 86.5%. The plant actually operated between 78% and 92% on a year of shift-level data, and the question that mattered to the metallurgist was not "what is the average?" but "what grind size delivers the highest expected margin without driving the P10 recovery below 80%?"
A Cu-Au flotation plant treating polymetallic ore in northern Peru rebuilt its recovery and economic model in ModelRisk, so that every operating decision — grind size, reagent dosage, throughput pushes — could be evaluated against the full distribution of plant outcomes, not the rolling average. The first thing the model showed was the shape the dashboard had been hiding: not a recovery number, but a recovery distribution.
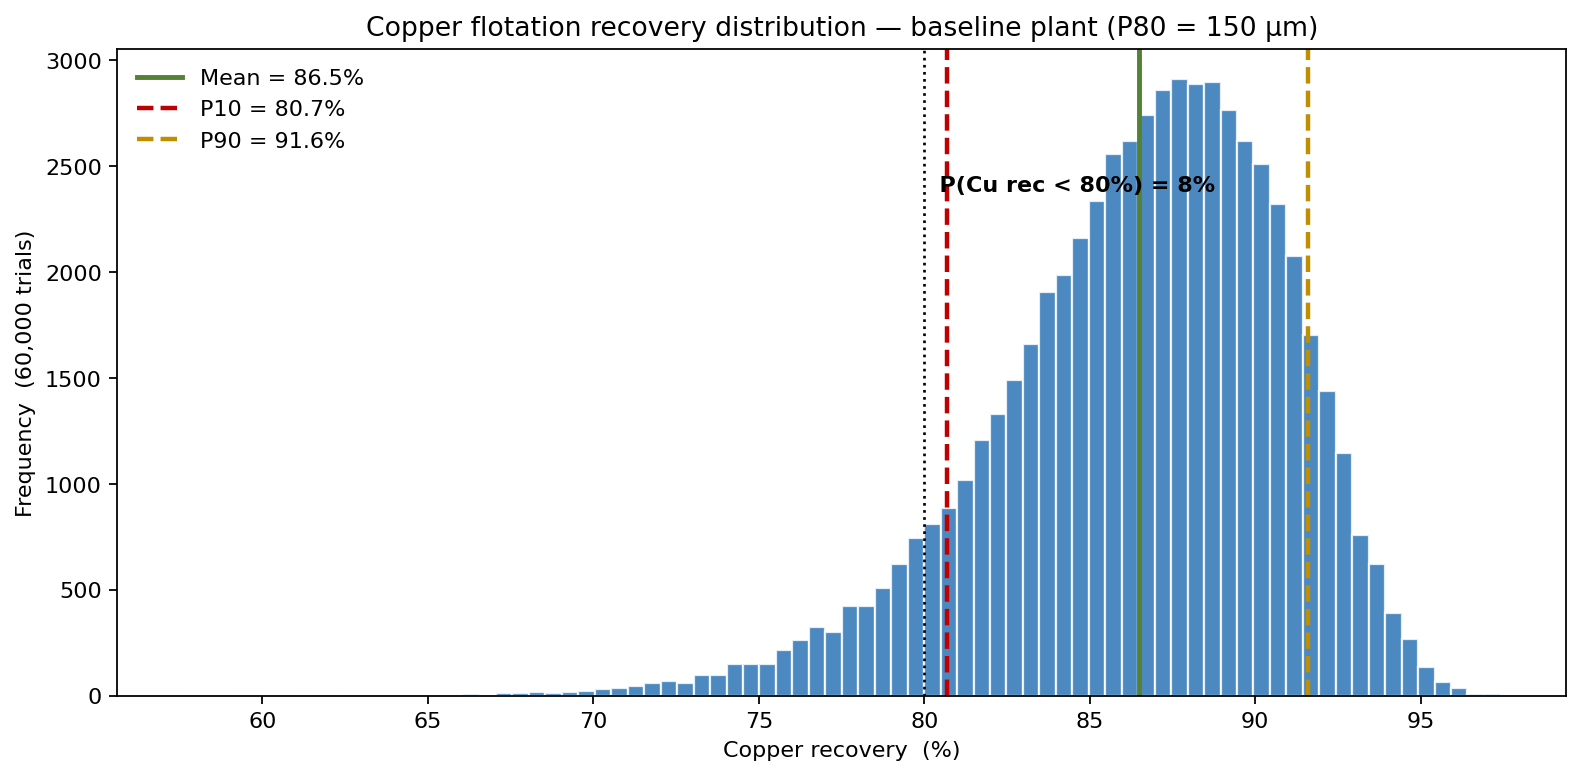
At the baseline grind of P80 = 150 µm the modelled copper recovery has a mean of 86.5%, a P10 of 80.7%, and a P90 of 91.6% — a span of nearly eleven points between a bad month and a good one. The dashed line marks the 80% recovery floor the metallurgical contract assumes; the probability of falling beneath it on any given draw is 8%, small but not negligible, and exactly the kind of contract-trigger event the rolling thirty-day mean hides.
Where the recovery really lives
Copper recovery in a flotation circuit is bounded between 0% and 100% by definition, with a clear ceiling set by mineralogy and a clear floor set by froth-stability physics. Normal is the wrong family — it draws negative recoveries and recoveries above 100%. The plant model used Beta throughout for recovery components, and LogNormal for skewed cost and price terms:
- Maximum attainable Cu recovery — Beta with mean 92%, sd 2.5%, calibrated to locked-cycle flotation testwork on representative composites.
- Mineralogy factor — Beta with mean 94%, sd 4%, capturing day-to-day variability in chalcopyrite-vs-bornite ratio and pyrite content.
- Grind-size penalty — deterministic on the decision variable P80, falling roughly 0.35 percentage points of recovery per micron coarser than the 150 µm baseline (calibrated to liberation analysis).
- Head grade Cu — LogNormal, mean 0.75%, σ_log 0.20.
- Head grade Au — LogNormal, mean 0.42 g/t, σ_log 0.30.
Multiplied together at baseline P80 = 150 µm, the resulting Cu recovery has mean 86.5%, P10 80.7%, P90 91.6% — the distribution shown above. The roughly eleven-point spread between P10 and P90 is the difference between a good month and a bad month, and it is invisible in any single point estimate.
Why Monte Carlo, not a point estimate?
Aggregating recovery, throughput, prices, and costs gives the full annual margin distribution:
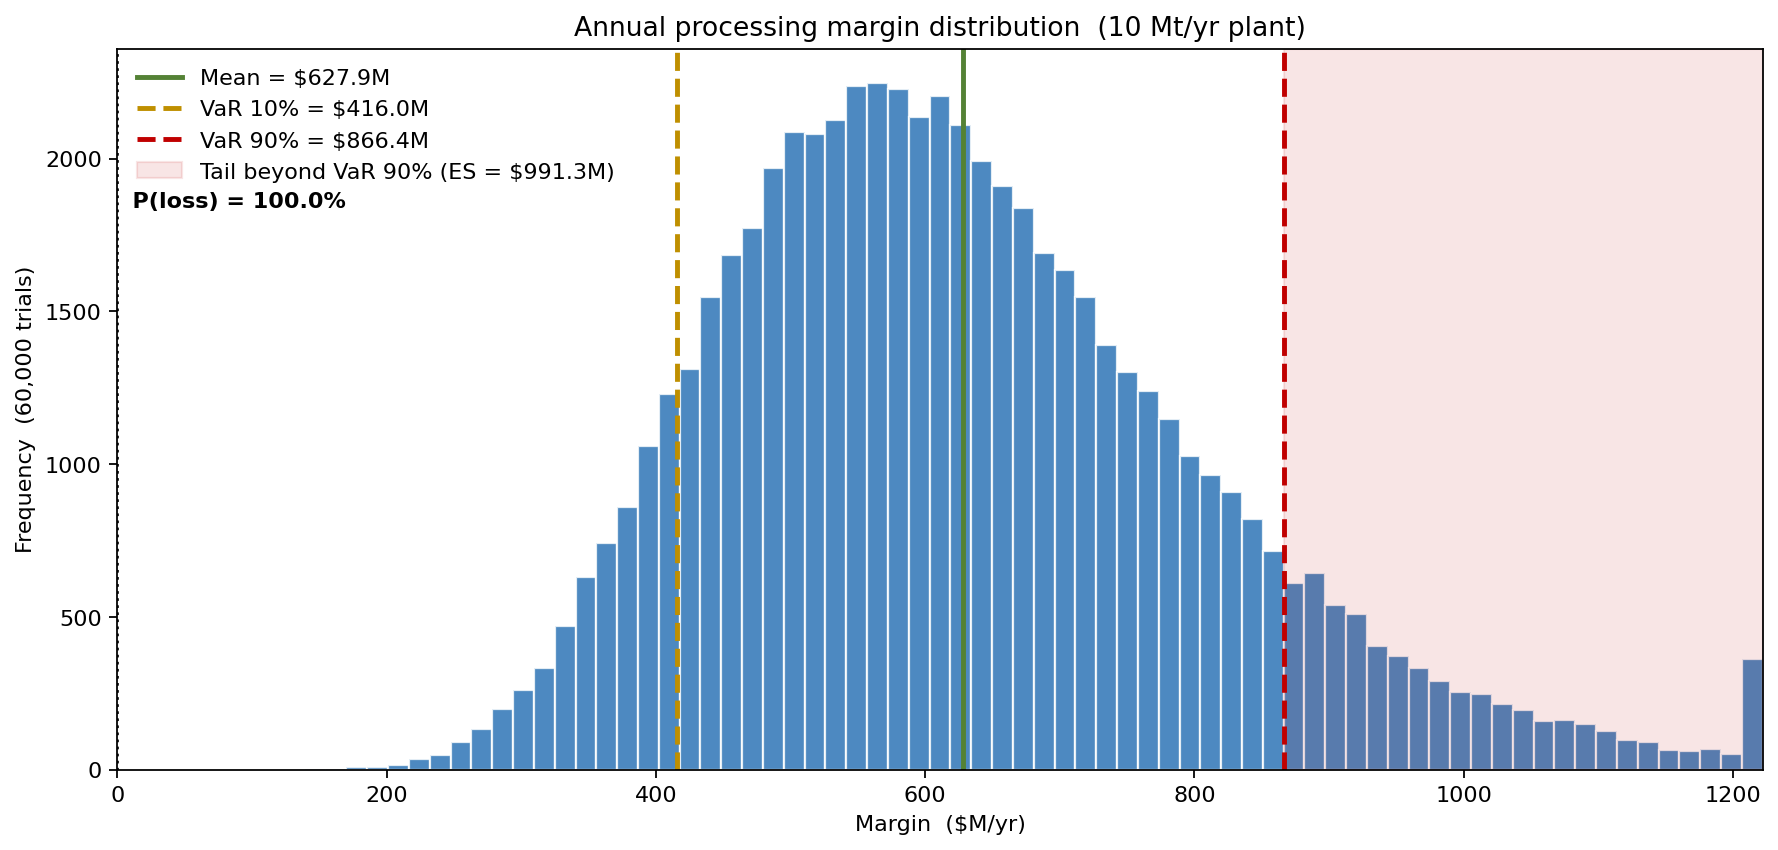
The deterministic model — point-estimate recovery, point-estimate grade, point-estimate price — returned a single margin number near $610M. The Monte Carlo produced a wide distribution with mean $628M, P10 around $416M and P90 around $866M, a 2× ratio that controls the plant's discretionary capex and dividend recommendation each year. The deterministic mid-case cannot show that P10-P90 gap, and the controller's risk-adjusted budget for the year is built on the gap, not the point.
The grind-size optimum is a broad plateau
The deterministic plant model says finer grind is better up to the point energy cost overtakes recovery gain. Running the same trade-off probabilistically sharpens the picture:
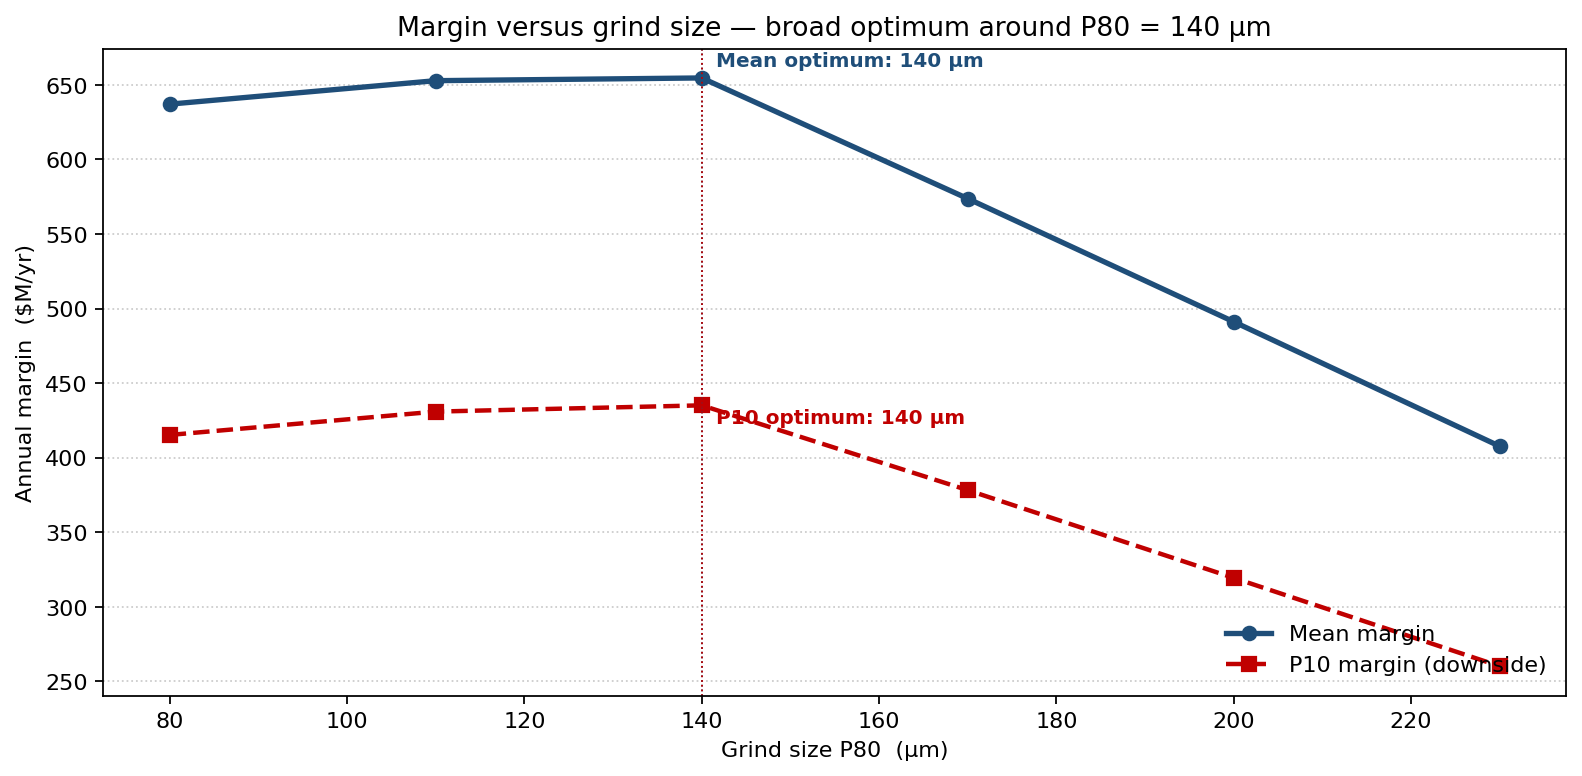
Both mean margin and the P10 (downside) margin peak at P80 = 140 µm — mean margin of $655M/yr, P10 of $435M/yr — but the surface is a broad plateau, not a sharp peak: from 110 µm to 140 µm the mean margin only moves between $653M and $655M. Coarsen past 140 µm and margin falls away fast — $574M at 170 µm, $491M at 200 µm — as recovery loss overwhelms the energy saving. Grind finer than 110 µm and the rising energy bill quietly erodes the gain. The plant set its target at 110 µm, sitting on the high side of the plateau where mean margin is within $2M of the optimum but mean copper recovery is held at 90.8% rather than the 89.5% of the 140 µm point — buying recovery headroom against the contract floor for a negligible margin cost.
What actually moves the margin
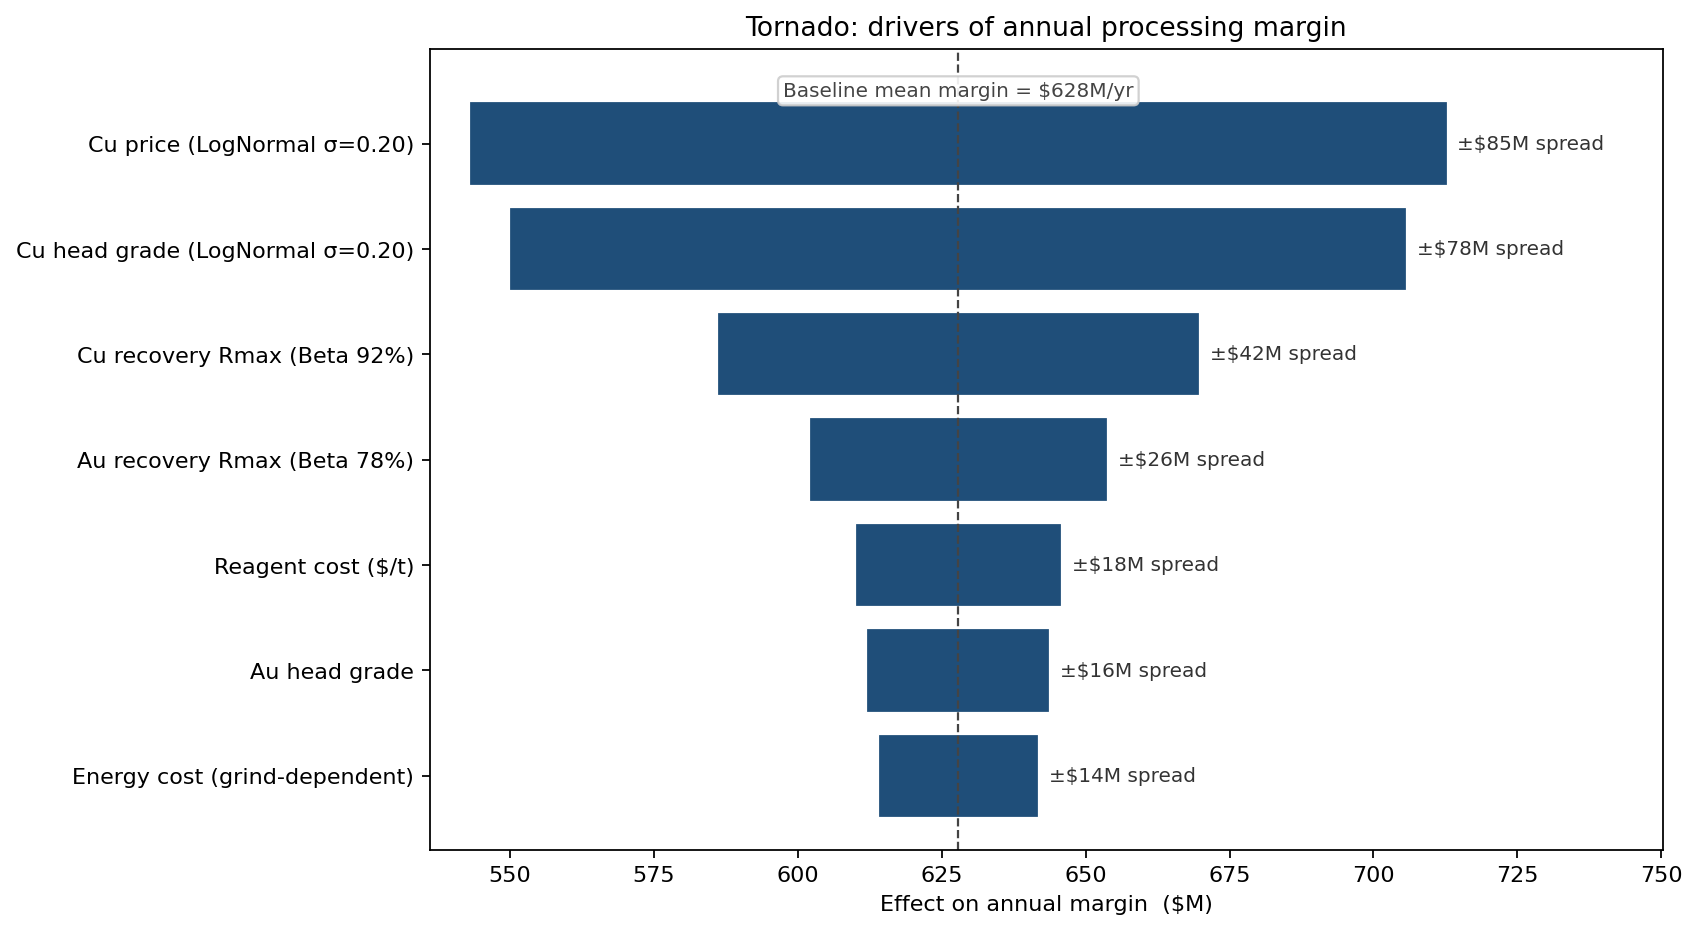
Copper price and head grade dominate, as they will on any concentrator. Inside the controllable set, maximum-attainable Cu recovery (Rmax) ranks third — equivalent to about $42M per percentage point of Rmax. That ordering pointed the metallurgical team's research budget at reagent suite redesign (xanthate dosing, frother optimisation, depressant ratio), valued at roughly $8M of expected NPV uplift per 1-point Rmax lift over a 5-year horizon. Reagent cost variability, by contrast, ranks fifth — the right place to set savings targets, not the right place to spend most of the optimisation effort.
What changed on the plant
- Target grind moved from P80 = 150 µm to 110 µm, lifting mean Cu recovery from 86.5% to ≈ 90.8% and mean annual margin from ≈ $628M to ≈ $653M, while keeping the P10 recovery comfortably above the 80% floor.
- Reagent suite redesign funded as the year's principal optimisation project, valued at $42M per point of Rmax lift; field trials targeted 1.5 points of Rmax gain.
- Recovery-floor contract clause re-priced with the explicit 8% trigger probability — the buyer's discount narrowed accordingly.
- Margin variance now reported alongside mean in the monthly operations review — P10 and P90 instead of plus-or-minus standard deviation, in the same chart format the bank credit committee already reads.
ModelRisk Functionality Used
- Beta recovery components with method-of-moments parameterisation from locked-cycle flotation data — no draws above 100% or below 0%.
- LogNormal head-grade and price inputs with σ_log fitted to assay and LME records, preserving right skew.
- Grind-size sweep as a deterministic decision variable layered over the stochastic recovery and cost terms — six P80 settings, each a 60,000-trial simulation.
- Margin posterior with P10 and P90 reported alongside the mean for use in the monthly ops review.
- Tornado ranking that prioritised reagent-suite R&D over the cheaper-to-attack reagent-cost line.
- Custom Excel formulas for the recovery model wired directly to the LIMS feed, so the simulation refreshes overnight on the most recent fortnight of head-assay data.
A flotation circuit is not "running at 86.5% recovery" — it is running across a distribution of recoveries that the rolling average happens to summarise badly. Monte Carlo simulation in ModelRisk is what lets the metallurgist optimise for the shape of that distribution, not its midpoint.