

Industry: Mining and Natural Resources
Product: ModelRisk
Application: Mining Equipment Investment under Uncertainty
The Eleventh Haul Truck Question: Stochastic Fleet Sizing for an Open-Pit Mine
A 240-tonne haul truck costs $5.2 million to buy and roughly $1.1 million a year to keep running. A leased equivalent runs $1.45 million a year, all-in. The mine plan calls for moving 30 million tonnes of material a year — ore plus waste — and the deterministic fleet calculation says eleven trucks will do it. The probabilistic calculation disagrees: eleven trucks hit the 30 Mt target in only 42% of simulated years, and it takes thirteen to push that above 80%. The gap between "the spreadsheet says eleven" and "eleven hits the plan two years in five" is exactly the kind of stock-out risk that gets a mine general manager fired.
This is the question an open-pit copper mine in northern Chile put through ModelRisk: how many of which class of truck, bought or leased, given variable cycle times, mechanical availability, and a copper price the operation cannot control? The clearest way to see the answer is the production-probability curve by fleet size:
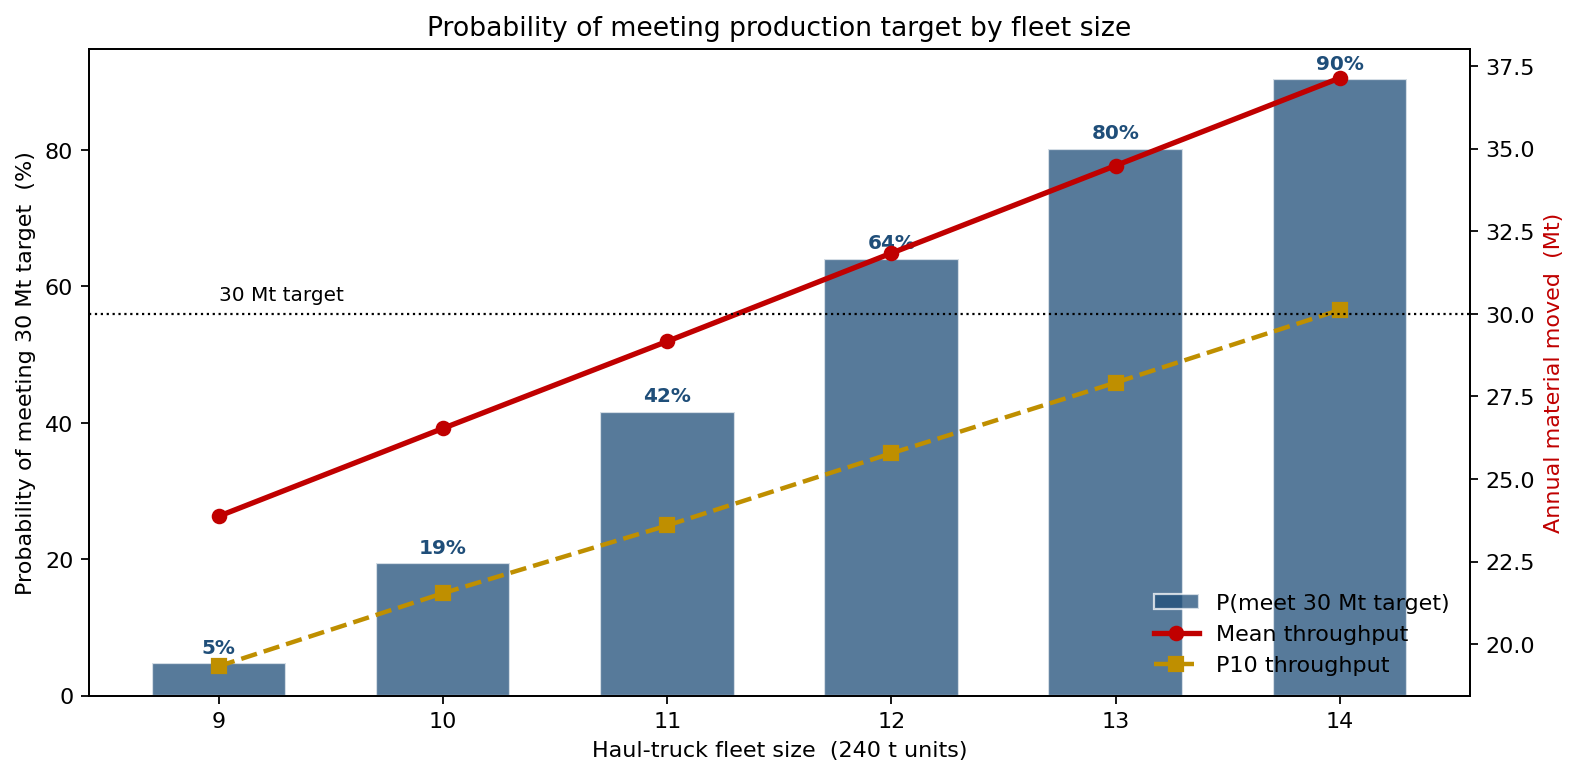
Each added truck buys a step up in the probability of clearing the 30 Mt plan: 42% at eleven trucks, 64% at twelve, 80% at thirteen, 90% at fourteen. That curve — not a single mean-throughput number — is what the capex paper actually needs.
Where the throughput really lives
Throughput per truck is the product of four uncertain quantities, each with a defensible distribution family:
- Cycle time — Triangular 20 / 24 / 32 minutes per round trip (pit floor to crusher and back), calibrated to time-and-motion studies through wet and dry seasons. The right tail reflects ramp queue effects when more than 70% of the fleet is in motion.
- Mechanical availability — Beta with mean 85%, sd 6%. Beta because availability is a fraction on [0, 1] and the data show clear left skew (most months fine, occasional bad months from major component failures). The Weibull MTBF on engine rebuilds (shape 1.6, scale 320 hours) sits underneath this aggregate.
- Operator utilization — Beta with mean 80%, sd 7%. Captures shift handovers, weather stops, blast clearances.
- Effective working hours — 6,800 per year per truck after planned maintenance.
The per-truck mean is roughly 2.65 Mt of material moved per year. Eleven trucks gives a mean of about 29.2 Mt — already short of the 30 Mt target on the mean alone — and the probability of actually clearing 30 Mt in any given year is only about 42%.
Why Monte Carlo, not a point estimate?
The same multiplications that put the deterministic answer at "eleven trucks is fine" produce a wide distribution when you respect the uncertainty in every factor. The marginal twelfth truck — a $5.2M capex line item or $1.45M/yr lease — buys 22 percentage points of stock-out protection (42% → 64%); the thirteenth buys another 16 points (→ 80%); the fourteenth, 10 points (→ 90%). The probability of meeting the plan keeps climbing with every truck, but each truck costs the same to add while buying fewer points than the last. That declining return on probability is what the deterministic mid-case cannot draw, and it is exactly what the GM needs to defend the capex paper to the executive committee.
The marginal value of the next truck
Plotted differently — mean throughput delta from adding the Nth truck:
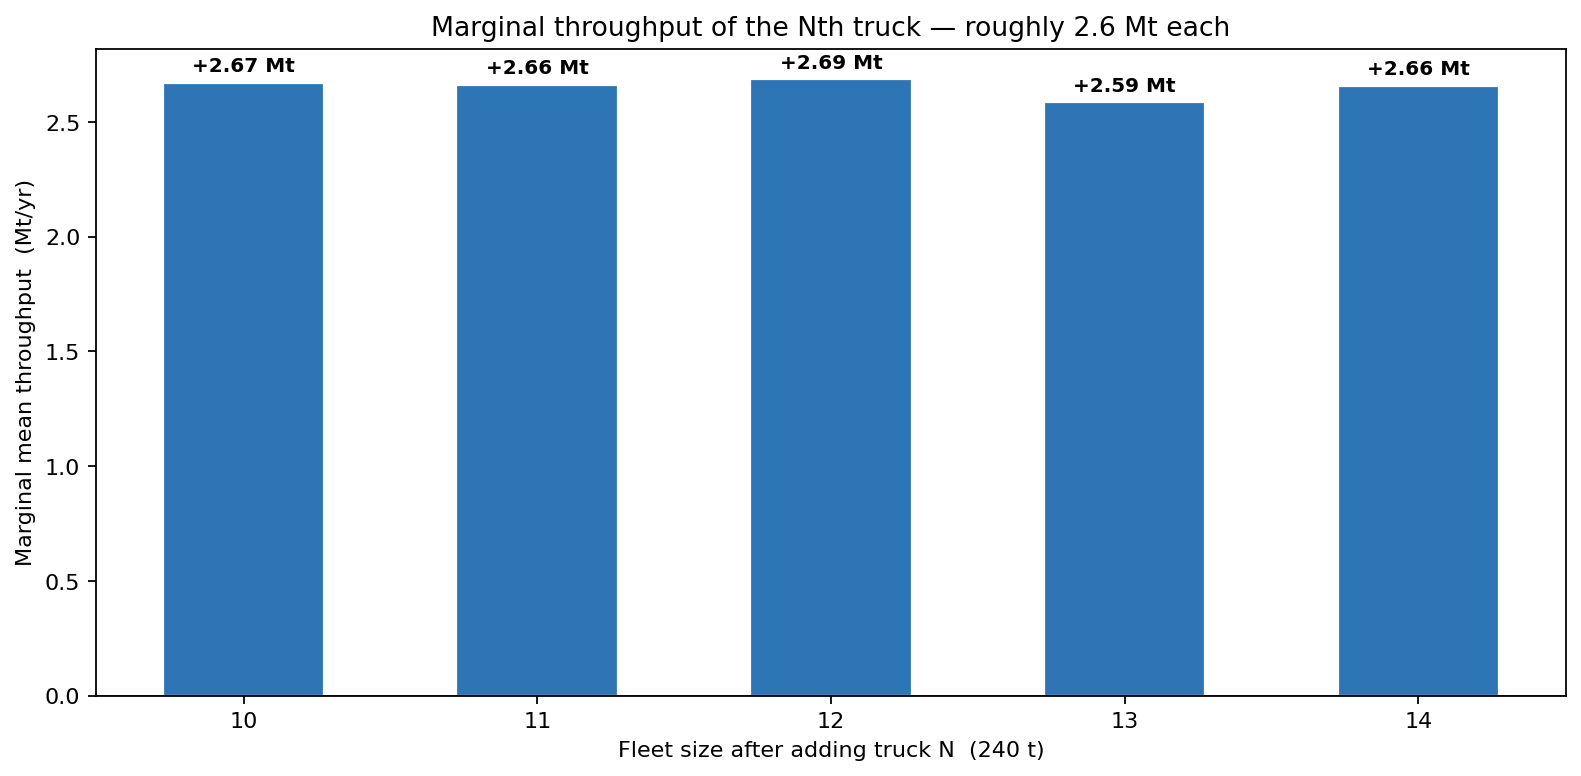
Every truck from the tenth to the fourteenth adds almost exactly the same mean throughput — between 2.59 and 2.69 Mt/yr. There is no haulage-side congestion in this model: throughput scales linearly with fleet, so the diminishing return lives entirely in the probability curve above (each truck adds the same tonnes, but those tonnes clear an ever-higher target with ever-smaller probability gains), not in the mean tonnes themselves. If anything kinks this line it will be a loading-face or shovel-capacity limit that the haulage model does not yet contain — which is precisely why the operations team commissioned a shovel-capacity study to test where that ceiling sits.
Buy or lease the fleet?
With the size question framed, the ownership question is its own simulation. Buying the eleven-truck fleet outright is a $57M capex hit and $12.1M/yr OPEX over a five-year evaluation horizon, against stochastic copper revenue at $8,500/t ± 22% (LogNormal). Leasing is zero capex and $16M/yr.
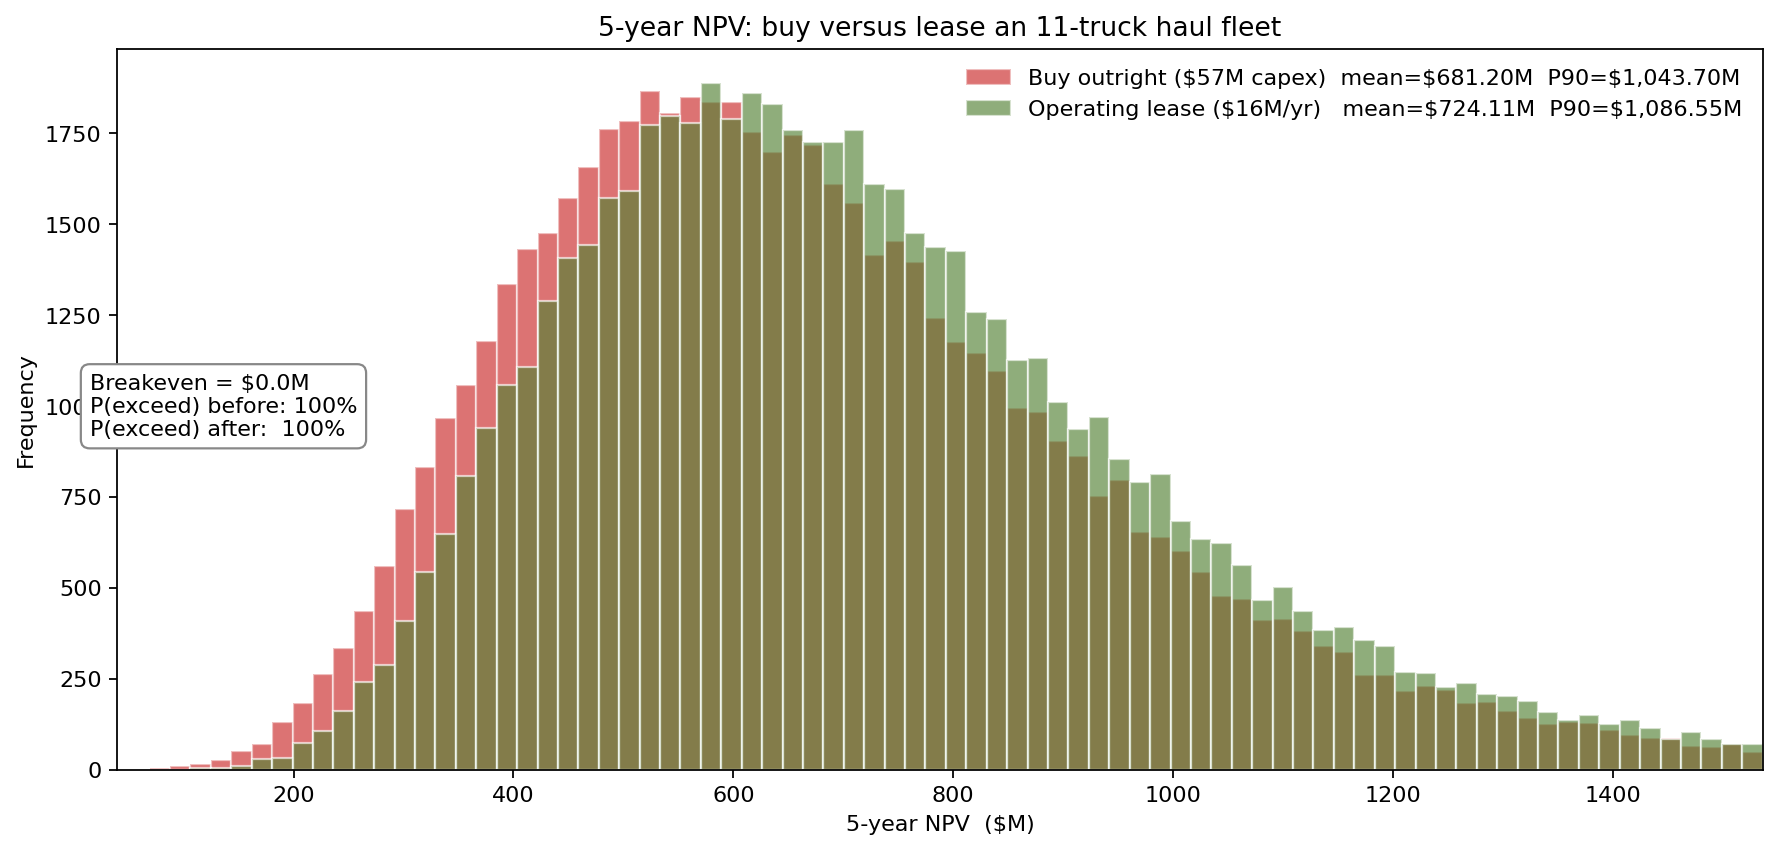
At these assumptions both paths are comfortably NPV-positive — neither distribution crosses zero across 60,000 trials — but lease wins on the mean, $724M versus $681M, and on the P90, $1,087M versus $1,044M. Over a five-year horizon the lease's higher annual charge ($16M/yr versus $12.1M OPEX) is more than offset by avoiding the $57M up-front capex, whose lost time-value the buy path never recovers inside five years. The model's verdict is therefore the opposite of the gut instinct to own the iron: on a five-year copper-revenue case, leasing is the higher-NPV choice, and the buy case only becomes competitive if the evaluation horizon is stretched to amortise the capex or a residual-value credit is added at year five.
What actually moves the NPV
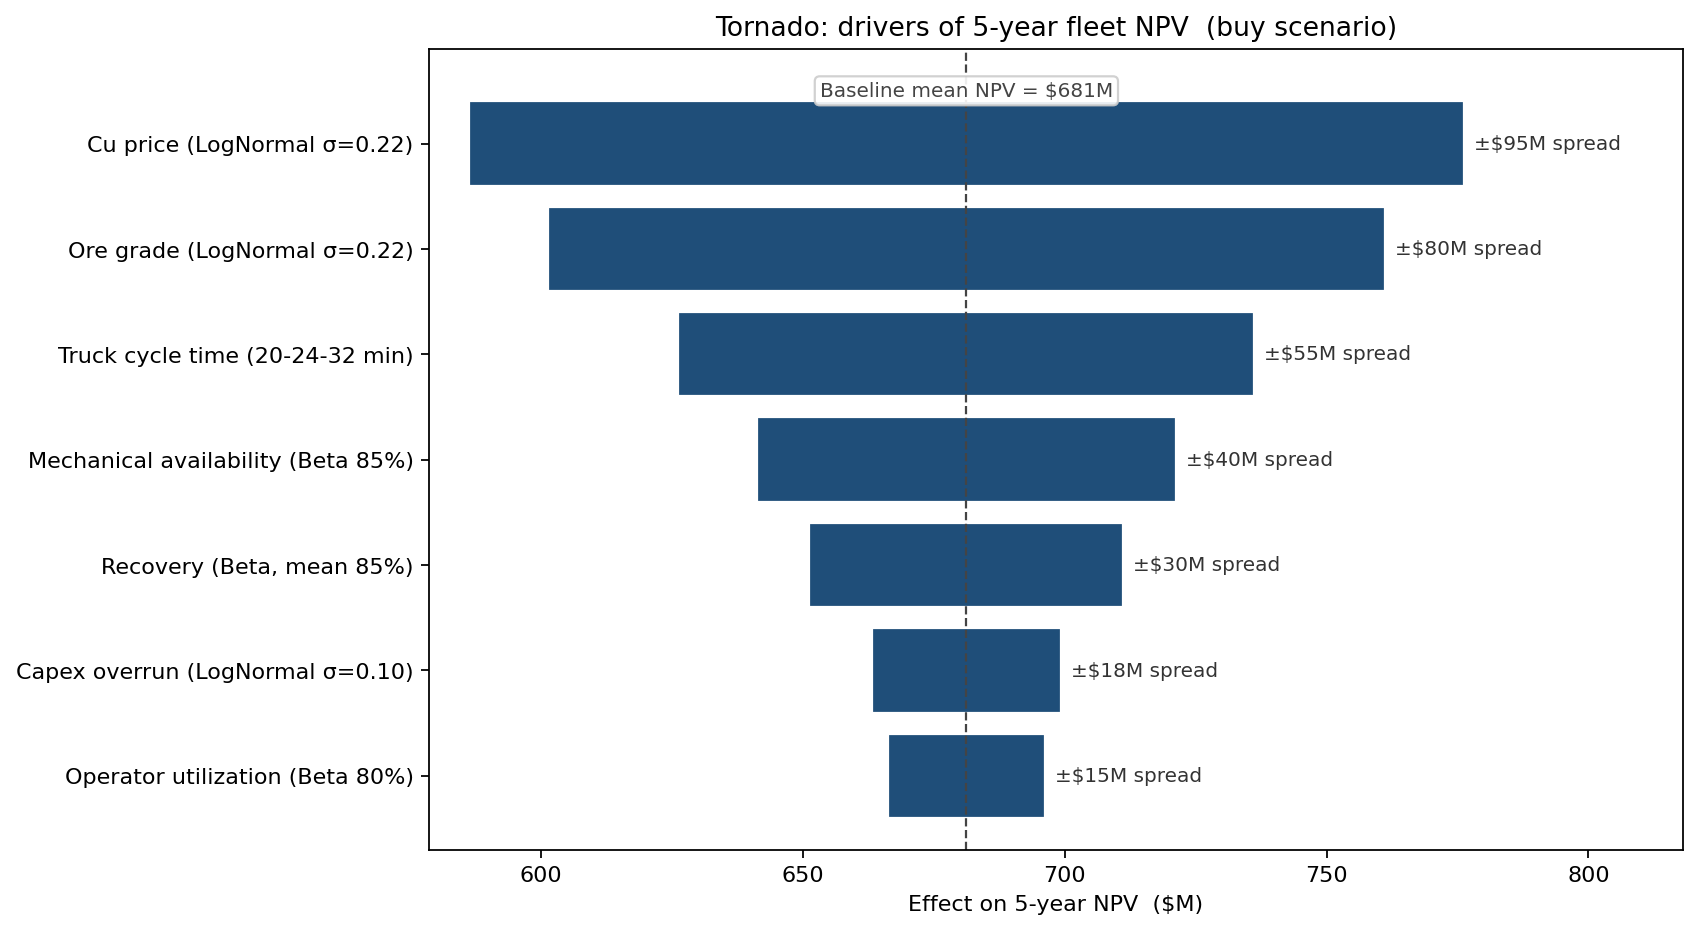
Copper price and ore grade dominate — neither of which the operations team controls. Cycle time is the largest controllable driver and ranks third: the haul-road grading programme, the loader-queue management, and the operator-shift patterns all move the cycle-time distribution. Mechanical availability ranks fourth, which justified the predictive-maintenance instrumentation project on the wheel-motor brushes — a $1.4M spend that the simulation valued at roughly $9M of expected NPV lift via a 3-point bump in availability.
What changed
- Fleet expanded toward thirteen trucks, with the lift in P(meet 30 Mt target) from 42% (eleven) to 80% (thirteen) as the headline number on the capex paper.
- Lease chosen over outright purchase for the five-year horizon, on the strength of the higher mean ($724M vs $681M) and P90 NPV — the buy case re-opened only for a longer horizon or residual-value credit.
- $1.4M predictive-maintenance retrofit funded on the strength of the availability tornado bar.
- Shovel-capacity study commissioned to locate the loading-face ceiling that the haulage-only throughput model does not yet contain.
ModelRisk Functionality Used
- Triangular cycle-time fits from time-and-motion studies, refreshed quarterly and rerun against the same fleet model.
- Beta availability and utilization with method-of-moments parameterisation — no draws outside [0, 1].
- Fleet-size sweep from 9 to 14 trucks, each run as its own 60,000-trial simulation, producing the production-probability curve directly.
- Buy-versus-lease NPV overlay with copper price as the dominant common driver in both branches.
- Tornado on five-year NPV to rank controllable versus market drivers and steer the year's improvement spend.
- Marginal-throughput delta computed from the sweep to separate the constant per-truck tonnes from the declining probability gain each truck buys.
Fleet sizing is not the answer to "how many trucks satisfy the spreadsheet" — it is the answer to "what is the cost of a one-percentage-point lift in the probability of hitting the production plan, and where on the curve does the next truck stop earning that probability?" Monte Carlo simulation in ModelRisk is what turns that question into a decision instead of a debate.