

Industry: Manufacturing
Product: ModelRisk
Application: Portfolio Supply Chain Risk with Regional Copula
When Three Taiwan Suppliers Fail in the Same Year: A Copula-Based Supply Chain Risk Model
A consumer-electronics OEM had a 12-supplier portfolio across five Asian regions and was carrying its supply-chain VaR on a spreadsheet that assumed supplier-event independence. The independence model reported a 99% annual VaR of $48M. When the same portfolio was rebuilt with a Gaussian copula linking same-region suppliers — calibrated to twenty years of Asian-region disruption history including the 2011 Tōhoku earthquake, the 2021 Taiwan drought, and the 2022 Shanghai lockdown — the 99% VaR rose to $58M, a 20% widening of the tail. The $10M gap is exactly the kind of capital understatement that the regulator's stress test calls a "diversification fallacy", and the kind of number that, once visible, changed the supplier-qualification budget for the next two years.
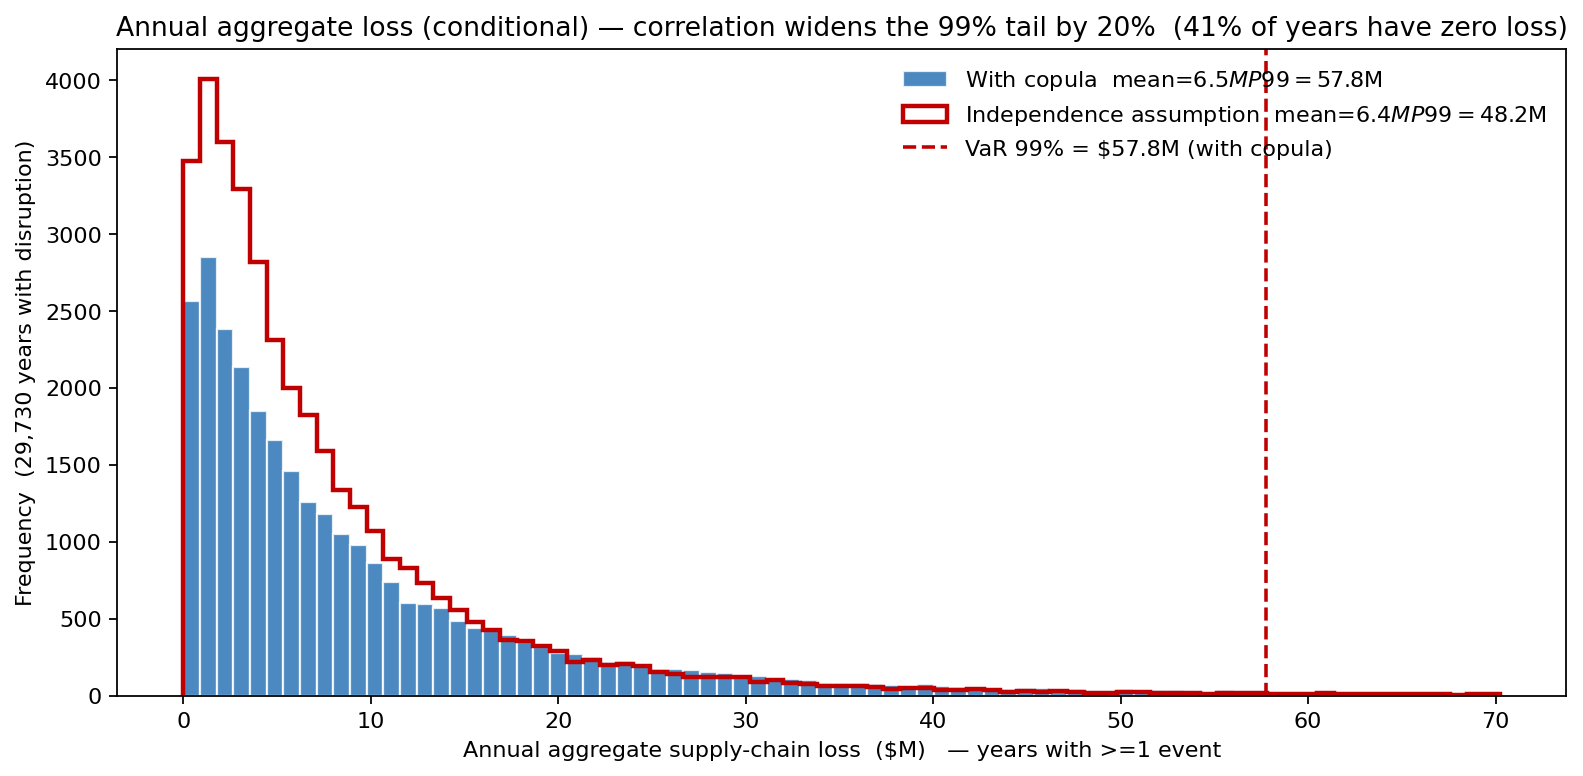
The two distributions share a mean — copulas preserve the marginals — but the filled copula distribution drags a visibly fatter right tail than the independence outline. The entire $10M of additional 99% VaR lives in that gap between the two curves, and it is invisible to any model that assumes suppliers fail one at a time.
Independence is the wrong default
The portfolio has 12 suppliers across Taiwan (3), Korea (2), China-East (2), China-South (2), Vietnam (2), and Japan (1). Each supplier has an annual disruption probability of 8–13% and a LogNormal severity in revenue impact ($M):
- Display panel A (Taiwan): p = 0.12, severity ~ LogNormal(median $9M, σ_log = 0.9).
- Custom SoC (Taiwan): p = 0.11, severity median $16M, σ_log = 1.0 — the largest single exposure.
- Battery cells A (China-East): p = 0.13, severity median $8M, σ_log = 0.8.
- (...and so on for the other nine.)
The default deterministic / independence-based spreadsheet treats each supplier's annual-disruption Bernoulli as independent. But the facts of geography say otherwise: a Taiwan-strait incident hits all four Taiwan suppliers; a Shanghai-region COVID lockdown hits both China-East suppliers; a Korean rare-earth export ban hits Korea's two suppliers together. The historic data showed within-region correlation between 0.50 and 0.75 across the major event types.
The copula construction
Disruption indicators were linked via a Gaussian copula with within-region correlation 0.50–0.75 and cross-region baseline 0.15. The mechanics: draw a multivariate-normal vector \(\mathbf{Z} \sim N(\mathbf{0}, \boldsymbol{\Sigma})\), map to uniform via \(U_i = \Phi(Z_i)\), and trigger an event when \(U_i < p_i\). Within-region correlation preserves the regional shock channel; cross-region 0.15 preserves the broad-macro channel; supplier-specific severity stays LogNormal.
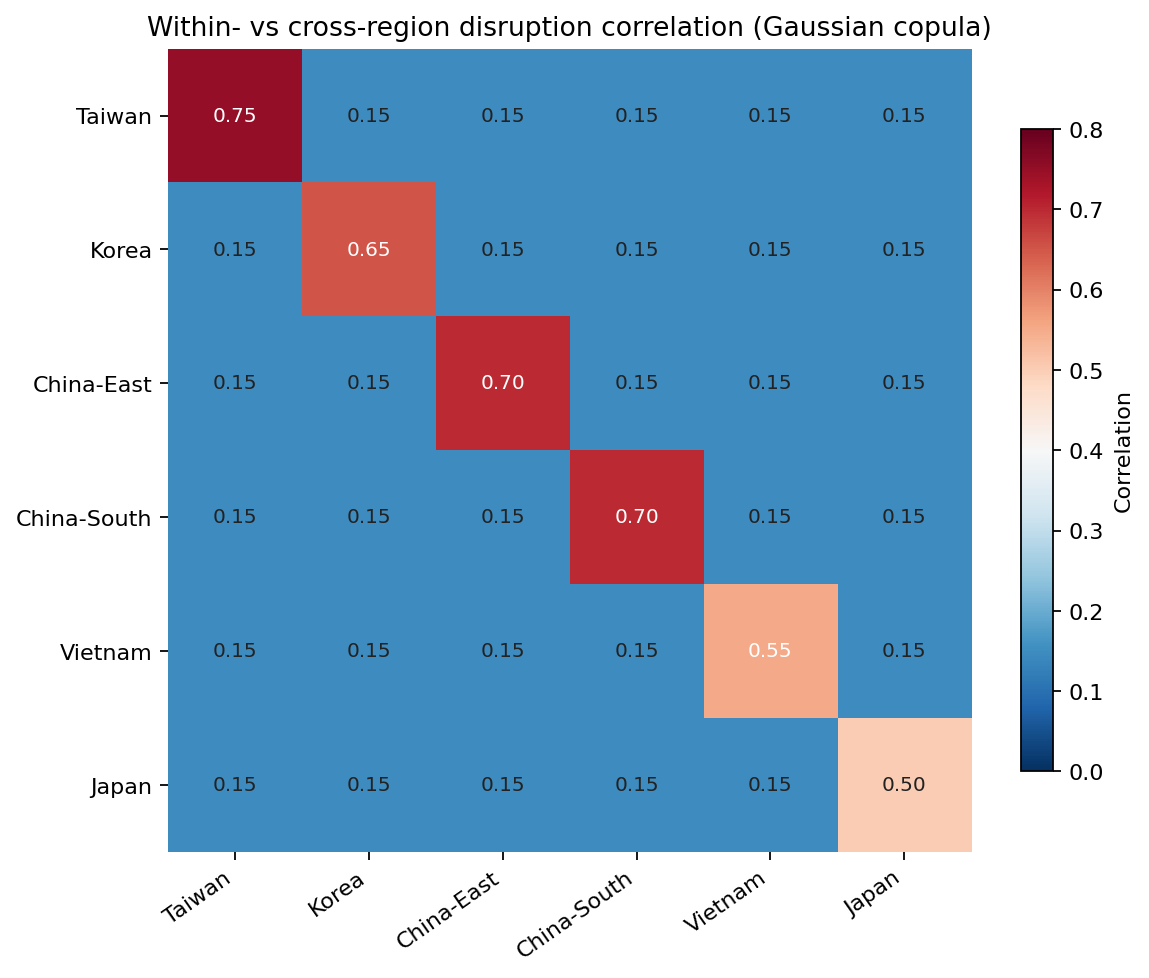
The Taiwan diagonal at 0.75 is the highest, reflecting both fab-cluster proximity and the geopolitical channel that drives those events to co-occur. China-East and China-South sit at 0.70 — primarily regulatory and logistics. Vietnam and Japan sit lower at 0.55 and 0.50. Off-diagonal blocks at 0.15 carry the global-macro term that survives diversification.
What the copula does to the tail
At least one disruption strikes in 59.5% of years; the histogram is drawn over those years to keep the zero-spike from swamping the picture, but the headline risk figures are full-portfolio (unconditional) statistics. The loss distribution is right-skewed with a thick LogNormal-driven tail. With the copula, portfolio mean loss is $6.5M, P90 $18.4M, and P99 $57.8M. The independence assumption reports the same mean (~$6.4M — copulas preserve marginals) but a tail that is shorter by 20%, with P99 $48.2M. The $10M gap is the diversification fallacy: independence pretends a Taiwan-strait event hits one supplier at a time, when in reality the historical record shows it hits the cluster together.
Plotting the histogram conditional on at-least-one-event removes the spike at zero that would otherwise dominate the chart — 40.5% of years see no disruption at all, but those years are not the ones the capital plan needs to size.
Where the tail loss comes from
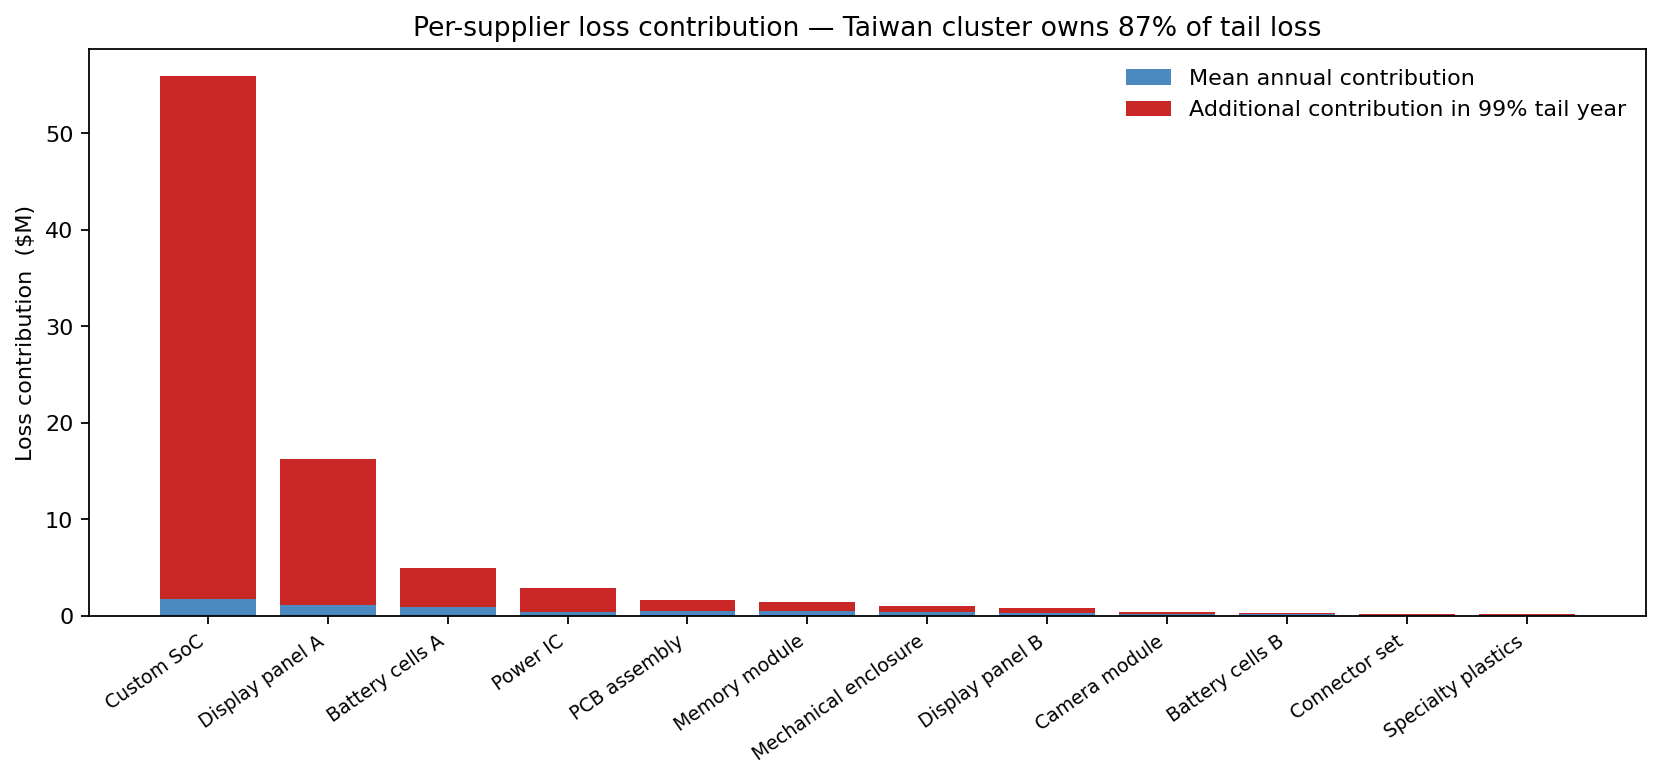
Decomposing the 99%-tail-year losses by supplier reveals that the three Taiwan suppliers together own 87% of tail-year loss, even though they are only 25% of the portfolio by count and 50% by mean-year exposure. This concentration is the copula effect compounding the severity profile — when Taiwan goes, it tends to go all at once, and the SoC (highest severity at median $16M) sits in the same regional bucket as the display panel and the power IC, so a single Taiwan-strait shock lights up all three at the same time.
Behind the Taiwan cluster the remaining contributions are an order of magnitude smaller: China-East (battery cells + connector) is the next-largest at roughly 6% of tail loss, with China-South, Korea, Vietnam and Japan trailing in the low single digits.
The mitigation scenario that pays back
Qualifying a Korean fab as an alternative supply path for two of the Taiwan exposures shifts the Taiwan within-region correlation from 0.75 to 0.30 (because qualified Korean alternatives can absorb load when Taiwan stumbles) and reduces Taiwan suppliers' individual disruption probabilities by 25% (because the qualification effectively halves the consequence of a Taiwan-strait event for those exposures).
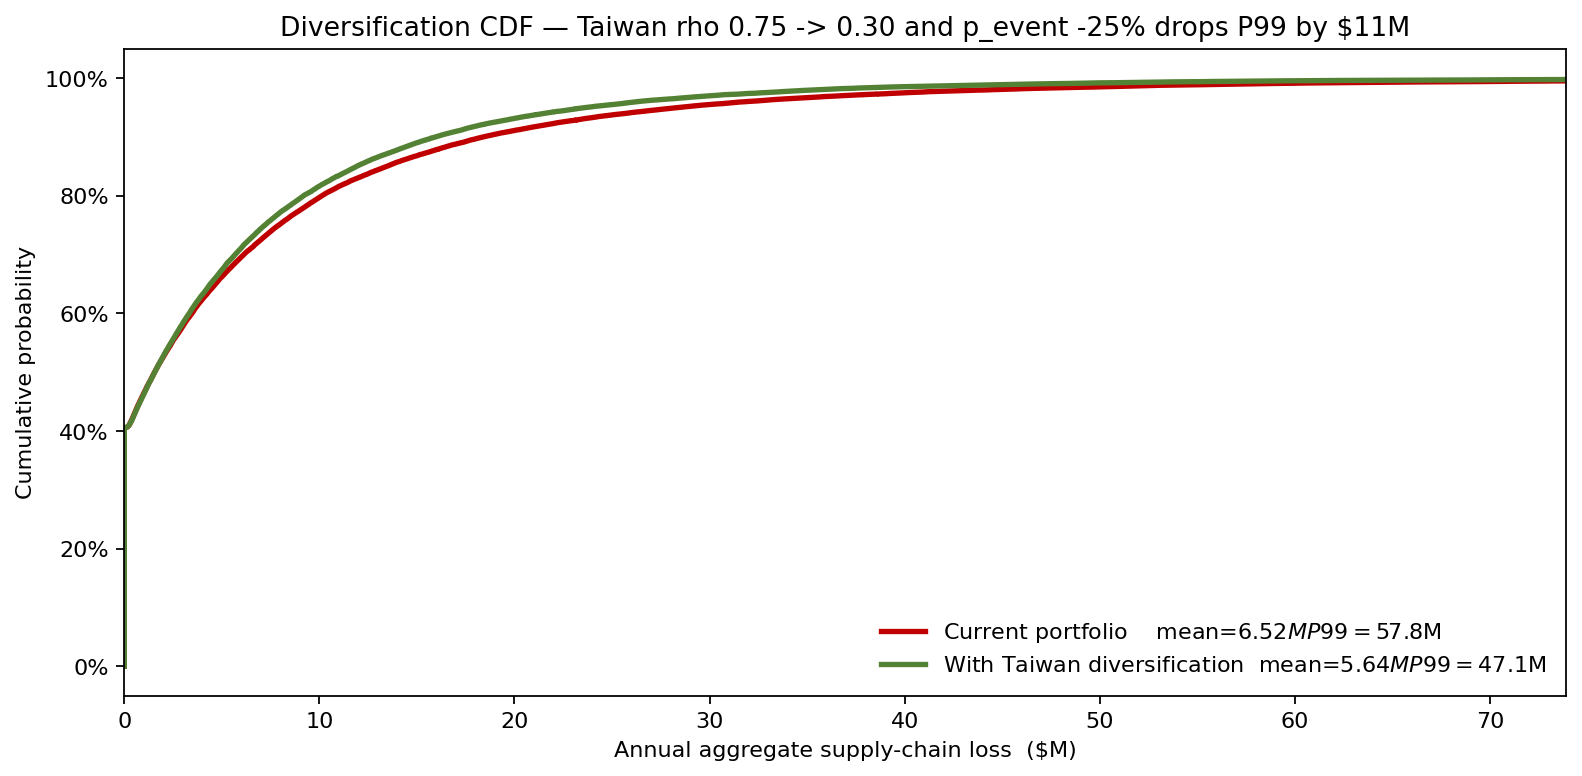
Mean loss drops $0.9M/year ($6.5M → $5.6M); P99 loss drops $11M ($58M → $47M). The mean reduction alone barely covers the $1.4M/year qualification and dual-source premium. The tail reduction is the entire business case — and the tail reduction is precisely the thing the independence-assumption spreadsheet had been pricing at half its true value.
From insight to action
- VaR 99% raised on the corporate risk register from $48M to $58M with the copula model adopted as the system of record. The $10M gap reflects diversification fallacy in the prior approach, not a real increase in risk.
- Taiwan-alternative qualification approved for two of the three Taiwan exposures, at $1.4M/year total cost — pre-justified primarily by the $11M tail reduction, not the modest mean reduction.
- China-East pair re-zoned across regions: the battery-cells/connector cluster — the largest tail contributor after Taiwan — is being requalified with a cross-region alternative to break its within-region correlation.
- The supplier scorecard now includes a copula-contribution metric — each supplier's marginal contribution to portfolio P99 — alongside its standalone severity. Procurement decisions reference this number directly.
ModelRisk Functionality Used
- Gaussian copula on annual disruption indicators with within-region correlations 0.50–0.75 and cross-region 0.15, calibrated to twenty years of Asian-region event co-occurrence data — the model that revealed the $10M understatement in the independence spreadsheet.
- LogNormal supplier severities preserving the right-tail behaviour of historical disruption costs (single-event costs ranging from $1M to $50M+ even within one supplier's distribution).
- Per-supplier tail-contribution decomposition — mean loss conditional on the year being in the 99th-percentile tail — that ranked the Taiwan cluster at 87% of tail-year loss and inverted the geographic-diversification priority.
- Counterfactual scenario re-run with Taiwan ρ moved 0.75 → 0.30 and p_event scaled 0.75, producing the $11M tail-reduction estimate that funded the Korean qualification programme.
- Excel-native copula construction via the workbook's correlation matrix — actuaries and procurement leads can edit a single cell of the correlation matrix and rerun the entire portfolio VaR, making the model a live decision tool rather than a black-box quarterly report.
The Monte Carlo lesson for portfolio supply-chain risk is that independence is the wrong null. Regional copulas are not a refinement; they are the difference between a $48M and a $58M VaR, and the difference between dual-sourcing being marginal and being mandatory.