

Industry: Manufacturing
Product: ModelRisk
Application: Statistical Process Control Scheme Selection
ARL 33 vs ARL 7: Choosing the SPC Chart That Actually Catches a 0.5-Sigma Tool-Wear Drift
A high-precision machining cell was using a classical 3-sigma Shewhart chart on five-part subgroups to police its 50.000 ± 0.050 mm critical dimension. The plant was scrapping roughly $100k/year of out-of-spec parts and triggering about 136 false alarms — a Pareto split nobody had ever sized. The quality engineer wanted to know whether switching to an EWMA chart would pay for itself, but vendor literature gives only theoretical ARL tables that assume a single shift size and no drift. To evaluate the real-cell process — small tool-wear drifts plus occasional larger shifts at tool changeovers — the team built the chart selection problem as a Monte Carlo in ModelRisk.
The simulation said: for a 0.5-sigma shift, Shewhart waits an average of 33 subgroups before signalling; EWMA signals in 7. That single number — a 4.7× faster detection at the shift size that matters most for tool wear — was the entire business case, and the ARL curves below make it visible across every shift size.
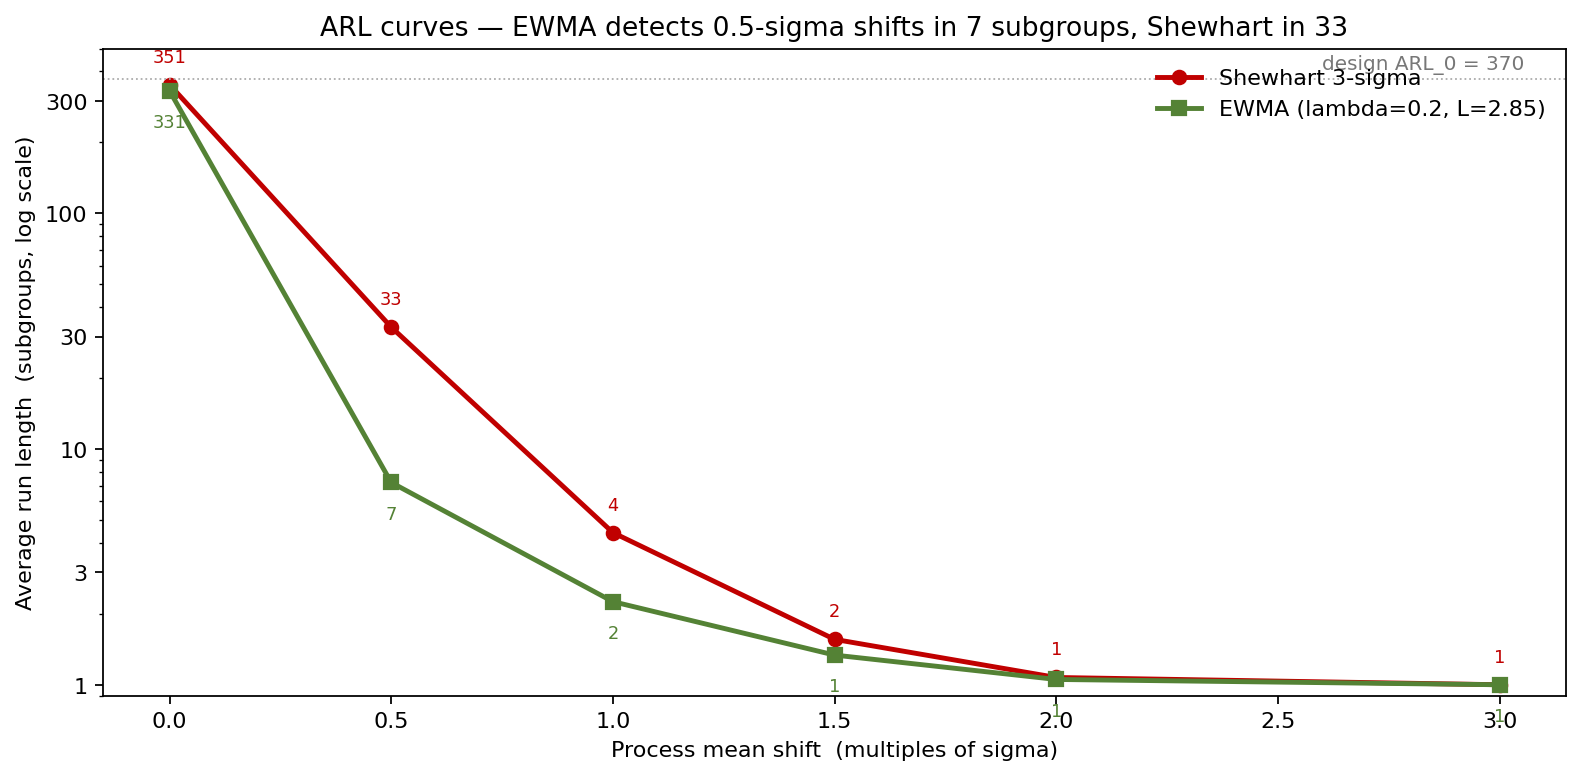
Both schemes are calibrated to roughly the same in-control ARL₀ (~340 subgroups between false alarms). EWMA dominates at the small-shift end exactly where tool wear lives; the two converge at large shifts, where any half-decent chart catches the excursion in the first subgroup.
A stochastic process, not a textbook one
The single-part dimension is N(μ_t, σ) with σ = 0.012 mm. The subgroup of n = 5 has standard error SE = σ/√5 = 0.00537 mm. The interesting modelling is in the time path of μ_t:
- Random shift event per day, P(shift) = 0.6 with size k drawn N(1.2, 0.4)σ, capped at 0.4σ minimum. Models the tool-changeover offset and material-batch step changes.
- Time-to-shift within a day is Exponential with mean 180 subgroups (~45 minutes into a 8-hour shift). Models that bad events do not announce themselves at the start of the shift.
- Cost of out-of-spec parts during the undetected window: incremental ppm rises with shift size (linear in k) at $220/scrapped part across rework and downstream impact.
- Cost of a false alarm: $650 — investigation, adjustment, verification. The line is not stopped, but an engineer is pulled off other work for ~40 minutes.
Two SPC schemes were compared on the same simulated process across 250 production days, 200 simulated years per scheme:
- Shewhart 3-sigma on subgroup means with UCL/LCL = 50.000 ± 0.0161 mm.
- EWMA with λ = 0.20, L = 2.85, using the time-varying control limits L·σ_z·√(1 − (1−λ)^(2t)).
What the ARL curves say
Average Run Length — the expected number of subgroups until the chart fires — is the right way to compare schemes. We measured ARL₀ (in-control, false-alarm rate) and ARL₁(k) for each candidate shift size. The full picture is in the curves above; the small-shift detail is where the schemes diverge:
| Shift size (σ) | Shewhart ARL | EWMA ARL | Speedup |
|---|---|---|---|
| 0.5 | 33 | 7 | 4.7× |
| 1.0 | 4.4 | 2.3 | 1.9× |
| 1.5 | 1.6 | 1.3 | 1.2× |
| 2.0 | 1.1 | 1.1 | — |
EWMA dominates at the small-shift end exactly where tool wear lives. The two schemes converge at large shifts, where any half-decent chart catches the excursion in the first subgroup.
The trace that makes the choice concrete
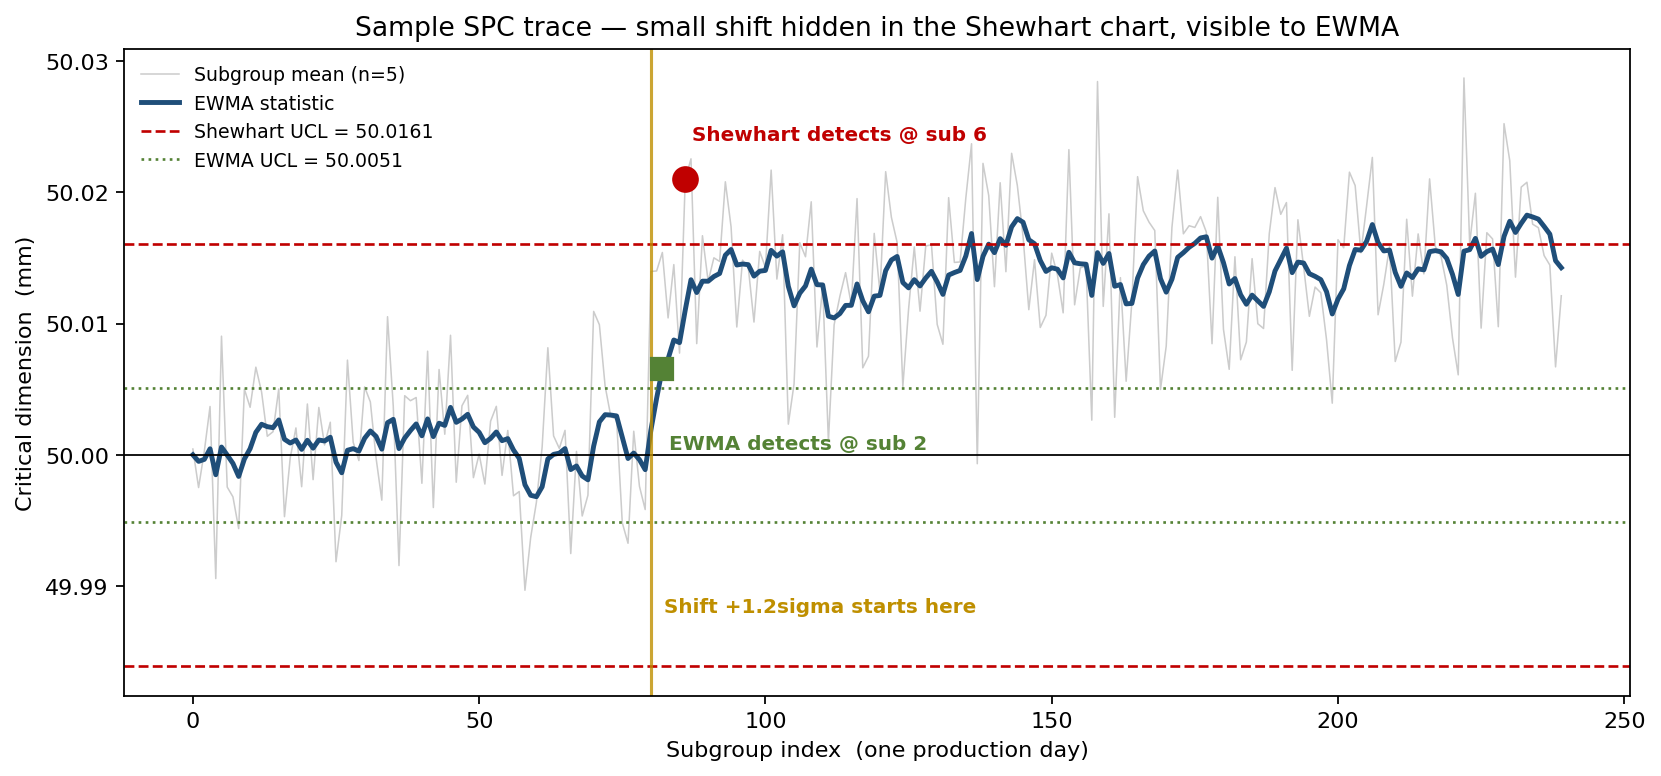
One simulated production day with a +1.2σ shift introduced at subgroup 80. EWMA's exponentially-weighted statistic crosses its UCL at subgroup 82 — two subgroups (ten parts) after the shift. The Shewhart chart's subgroup means scatter randomly above and below the post-shift mean, with no single point crossing the wider 3-SE limits until subgroup 86. Four extra subgroups means 20 additional parts produced under the shifted process before the operator gets the alarm — the bulk of which would have failed final inspection.
What the deterministic textbook misses
A textbook ARL table assumes the shift size is known in advance and constant. The real cell sees a distribution of shift sizes — small tool-wear drifts most of the time, occasional larger material-batch steps, and the cost of each undetected subgroup depends on the shift size, which the textbook does not integrate over.
The Monte Carlo integrates over the actual joint distribution of (shift size, time-of-shift, undetected ppm) and produces the cost number the textbook cannot.
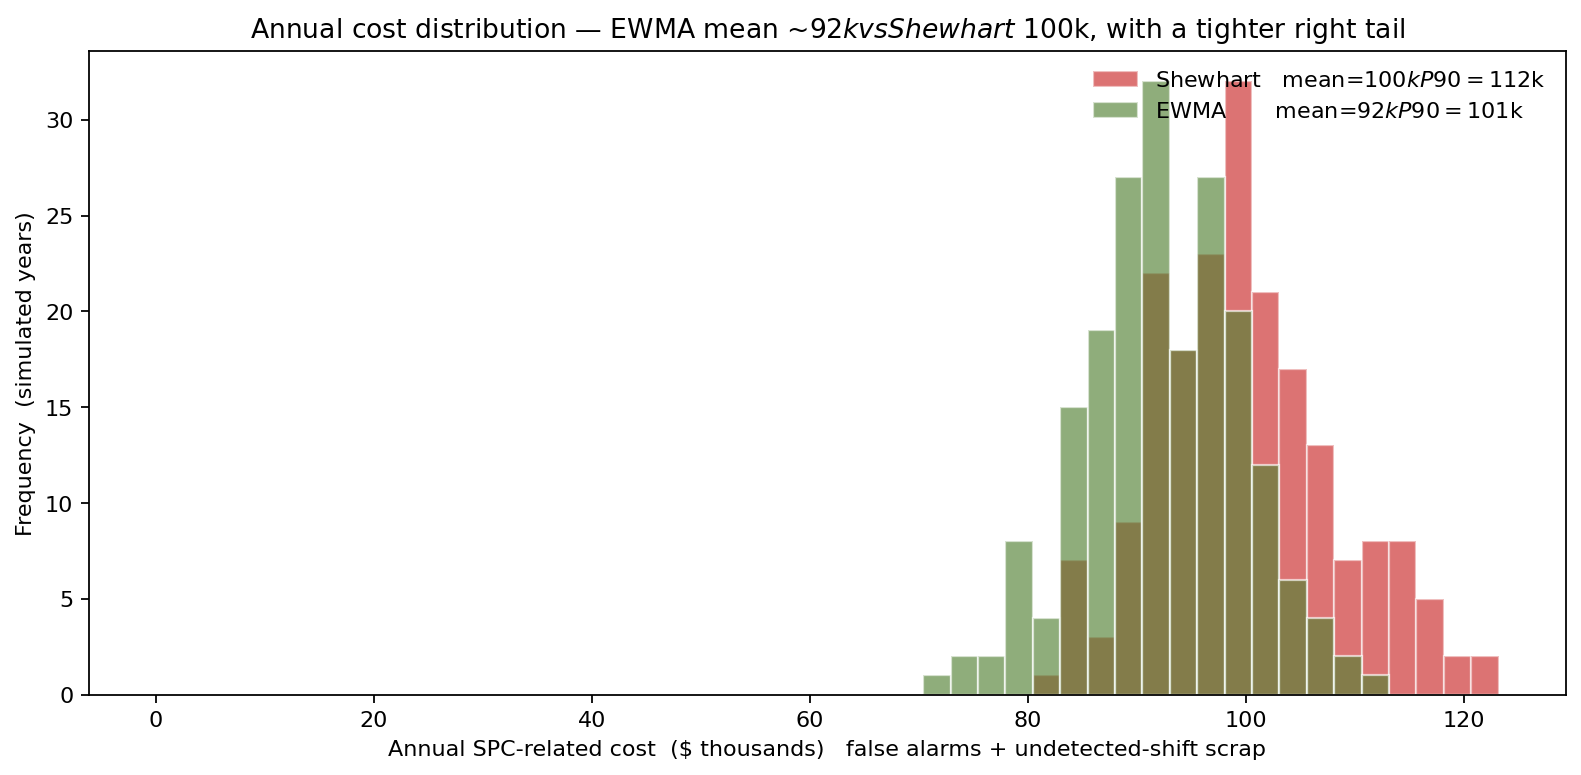
Mean annual SPC-related cost: Shewhart $100k, EWMA $92k. The headline saving is roughly $8k/year — modest at face value, but the composition of the saving is what matters.
The cost decomposition that surprised the team
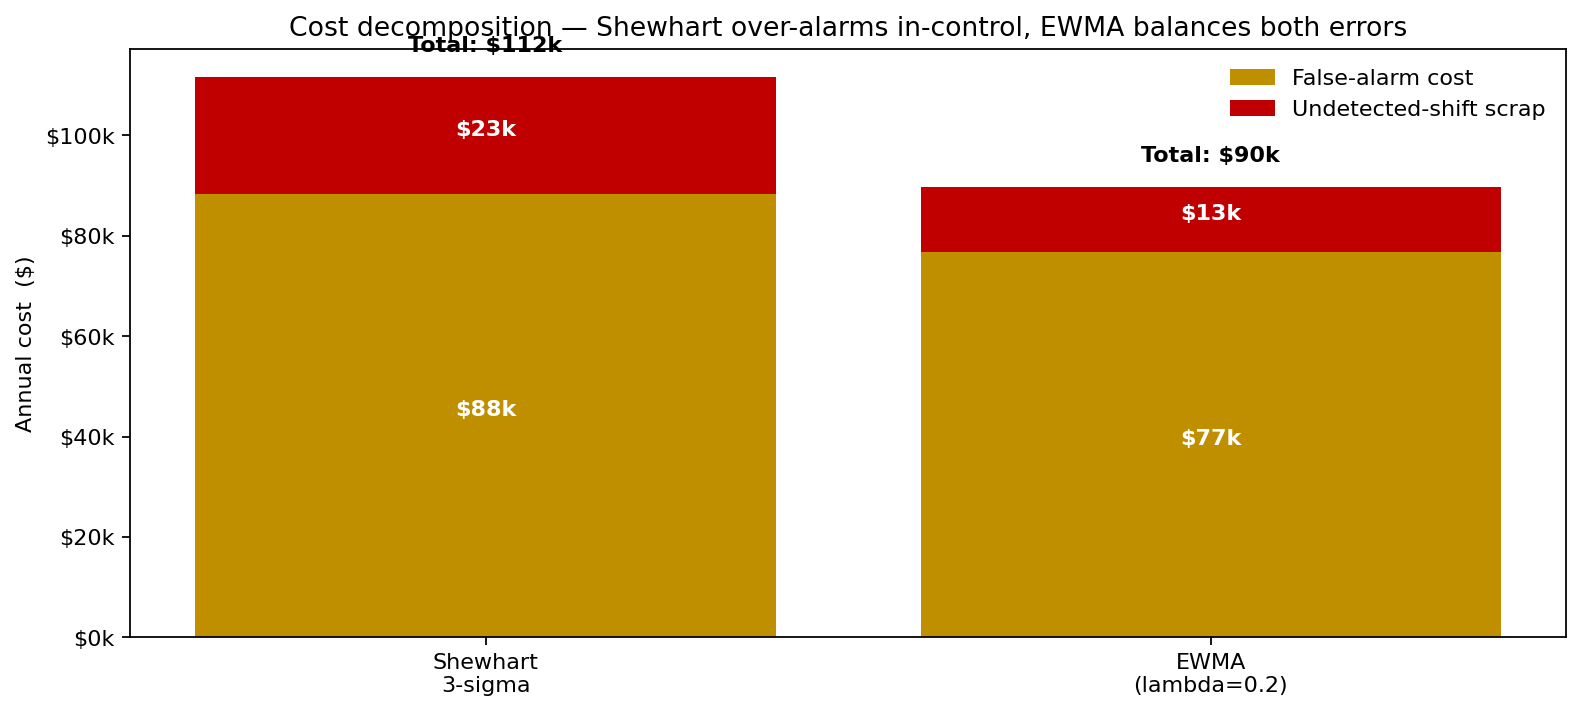
In a representative year Shewhart spends roughly $88k on false alarms and $23k on undetected-shift scrap ($112k total); EWMA spends $77k on false alarms and $13k on scrap ($90k total). The composition shift is operationally large: EWMA both fires fewer false alarms (118 vs 136 a year) and catches the shifts that matter sooner, so its undetected-scrap bill is little more than half Shewhart's. The quality engineer's hours pulled off-task drop from 91 hours/year (Shewhart) to 79 hours/year (EWMA). That changes how operators treat the chart — EWMA's alarms are worth acting on.
From insight to action
- EWMA adopted on the critical-dimension chart with λ = 0.20 and L = 2.85, calibrated to ARL₀ ≈ 330 to keep operator alert fatigue manageable.
- Shewhart kept on three secondary dimensions where shifts are typically large (≥1.5σ) and the Shewhart-EWMA gap closes — no benefit to a more complex chart there.
- Tool-changeover protocol revised: because the simulation surfaced that ~60% of shifts happen at tool changeovers within the first 45 minutes, the cell added a 3-subgroup confirmation step right after every changeover, halving the post-changeover ARL on shifts that survive the warm-up.
- A live SPC dashboard in the workbook now updates in real time from the cell's CMM feed, with both Shewhart and EWMA traces shown side-by-side for operator training during the transition month.
ModelRisk Functionality Used
- Joint stochastic process model: shift presence (Bernoulli), shift size (Normal truncated at 0.4σ), shift timing (Exponential within the day) — the integrated distribution textbook ARL tables cannot represent.
- Twin SPC simulators (Shewhart and EWMA) on the same generated process trace, so the comparison is paired rather than across separate runs — eliminates variance from the comparison.
- 200-year annual cost distribution for each scheme with false-alarm and undetected-scrap components separately tracked, surfacing that EWMA's win is more about alarm composition than dollar saving.
- Per-subgroup detection latency histograms that supplied the operator-training material — "if you see an EWMA signal at this position, expect a shift of about this size."
- What-if recalibration: changing λ from 0.20 to 0.15 in the workbook re-runs the entire annual-cost distribution in seconds, so the chart parameters were tuned to the cell rather than copied from a textbook.
The Monte Carlo lesson for SPC scheme selection is that ARL at a single shift size is the wrong KPI; ARL integrated over the actual shift-size distribution is. EWMA's 4.7× speed advantage at 0.5σ is invisible in the deterministic comparison and the entire reason for the switch.