

Industry: Manufacturing
Product: ModelRisk
Application: Process improvement — comparing kaizen projects on probabilistic ROI
Eight Kaizen Projects, $1.2M in Capex, One Winner the Spreadsheet Missed
A consumer-electronics PCB assembly plant had a portfolio of eight kaizen projects queued for the year — operator-rotation, SMT pick-and-place feeder upgrade, reflow profile tuning, AOI threshold optimisation, two automation cells, a vision-guided test fixture, and a workstation 5S overhaul. The deterministic ROI sheet (annual savings ÷ capex) ranked them cleanly: project #1 (operator rotation, $35k capex, $190k savings) had the highest ratio at 5.4×; the SMT feeder upgrade ($340k capex, $620k savings, 1.8×) ranked fourth. Total capex available was $1.2M. The deterministic sheet said: fund the top five by ratio, leave the rest for next year.
The continuous-improvement team's lead engineer noticed the ratio framework was hiding something. The operator-rotation savings depended on a single assumed defect-reduction figure (8 %), and a 14-month trial of a similar programme at a sister plant had returned anywhere from 1 % to 11 %. The SMT feeder upgrade, by contrast, had vendor data from 23 installations with a tightly-clustered 23–31 % cycle-time improvement. The two projects had wildly different spreads of savings — a difference the point-ratio simply cannot see.
The team ran every project through ModelRisk, modelling each savings driver as a distribution rather than a point and rolling each into a 3-year NPV. The savings distributions side by side show why the ratio misleads: a high ratio on a small, uncertain base is worth far less than a modest ratio on a large, well-evidenced one.
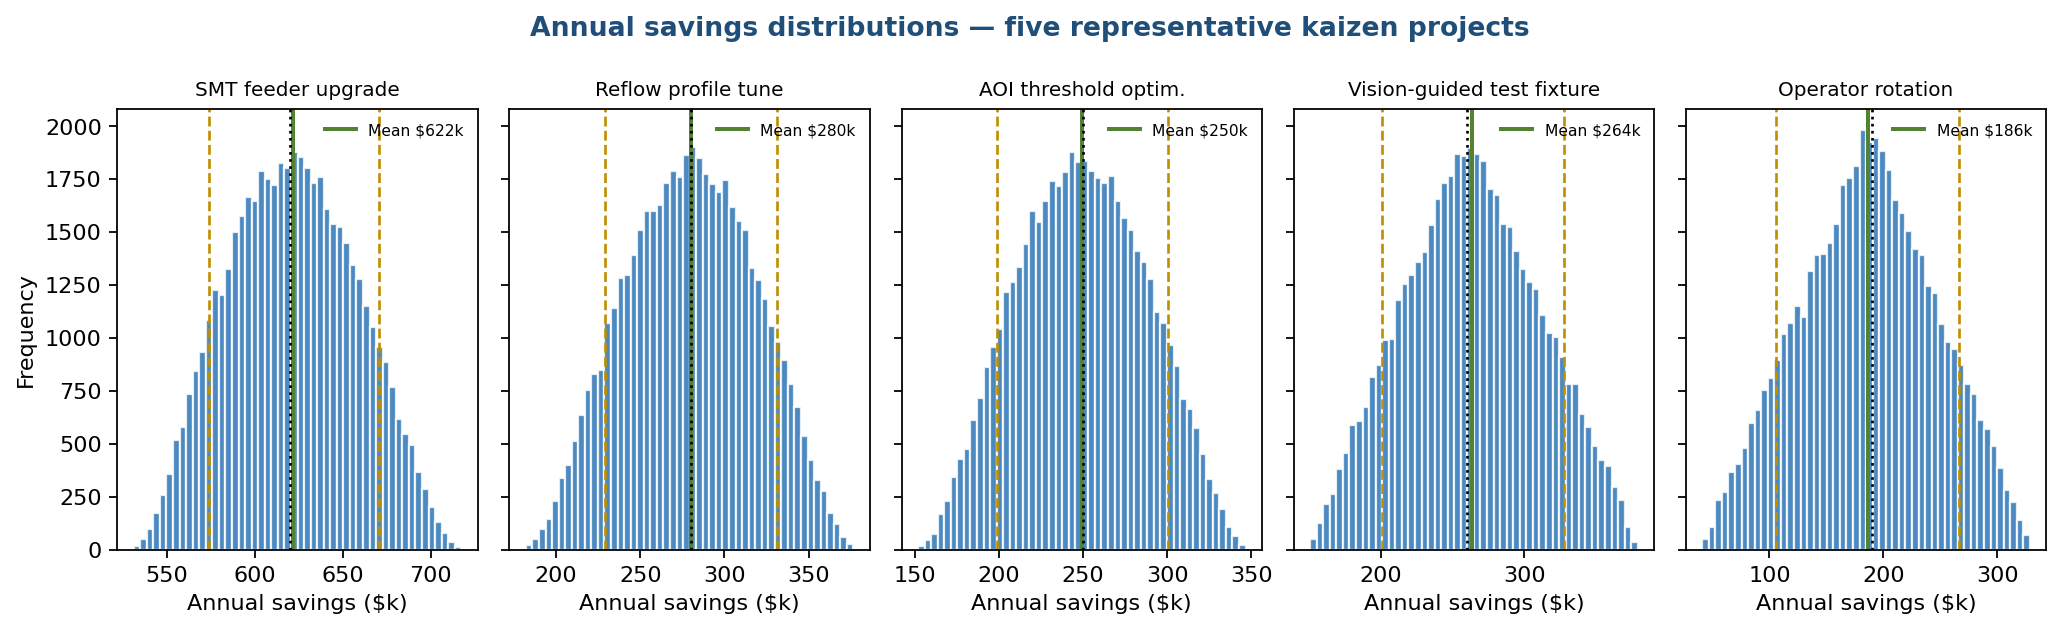
The five distributions share a deliberate feature — each project's deterministic point (dotted line) sits right at the mean, so a point-estimate ROI sheet would call them all "on plan". What the point estimate hides is the width: the SMT feeder upgrade's savings run a tight $574k–$670k (P10–P90), while operator rotation spans $106k–$266k on the same expected-value logic. When these savings are discounted into a 3-year NPV against capex, the SMT feeder upgrade delivers a mean NPV of $1.11M against operator rotation's $0.40M — even though operator rotation has triple the deterministic ratio.
Where the deterministic ratio breaks
Three structural errors lived inside the ranking spreadsheet, and the Monte Carlo model surfaced each:
Savings parameter was a point, not a distribution. For five of the eight projects, the "annual savings" cell was a single expert-judgement number; the simulation replaced each with the right distribution shape. Soft-skill projects (operator rotation, 5S) got Triangular(low, mode, high) with wide spreads reflecting historical realisation rates. Hardware upgrades with vendor data got PERT(low, mode, high) with tighter clusters around the mode. Defect-reduction projects got Beta(α, β) scaled to (0, 50 %), bounded because >50 % defect reduction is physically implausible on any single intervention.
Time-to-realisation was treated as instantaneous. Real kaizen savings ramp — typically a logistic curve from 0 to full-rate over 4–14 months. Modelled per project as a Triangular(4, 9, 14) months to 90 % realisation. A project that pays back in month 14 is worth materially less in NPV than one paying back in month 4, even at the same annual rate.
Project-to-project savings are not independent. Two of the eight projects (operator rotation and 5S) target the same defect channel; running both does not yield additive savings. The team coded a savings-cap rule (defect-channel savings ≤ 65 % of the channel's baseline cost) that the deterministic ROI sheet had silently double-counted.
Mean NPV ranks nothing like the deterministic ratio
Discounting each project's savings distribution into a 3-year NPV (at 8 % WACC) and ranking by mean NPV reorders the queue almost completely from the deterministic ratio:
| Project | Det. ROI ratio | Det. rank | Mean NPV (3 yr, 8%) | P10 NPV | NPV rank |
|---|---|---|---|---|---|
| SMT feeder upgrade | 1.8× | 5 | $1.11M | $0.98M | 1 |
| Automation cell #1 | 1.3× | 7 | $0.71M | $0.50M | 2 |
| Reflow profile tune | 2.4× | 4 | $0.54M | $0.42M | 3 |
| AOI threshold optimisation | 3.1× | 3 | $0.50M | $0.38M | 4 |
| Vision-guided test fixture | 1.6× | 6 | $0.45M | $0.30M | 5 |
| Operator rotation | 5.4× | 1 | $0.40M | $0.21M | 6 |
| Automation cell #2 | 0.8× | 8 | $0.31M | $0.15M | 7 |
| 5S overhaul | 4.3× | 2 | $0.28M | $0.14M | 8 |
The operator-rotation project was the deterministic #1 and the simulation's #6; the 5S overhaul fell from deterministic #2 to NPV #8. The SMT feeder upgrade rose from deterministic #5 to NPV #1, with the highest mean and the highest P10 — its large, well-evidenced savings base dwarfs the tiny-capex, high-ratio soft projects once everything is on a single dollar scale. Funding strictly in ratio order spends the first $65k of capex on operator rotation and the 5S overhaul — NPV ranks #6 and #8 — while leaving the single best project (the SMT feeder upgrade) until fifth in the queue. Every project clears NPV > 0 with near-certainty; the decision is not whether each pays, but how much and how reliably — which is exactly what the ratio cannot rank.
What actually drives portfolio NPV
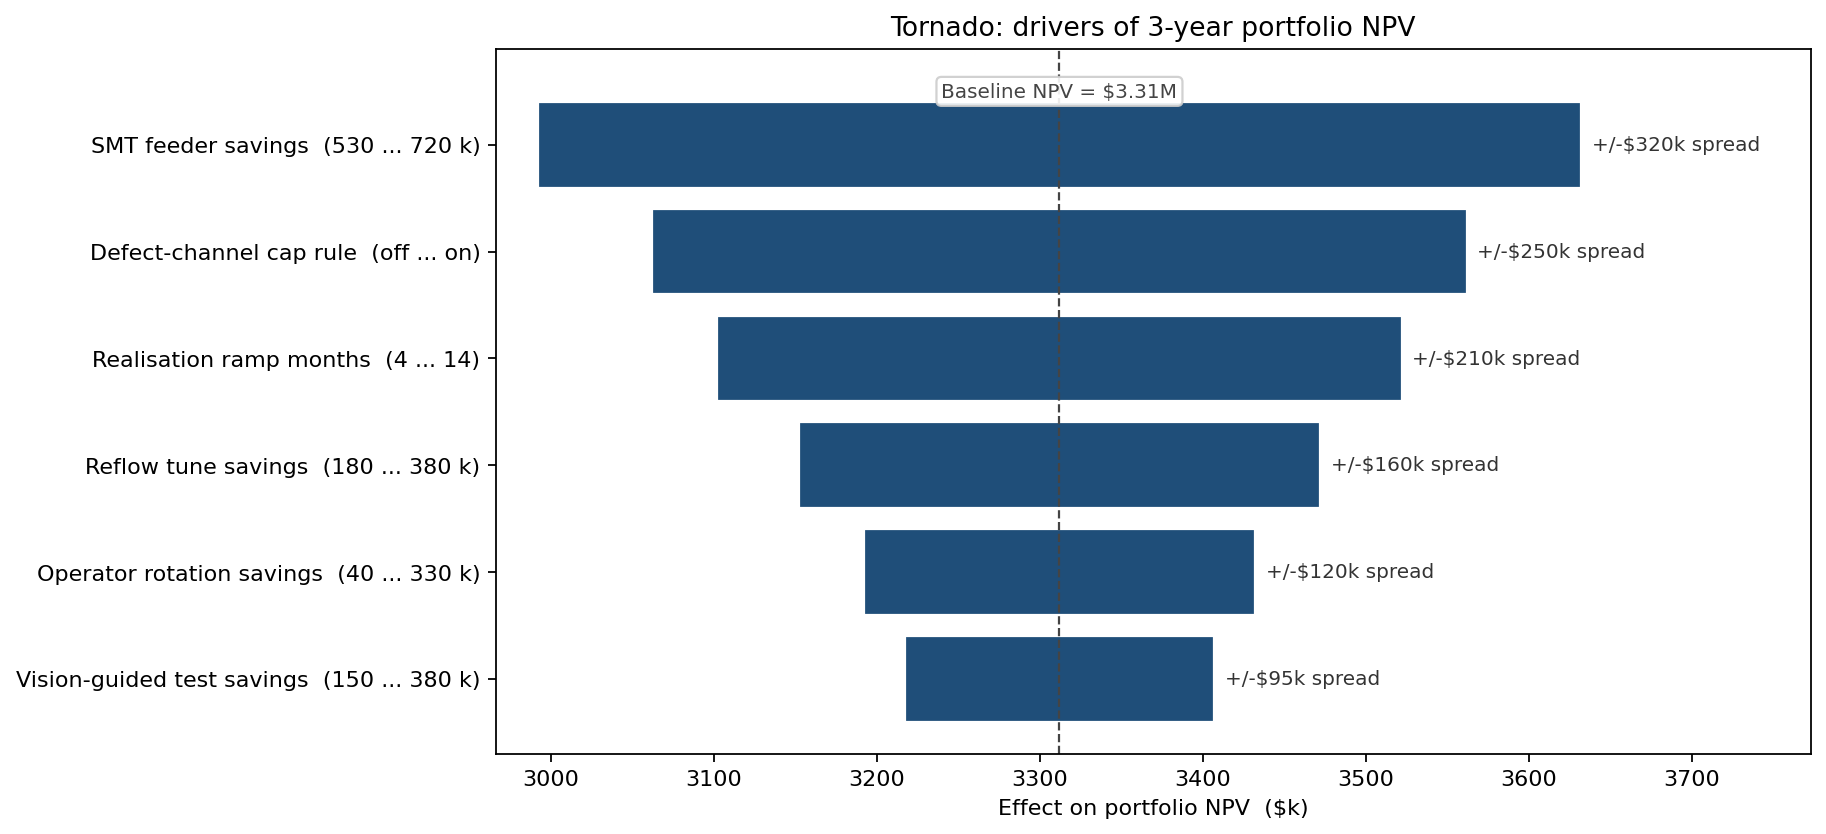
The realisation-ramp duration parameter — how many months to 90 % of full-rate savings — is the third-largest driver of portfolio NPV. That ordering changed the team's process: every project's kickoff was rewritten to include a 30/60/90-day realisation milestone so the actual ramp could be measured and used to recalibrate the next year's portfolio.
Two portfolio constructions, two outcome distributions
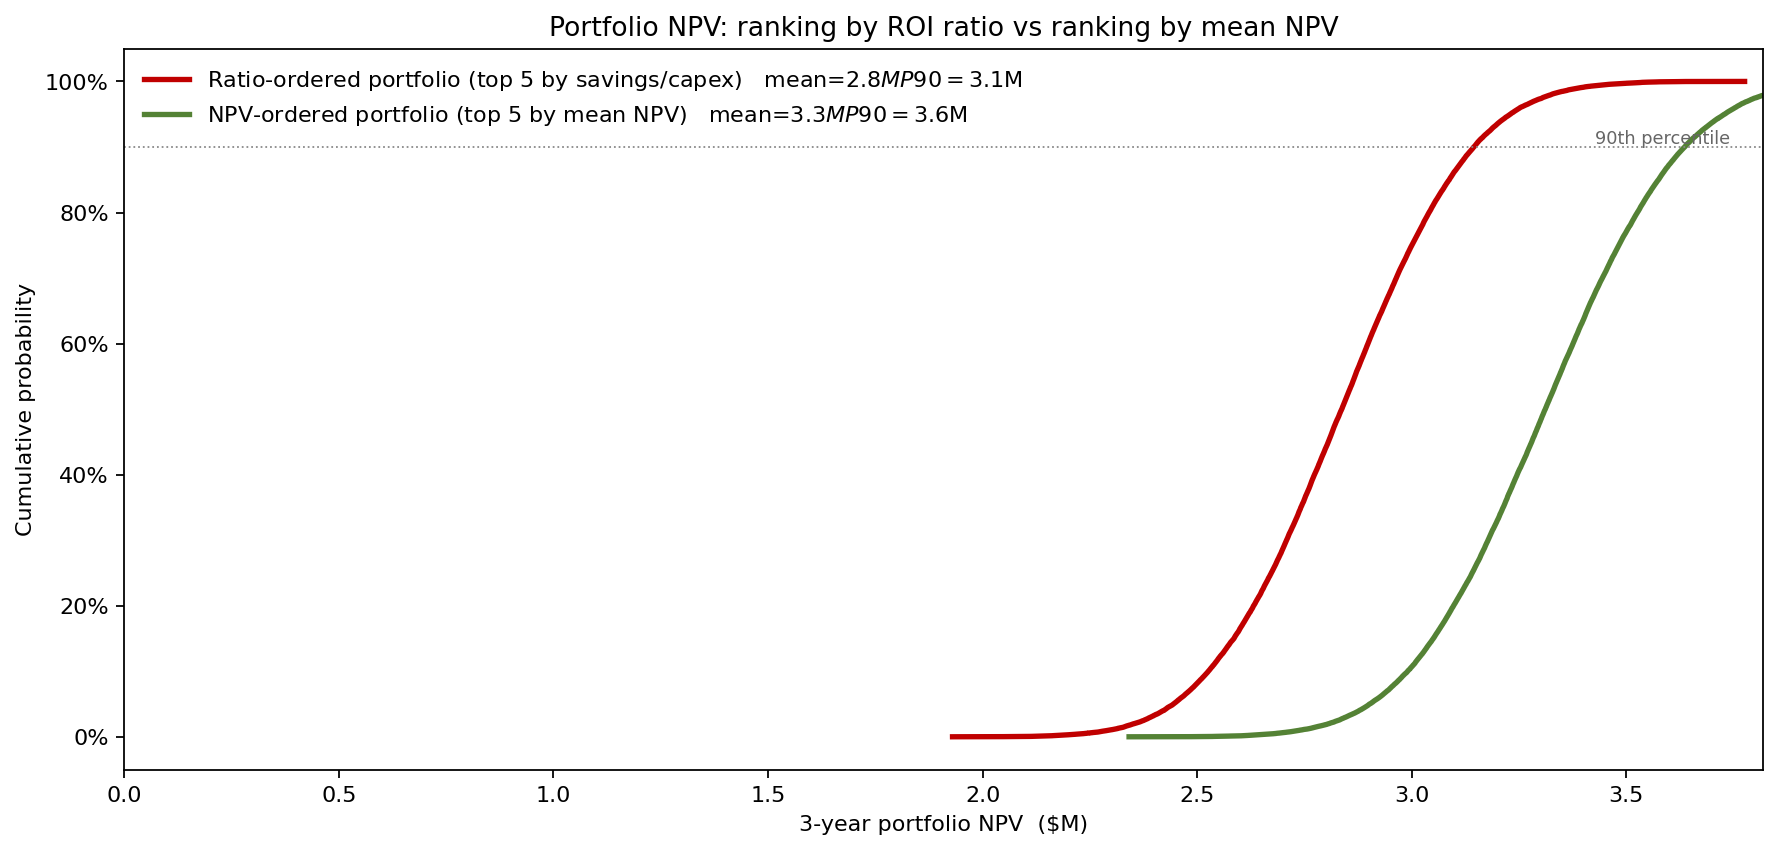
Running both top-five constructions through the same Monte Carlo (same input draws, same dependence structure) returned the comparison the executive committee actually needed:
- Ratio-ordered portfolio (top five by savings/capex — operator rotation, 5S, AOI, reflow, SMT): mean NPV $2.84M, P10 $2.53M, on $600k of capex.
- NPV-ordered portfolio (top five by mean NPV — SMT, automation cell #1, reflow, AOI, vision-guided test): mean NPV $3.31M, P10 $2.99M, on $1.06M of capex.
The NPV-ordered portfolio stochastically dominates the ratio-ordered one — its entire CDF sits to the right. It is 17 % higher in mean NPV and 18 % higher in P10, putting the otherwise-idle capex headroom (the ratio-ordered set spent only $600k of the $1.2M) to work on the high-NPV projects the ratio buried. The executive committee approved the NPV-ordered construction with one amendment: the operator-rotation project was kept in the queue but reframed as a pilot at $12k, with the remaining $23k released only on hitting a 30/60/90 measured milestone.
What the model changed
- Funding queue reordered: SMT feeder upgrade moved from ratio-rank #5 to NPV-rank #1, operator rotation from #1 to a $12k milestone-gated pilot. The NPV-ordered top five lifts mean portfolio NPV from $2.84M to $3.31M by using capex the ratio sheet had left idle.
- All future kaizen projects now require a full NPV distribution (mean and P10), not just a deterministic ROI ratio. The CFO's investment template was updated to include the distribution as a required field for any capex > $50k.
- A "savings-cap" rule for overlapping defect channels was codified in the template, eliminating the double-counting that had inflated three of the eight original deterministic ROIs.
- Realisation-ramp milestones (30/60/90 days) were added to every project kickoff, with the actual ramp data feeding back into next year's prior distributions.
ModelRisk Functionality Used
- PERT distributions for vendor-data-backed hardware upgrades (SMT feeder, AOI), with tighter tails than the Triangular default — appropriate when there's strong information about the mode.
- Triangular distributions for soft-skill projects (operator rotation, 5S) where the historical evidence shows wide bounded realisation.
- Beta distributions scaled to (0, 50 %) on defect-reduction projects, replacing point estimates that allowed implausible >50 % single-intervention reductions.
- Logistic realisation ramps parameterised by a Triangular(4, 9, 14) months-to-90 %-rate, capturing the NPV cost of slow-paying kaizen relative to fast-paying.
- Cross-project dependence rule (savings cap on shared defect channels) that eliminated the double-counting present in the deterministic ranking.
- Portfolio Monte Carlo on the candidate selections under the $1.2M capex constraint, comparing mean NPV and P10 NPV of the ratio-ordered and NPV-ordered top fives — the chart the executive committee actually picked from.
A 5.4× ROI ratio and a $0.40M mean NPV are statements about the same project, and the second one is the one that decides where the next capex dollar goes. Monte Carlo simulation in ModelRisk replaced an arithmetic ratio ranking with a dollar-denominated NPV ranking, and the funding queue rearranged itself accordingly.