

Industry: Manufacturing
Product: ModelRisk
Application: Equipment Reliability Analysis
Picking the Right PM Interval When the Hazard Isn't Flat
A four-spindle CNC machining centre on a Tier-1 automotive line carries a manufacturer-recommended preventive-maintenance interval of 720 hours. The number is convenient — it lines up with a monthly shutdown — but it assumes time-between-failures is memoryless, the textbook property of the exponential distribution. Eighteen months of failure-log data tell a different story: the empirical hazard rate on the spindle bearings rises sharply after about 500 hours, the unmistakable signature of a Weibull with shape β = 2.4. Maintaining at 720 hours is, on this geometry, maintaining about 240 hours too late.
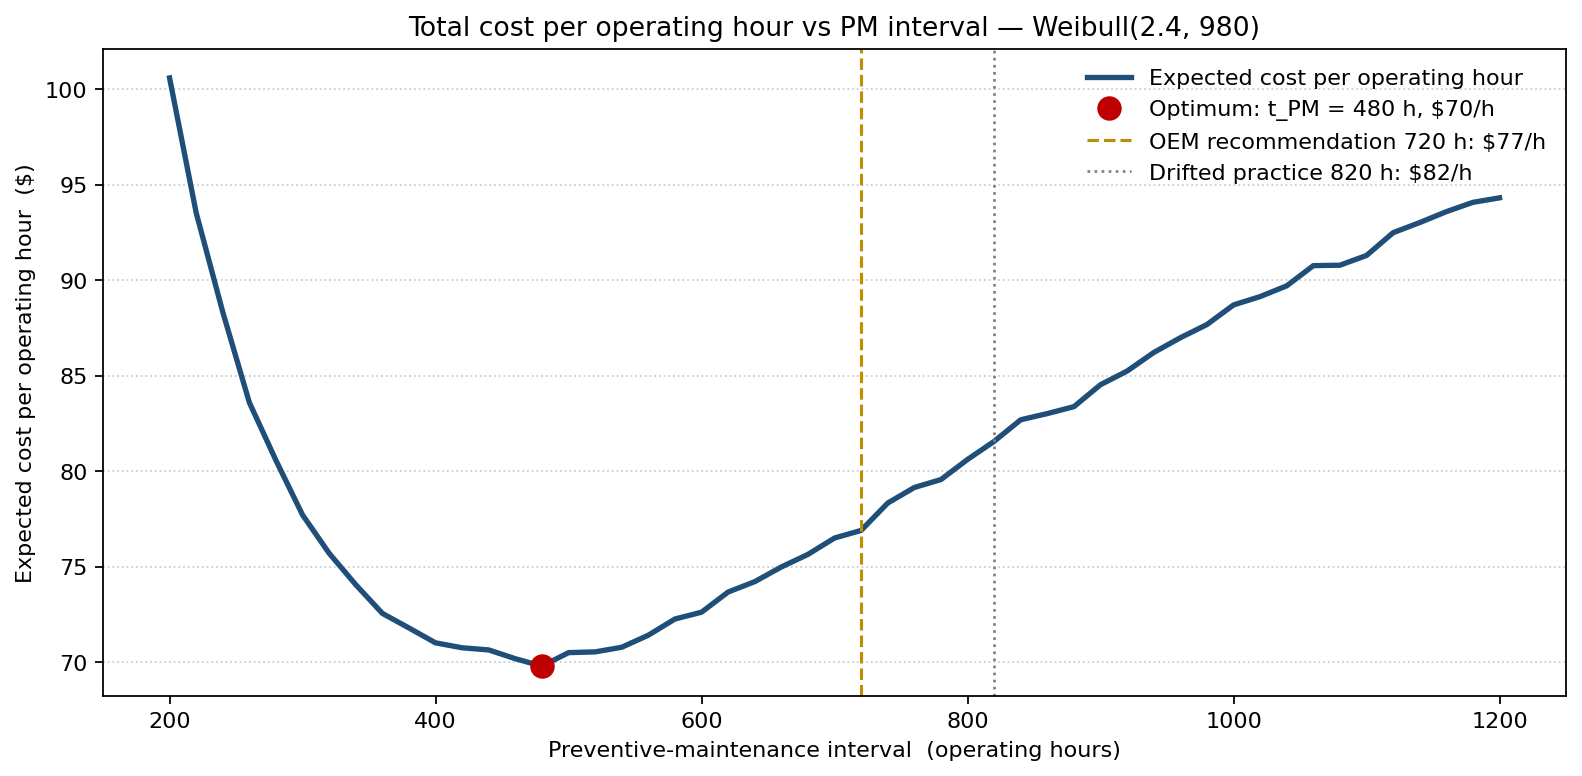
The reliability engineering team rebuilt its PM-optimisation model in ModelRisk so the maintenance interval was no longer pinned to the OEM number or to the mean time-to-failure, but to the interval that minimises the expected total cost of ownership per operating hour, computed against the full Weibull TTF distribution and a LogNormal repair-time distribution. The cost-per-hour curve below is the whole answer: it bottoms out at 480 operating hours, $70/hour, and both the OEM's 720-hour recommendation and the plant's drifted-to-820-hour practice sit firmly on the rising right-hand arm of the curve — the team had been maintaining too late, not too early.
Why Weibull, not exponential
The exponential distribution is mathematically beautiful and physically wrong for any equipment that wears. Its constant hazard means a machine that has been running 700 hours has the same probability of failing in the next minute as one that has been running 7 minutes. That assumption is fine for electronic components in their useful-life phase; it is wrong for bearings, gears, seals, cutting tools, hydraulics — anything mechanical.
The team fitted a Weibull(β = 2.4, η = 980 hours) to spindle TTF from the failure log:
\[ R(t) = \exp!\left[-\left(\tfrac{t}{\eta}\right)^{\beta}\right] \]
The shape parameter β = 2.4 is decisive. β > 1 means the instantaneous failure rate is increasing — the machine is ageing. Mean TTF under this fit is 869 hours, which is suspiciously close to the OEM's 720-hour recommendation, but the P10 is 385 hours and the P90 is 1,386 hours. The right-skew of the failure distribution is the entire reason for the optimisation problem.
Repair time was fitted to LogNormal(μ_log = 1.05, σ_log = 0.55): median 2.9 hours, P90 5.8 hours, with a long tail to 12 hours on jobs that escalate (spare-parts wait, second-shift technician unavailable). The lognormal shape is the right pick because repair durations multiply — a delay in parts compounds with a delay in technician availability — and multiplied positive errors are lognormal by the central-limit theorem in log-space.
The cost-per-hour curve, not the failure-rate curve
For each candidate PM interval t_PM, the simulation runs 50,000 operating cycles and computes:
- Probability of failing before t_PM (corrective maintenance event)
- Cost of corrective maintenance: parts + labour + production downtime at $8,400 / hour (the actual lost-contribution rate) + $35,000 of collateral damage — an unplanned wear-out failure rarely stops at the bearing; it takes the spindle, the cutting tool and the part in process with it
- Cost of preventive maintenance: $1,250 in parts and labour + 2 hours of scheduled-downtime opportunity cost ($16,800)
- Total cost per actual operating hour, summed and amortised
The optimum sits at t_PM = 480 hours with expected cost $70 / operating hour — about 9% below the cost at the OEM's 720-hour interval ($77/hour) and well below the cost at the previous practice of running closer to mean TTF, which had quietly drifted to 820 hours and was costing $82/hour. The curve is asymmetric: the left arm climbs steeply if you maintain far too early and waste good bearing life, but the right arm is the expensive one — every interval past the 480-hour optimum lets more of the wear-out failure mass through, and each of those failures carries the $35,000 collateral hit. That asymmetry, not the downtime hours alone, is the economic argument for a Weibull-aware policy.
What actually drives total cost
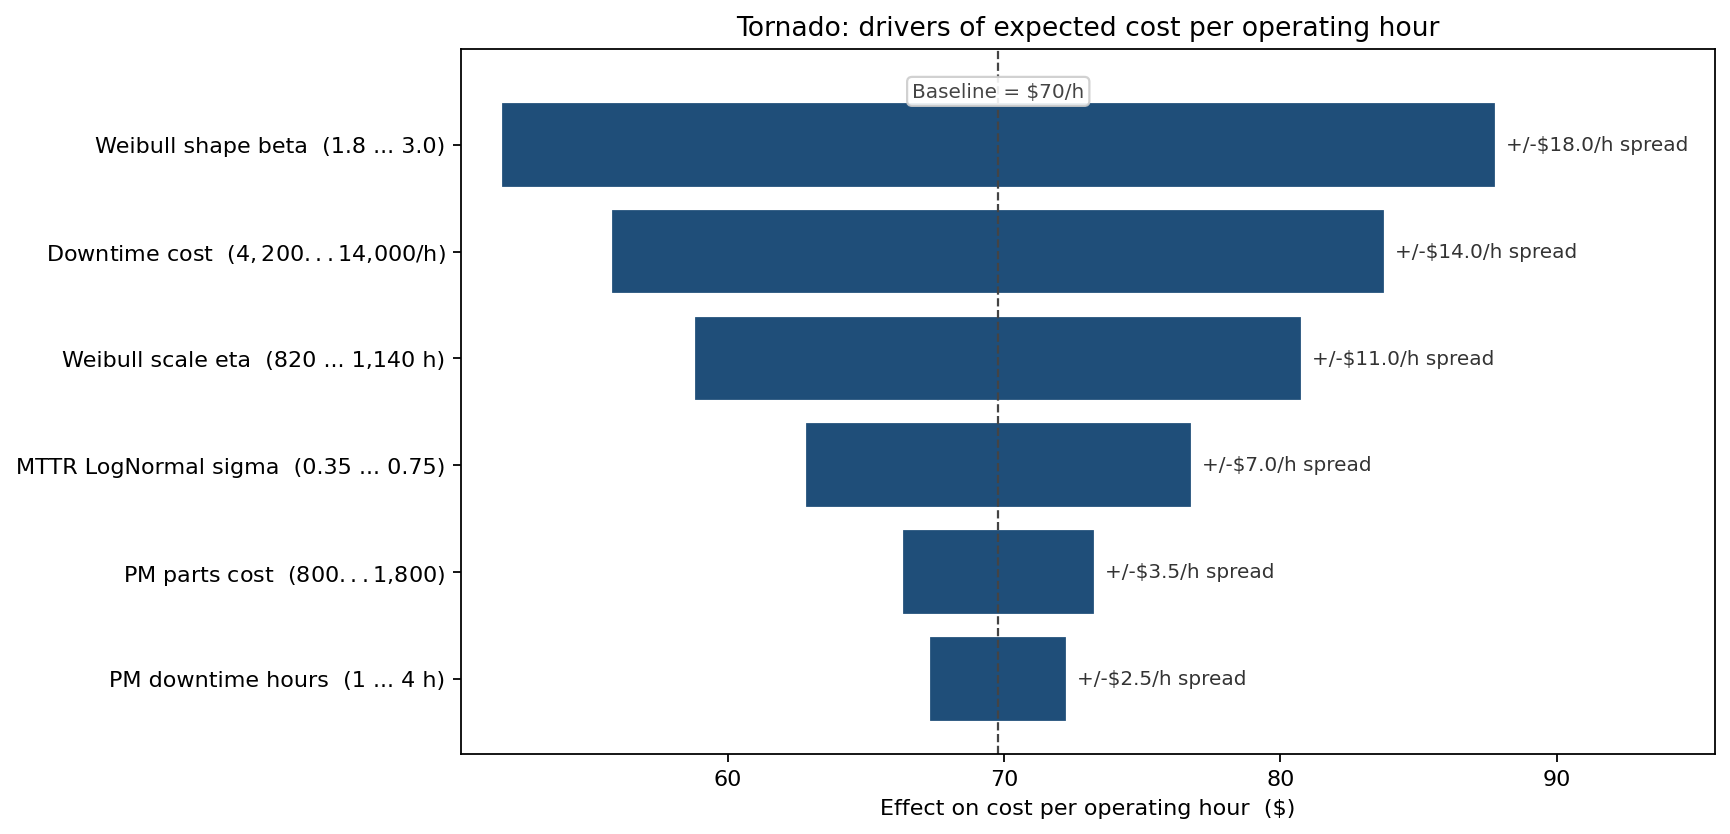
Two findings reordered the engineering programme. First, the Weibull shape parameter β is the single largest driver — and it is the parameter the team had the least empirical confidence in. A targeted data-collection effort to refine β from the next 12 months of failures was promoted above two condition-monitoring projects. Second, the downtime cost per hour is the second-largest driver. The opportunity cost of a spindle failure during a model launch peaks at $14,000/hour, against $4,200/hour during model-changeover weeks. A seasonal PM policy — tighter intervals during launch quarters — emerged from the same simulation.
Condition-based vs time-based maintenance
The team then compared the optimised time-based PM (t_PM = 480 h) against a vibration-monitored condition-based maintenance (CBM) strategy that triggers PM when the spindle vibration crosses a threshold, with a detection lead time modelled as Triangular(40, 80, 140) hours before failure.
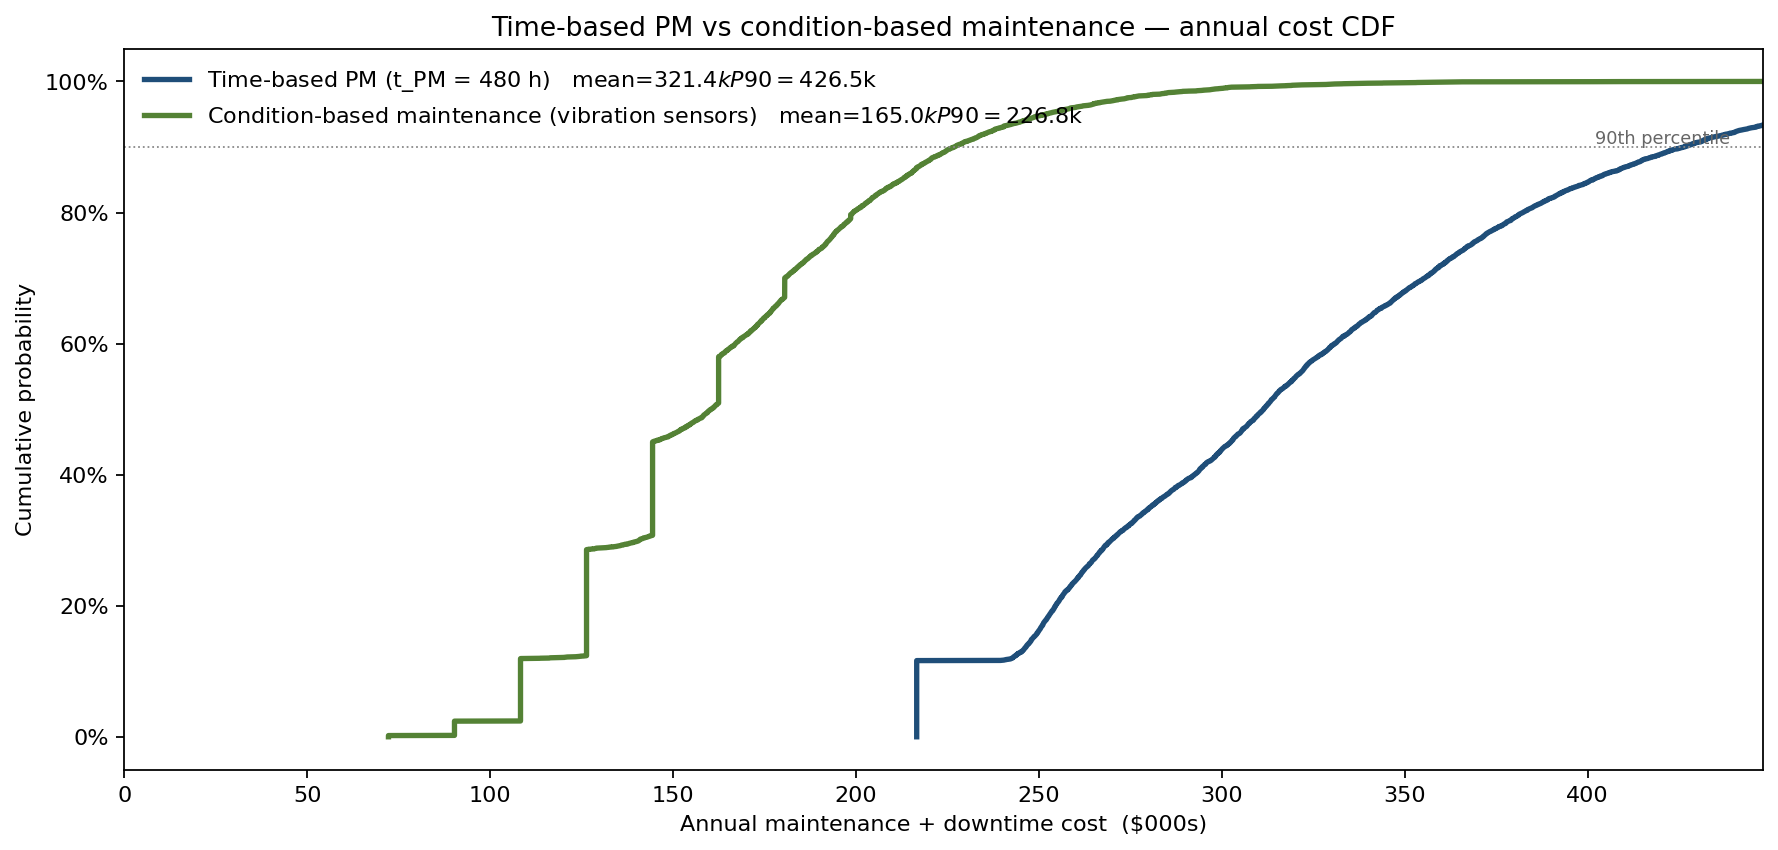
The CBM strategy lowers mean annual cost from $321,000 to $165,000 and — more importantly — lowers the P90 annual cost from $427,000 to $227,000. The tail compression is the real prize: under time-based PM, the worst 10 % of years are dominated by failures between PM intervals, each dragging in the $35,000 collateral hit. CBM catches the wear signature before the bearing lets go. The $95k investment in vibration sensors and the analytics back-end pays back inside the first year on expected savings, and the tail-risk reduction made the capital-committee approval immediate.
What the model changed
- PM interval reduced from 720 to 480 hours on the spindle, dropping expected cost/hour by about 9 % against the OEM interval and more against the drifted 820-hour practice.
- Vibration-based CBM rolled out on the four CNC centres, cutting per-machine mean annual cost from $321k to $165k — roughly $156k/year/machine — and compressing the P90 tail by about $200k per machine.
- Seasonal PM policy layered on top: tighter intervals during launch quarters where downtime contribution-cost is 3× higher.
- Reliability data programme funded: the targeted Weibull-shape data collection became the team's #1 information-investment priority, displacing a Six-Sigma project that contributed less to TCO uncertainty.
ModelRisk Functionality Used
- Weibull distribution fit on 18 months of spindle failure data, with the shape parameter β = 2.4 confirmed by a Kolmogorov-Smirnov test against an exponential alternative (p < 0.001).
- LogNormal fit on repair-time data, capturing the long-tail jobs that average MTTR hides.
- Sweep optimisation across PM intervals from 200 to 1,200 hours, with 50,000 cycles per interval point, producing the cost-per-hour curve.
- Tornado sensitivity on expected TCO per operating hour, ranking parameter uncertainty so the engineering team could prioritise data-collection over modelling sophistication.
- Comparative simulation of time-based vs condition-based maintenance with realistic CBM detection-lead-time uncertainty, justifying a $95k sensor capex on P90 tail reduction rather than mean savings alone.
A flat-hazard assumption is what makes mean-time-to-failure look like a maintenance schedule. The Weibull says it isn't, and the cost-per-hour curve says by how much.