

Industry: Legal
Product: ModelRisk
Application: Litigation outcome prediction
A trial worth $14.6M on average loses money 41% of the time
A litigation funder is staring at a $40M commercial breach claim and a defendant who has just offered $14M to make it go away. The merits look favorable — call it a 59% chance of prevailing — and the expected award, if the case is won, runs to roughly $38M. On a back-of-the-envelope expected-value calculation, going to trial looks like the obvious play. So why do experienced trial lawyers settle cases exactly like this one?
Because the expected value is a single number sitting on top of a distribution that is anything but single-valued. Run the case 200,000 times and the net trial outcome to the plaintiff averages $14.6M — barely above the $13.0M the settlement is actually worth after its own fees — but 41% of those trials lose money, paying the plaintiff's own legal costs with nothing to show for them. The settlement converts a coin-flip-with-a-tail into a cheque. The decision is not "which option has the higher mean"; it is "how much of that 41% downside are we willing to carry for a thin slice of upside?"
Where a single "probability of winning" hides the case
A litigation outcome is the product of several independent uncertainties, and each one is bounded in a way that a casual Normal-distribution guess gets wrong. The model assigns each its proper shape:
- Win on the merits is a Bernoulli event whose probability is itself uncertain. We draw that probability from a
Beta(6.5, 4.5)distribution — mean ≈ 0.59, with genuine mass on both sides of even odds — and flip the case against it. A point "60% chance" buries the fact that the firm's own read on liability is uncertain. - Liability share recovered is modelled
Beta(8, 3)(mean ≈ 0.73). Even a clear win rarely recovers 100% of the claim — comparative fault and partial causation routinely shave the award. A Normal here would happily produce shares above 1.0 or below 0. - Damages awarded are right-skewed: a
LogNormalwith median ≈ $38M and a long upside tail toward consequential and punitive damages. Most wins cluster near the median; a few run far higher. - Trial legal costs are a
LogNormal(median ≈ $4.2M), sunk whether the case is won or lost.
The net trial outcome is then win x liability_share x award - legal_costs. Composing these draws produces the headline distribution below — and it is emphatically not bell-shaped.
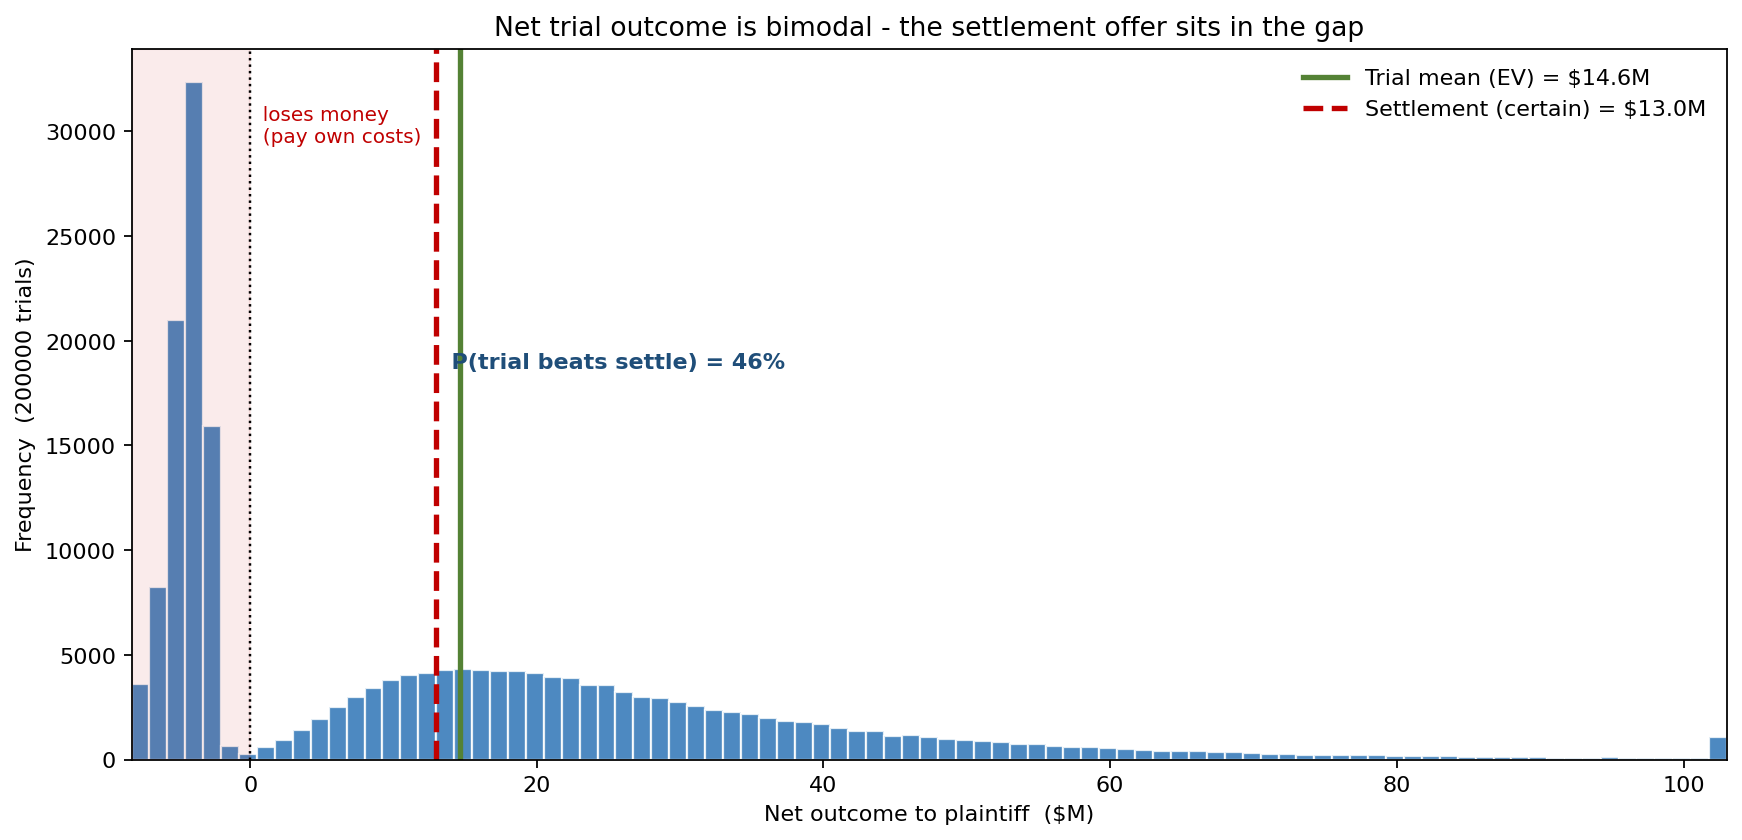
The shape is bimodal. A tall spike of losses sits below zero — the cases that are lost, returning the plaintiff's own costs as a pure deficit — and a broad, long-tailed hump of wins stretches to the right. The trial mean (EV) is $14.6M and the certain settlement is worth $13.0M, and the settlement line falls squarely in the empty valley between the two modes, a value the trial itself almost never delivers. The percentiles tell the same story: P10 = -$5.2M, P50 = $10.6M, P90 = $43.1M. The probability that going to trial actually beats taking the settlement is only 46% — worse than a coin flip — and the probability that trial loses money outright is 41%.
Why the average is the wrong number to decide on
A deterministic model would multiply 0.59 by 0.73 by $38M, subtract $4.2M in costs, and report an expected value near $12M — close enough to the simulated $14.6M to feel reassuring, and completely silent on the 41% chance of a negative outcome. The Monte Carlo distribution makes the trade explicit: trial offers a $43.1M P90 upside the settlement can never reach, at the price of a $5.2M P10 downside and a four-in-ten chance of finishing below zero. That is a risk-appetite decision, not an arithmetic one — and it is invisible until you see the whole distribution.
The decision in one picture
Collapsing the continuous trial outcome into three representative branches — drawn directly from the simulated probabilities and conditional means — frames the choice as the decision tree a litigation committee actually faces:
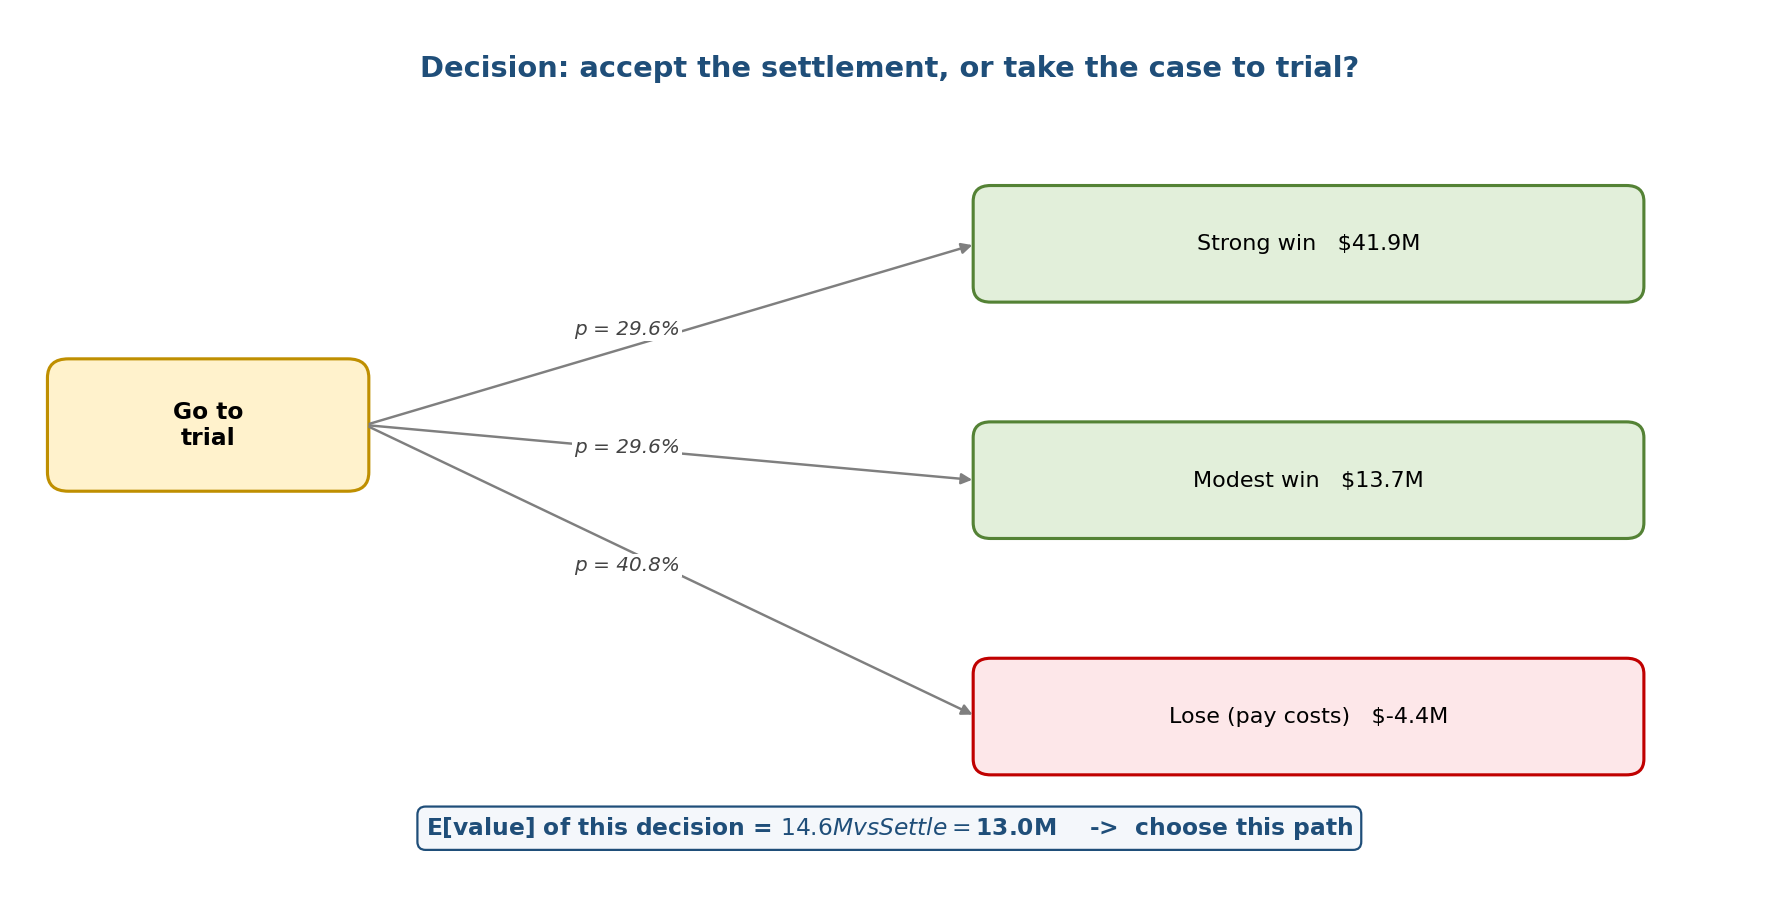
- Strong win — probability 30%, conditional mean net outcome $41.9M
- Modest win — probability 30%, conditional mean net outcome $13.7M
- Lose, pay costs — probability 41%, conditional mean net outcome -$4.4M
Probability-weighted, the trial path is worth $14.6M against the settlement's $13.0M. On expected value alone, the tree says take the case. But put the two distributions on one axis and the picture sharpens.
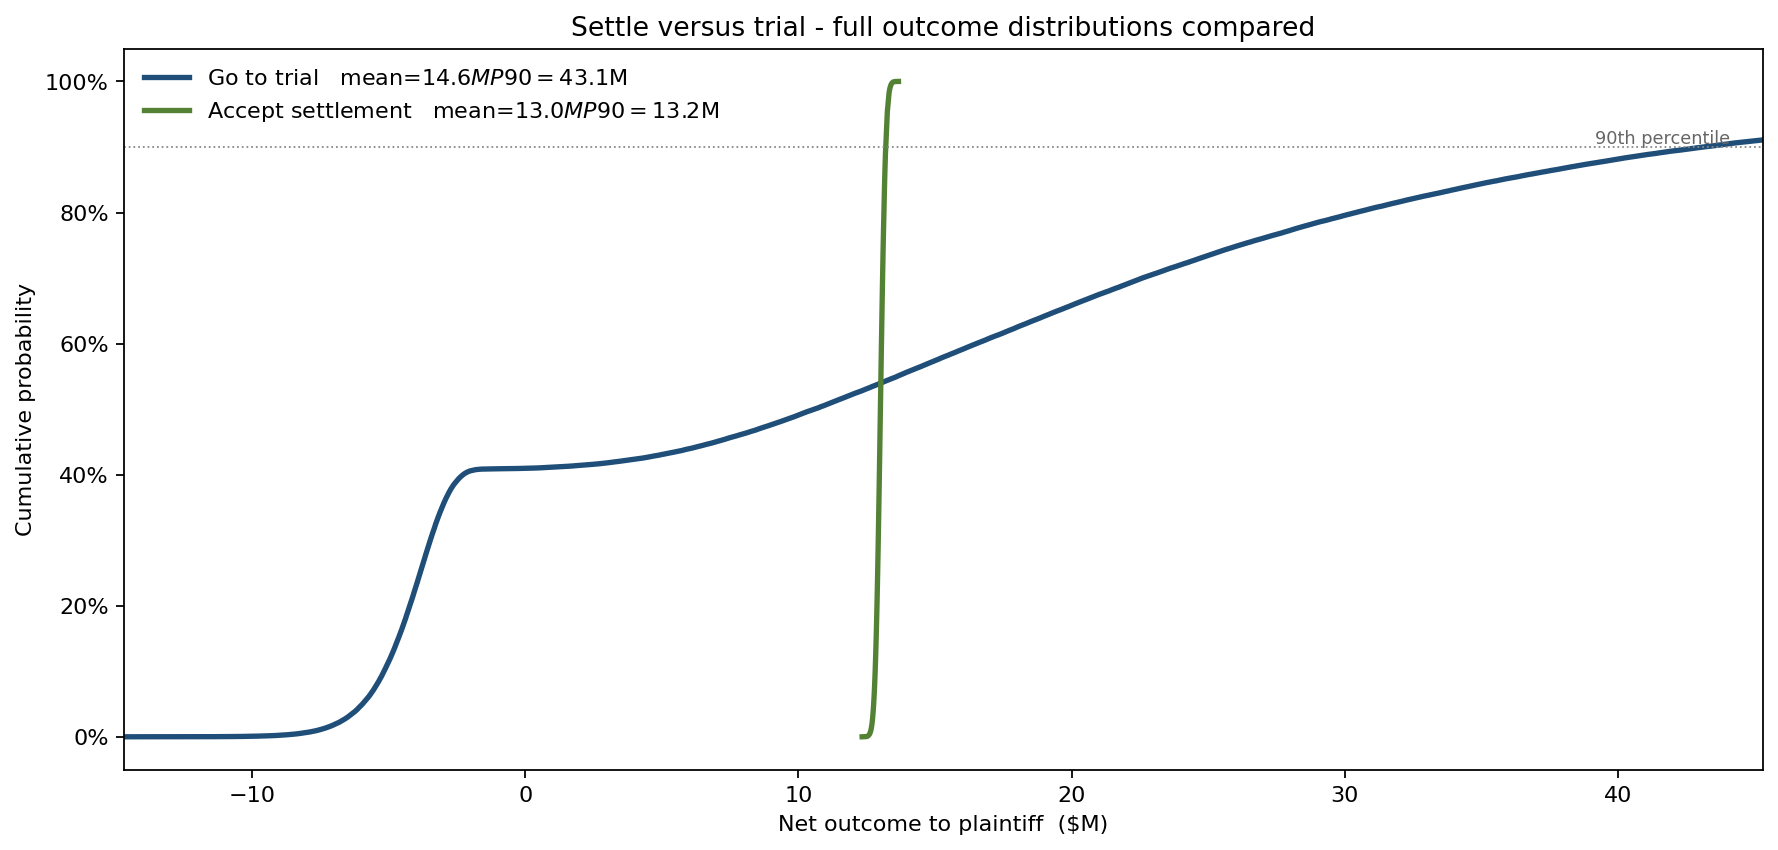
The settlement is a near-vertical line at $13.0M — its P90 is $13.2M, essentially certain. The trial CDF is a long diagonal sweep from below zero to $43.1M at P90. They cross such that 54% of trial outcomes land at or below the settlement's value. A risk-neutral plaintiff with a deep portfolio of cases takes the trial for the $1.6M of expected edge; a client who needs this single outcome to be positive takes the certain $13.0M and sleeps.
What actually moves the trial number
Ranking the four inputs by their contribution to the spread of the net outcome shows where the case is really won or lost:
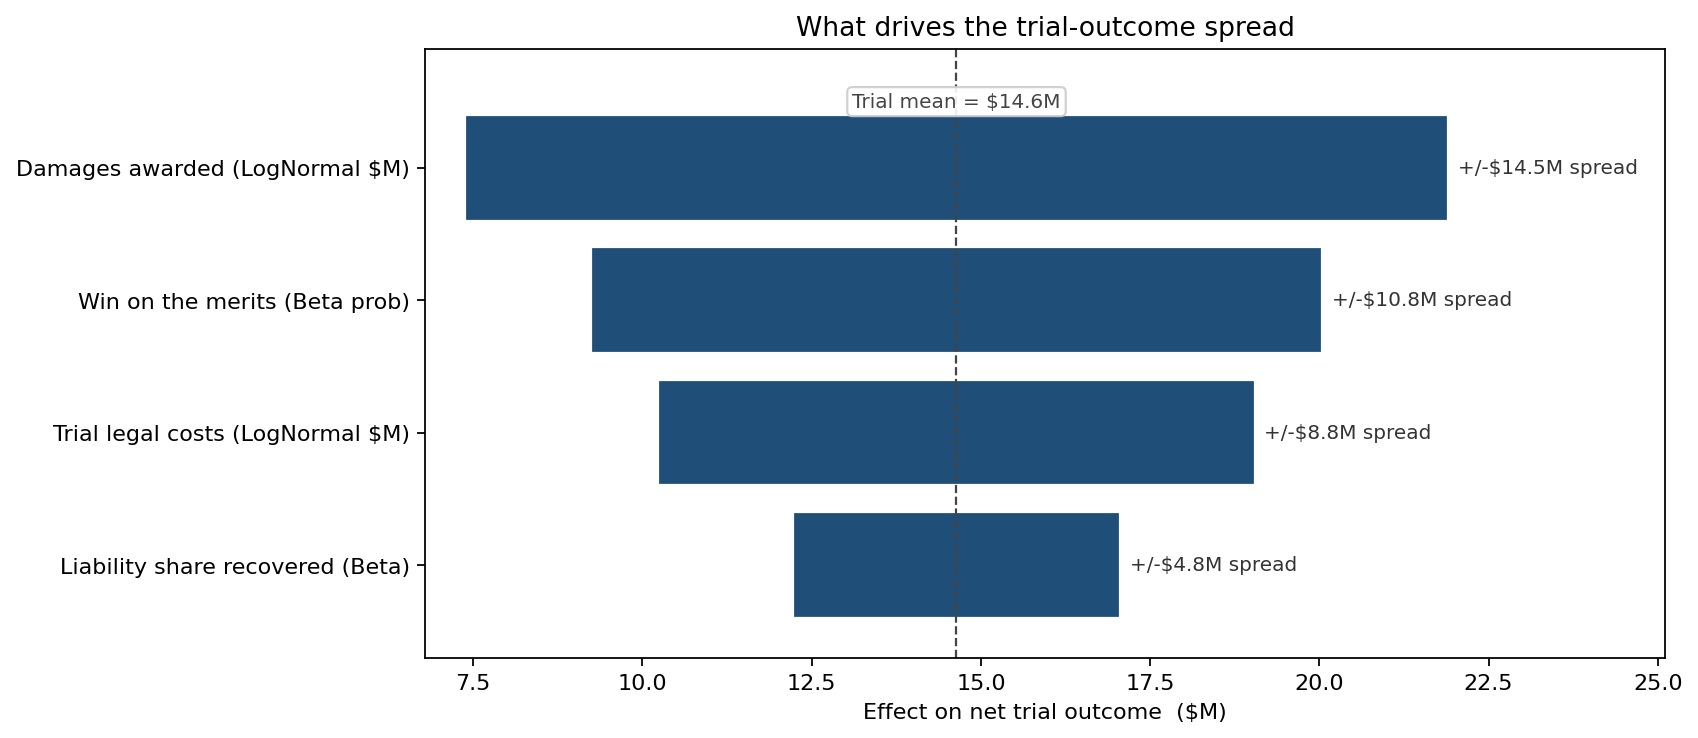
- Damages awarded (LogNormal) — ±$7.3M (raises the outcome)
- Win on the merits (Beta probability) — ±$5.4M (raises the outcome)
- Trial legal costs (LogNormal) — ±$4.4M (lowers the outcome)
- Liability share recovered (Beta) — ±$2.4M (raises the outcome)
The size of the eventual award dominates, ahead of the probability of winning at all. That ordering is a litigation-strategy instruction: an extra dollar of effort spent strengthening the damages model and the quantum case moves the expected outcome more than the same dollar spent nudging the liability odds.
What the model changed
The funder went into the negotiation believing a 59%-likely, $38M-award case was an easy trial. The simulation reframed it: a $14.6M average that loses money 41% of the time, beats the settlement only 46% of the time, and offers its $43.1M upside only in the 30% "strong win" branch. With that distribution in hand, the committee could price the settlement against its own risk appetite rather than against a misleading mean — and could see that the highest-leverage pre-trial work was on damages quantum, the ±$7.3M top driver, not on relitigating liability.
ModelRisk functionality used
- Beta distributions for bounded probabilities —
Beta(6.5, 4.5)for the uncertain win probability andBeta(8, 3)for the recovered liability share, keeping every draw inside [0, 1] where a Normal would not. - LogNormal distributions for skewed money — damages (median $38M, long right tail) and trial costs (median $4.2M), capturing the asymmetry of jury awards.
- Compound Bernoulli outcome — flipping each simulated case against its own drawn win-probability to produce the bimodal win/lose structure rather than a smoothed average.
- Decision-tree expected-value comparison — collapsing 200,000 trial draws into strong-win / modest-win / lose branches and weighing the $14.6M trial EV against the $13.0M certain settlement.
- Tornado sensitivity analysis — ranking the four inputs by rank-correlation half-spread, identifying damages quantum (±$7.3M) as the dominant driver ahead of the probability of winning.
For a single high-stakes case, Monte Carlo turns "we think we'll probably win" into a distribution you can negotiate against — and shows that a trial worth $14.6M on average is still a trial that loses money four times in ten.