

Industry: Legal
Product: ModelRisk
Application: Intellectual Property Valuation
A Patent Worth $13.5M on Average Beats Its $12M Price Only 34% of the Time
A fund is offered an exclusive licence to a granted patent for $12M. The discounted-cash-flow workup, run on best-estimate inputs — a $260M addressable market, a 25% peak share, a 7% royalty, a nine-year commercial life — returns an expected NPV of $13.5M. The point estimate clears the asking price, so on paper the deal is a buy. The Monte Carlo simulation in ModelRisk tells a sharper story: the patent's NPV exceeds the $12M price in only 34.5% of trials. The mean is above the price; the deal wins against the price barely a third of the time.
The two numbers disagree because patent value is right-skewed and gated by a discrete legal event. The median NPV is just $6.7M — well below the asking price — while a thin upper tail (P90 of $33.6M) drags the mean up past it. And before any of that cash flow is earned, the patent has to survive a validity challenge it loses roughly 30% of the time. A single expected-value number cannot represent a payoff that is part skewed-continuous, part coin-flip. A distribution can.
Why a point estimate fails here
A deterministic DCF multiplies a chain of best-estimate inputs and discounts the result. That hides two things that decide whether this is a good purchase. First, skew: market size is LogNormal and share and royalty are bounded fractions, so their product is heavily right-skewed — the mean sits far above the median, and "the average outcome" is an outcome that rarely happens. Second, the legal gate: the patent's enforceability is not a number you can average into the cash flow, it is a branch. Fold a 70%-survival probability into a single discounted figure and you get a smooth $13.5M that exists in no actual future — in the real futures the patent is either upheld and worth real money, or struck down and worth almost nothing.
The valuation is a distribution, not a number
The headline output is the full distribution of risk-adjusted NPV across 200,000 trials.
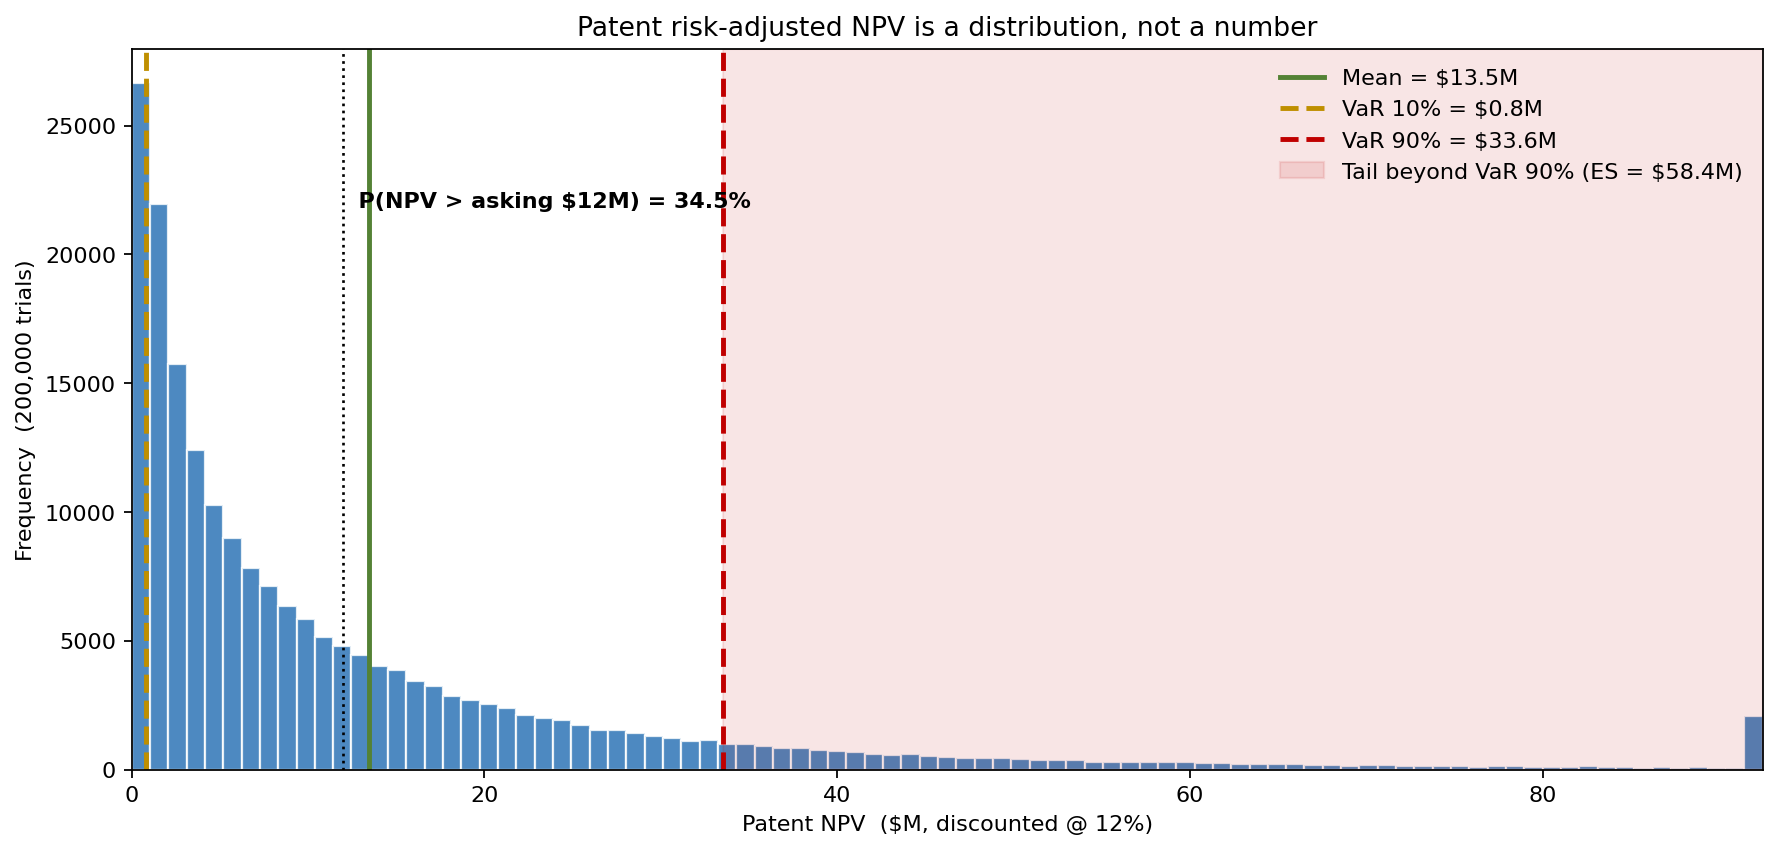
The shape is the argument. Mean NPV is $13.5M, but P10 is $0.8M, P50 is $6.7M, and P90 is $33.6M — a tenfold spread between the unlucky and lucky deciles. The $12M asking price sits to the right of the median: P(NPV > $12M) = 34.5%, so P(NPV ≤ asking) = 65.5%. A buyer who reads only the $13.5M mean believes they are paying below fair value; the distribution says that two times in three the patent is worth less than they paid. The decision is not "is the mean above the price" but "how much of the distribution clears the price, and is that enough margin of safety."
A discrete legal gate splits the value in two
The validity challenge is modelled explicitly: the probability the patent survives is itself uncertain (a Beta distribution with mean p_valid = 70%), and each trial draws a Bernoulli outcome. If the patent is invalidated, royalty income collapses to a 12% residual — a brief head-start before competitors copy freely.
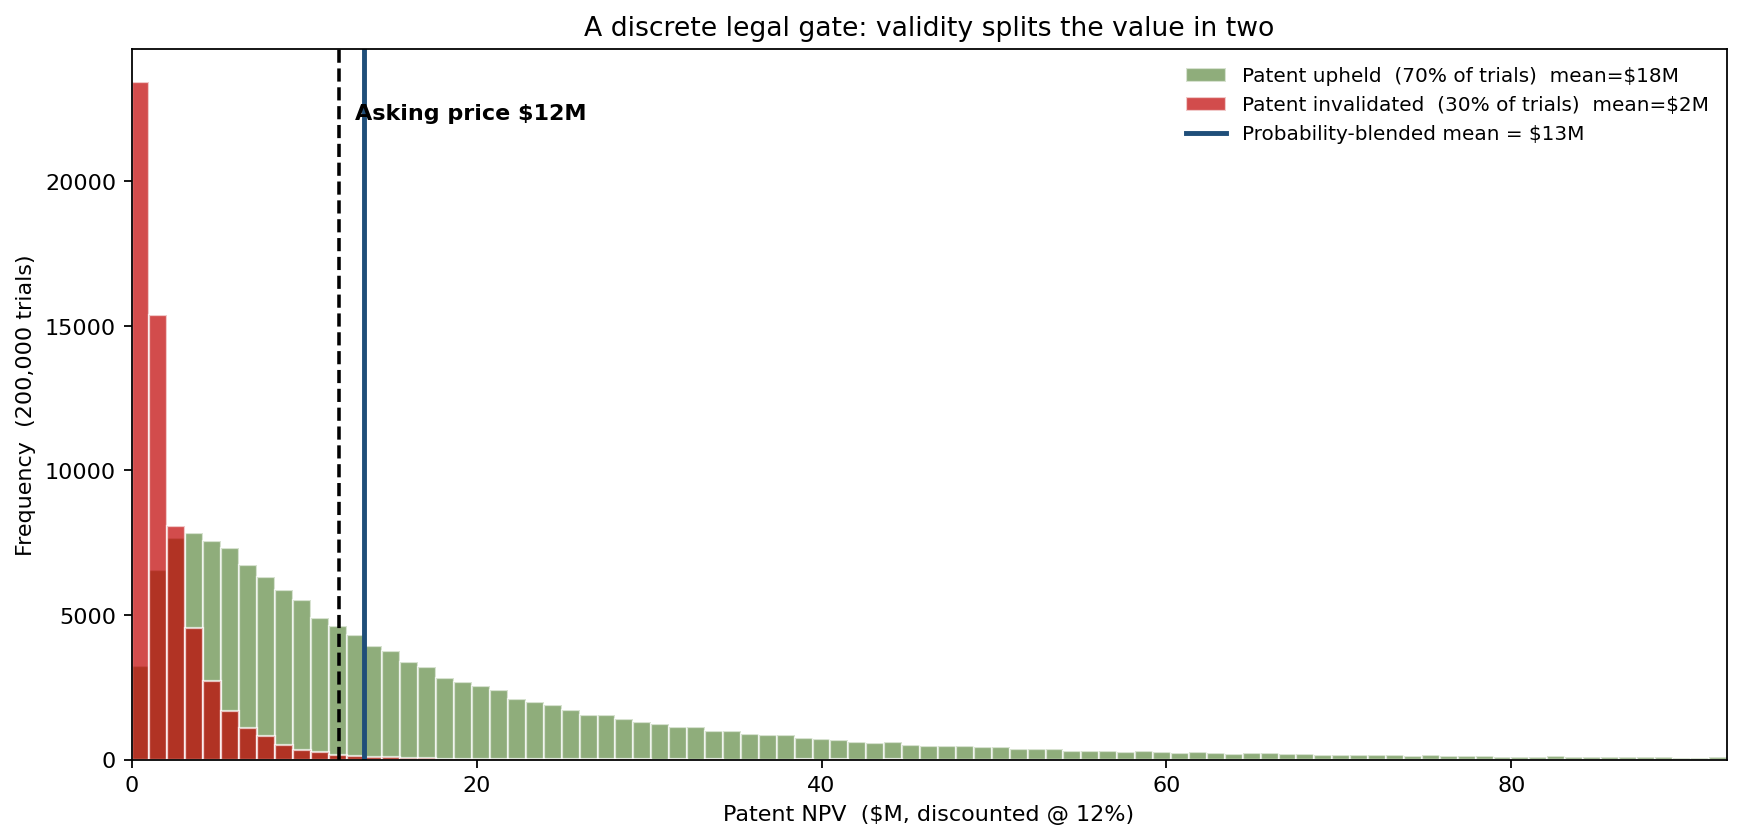
Conditioning on the legal outcome separates the value into two populations. In the 70% of trials where the patent is upheld, mean NPV is $18.3M and the deal beats the price 48.7% of the time. In the 30% where it is invalidated, mean NPV is $2.2M and it beats the price essentially never — 1.1%. The probability-blended mean of $13.5M is the dashed line between the two humps; it is the centre of gravity of a bimodal payoff, and no single trial lands there. That is precisely the value a deterministic model reports and a court-room cross-examination would dismantle: the "expected" patent does not exist.
Deal economics hinge on the validity opinion
Because the legal gate dominates the downside, the question worth paying a patent attorney to answer is how strong is the patent. The model makes that dependence explicit by sweeping P(NPV > asking) against the validity probability.
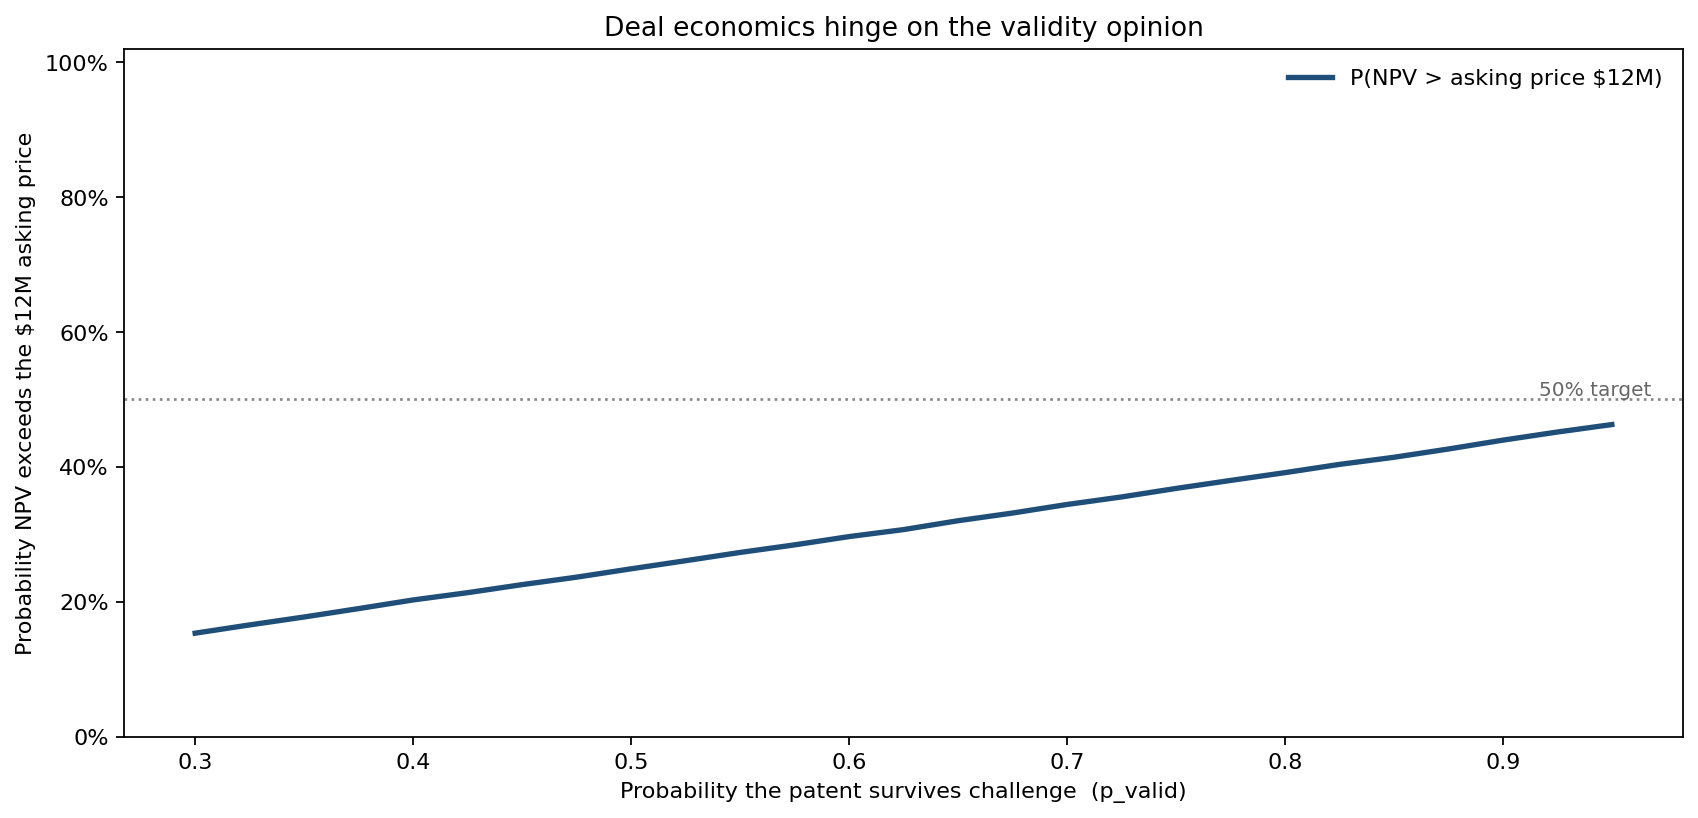
At a 50% validity opinion, the deal beats the $12M price 24.9% of the time (mean NPV $10.3M — below the price). At the base-case 70%, it is 34.4% (mean $13.5M). Even at a 90% validity opinion it reaches only 44% (mean $16.7M). The curve never touches the 50% line within a credible validity range — which is the genuinely useful finding: at $12M this patent is priced for a near-certain win it does not have. The buyer should either negotiate the price down toward the median, or fund a stronger prior-art / freedom-to-operate opinion to move p_valid before committing.
What actually moves the valuation
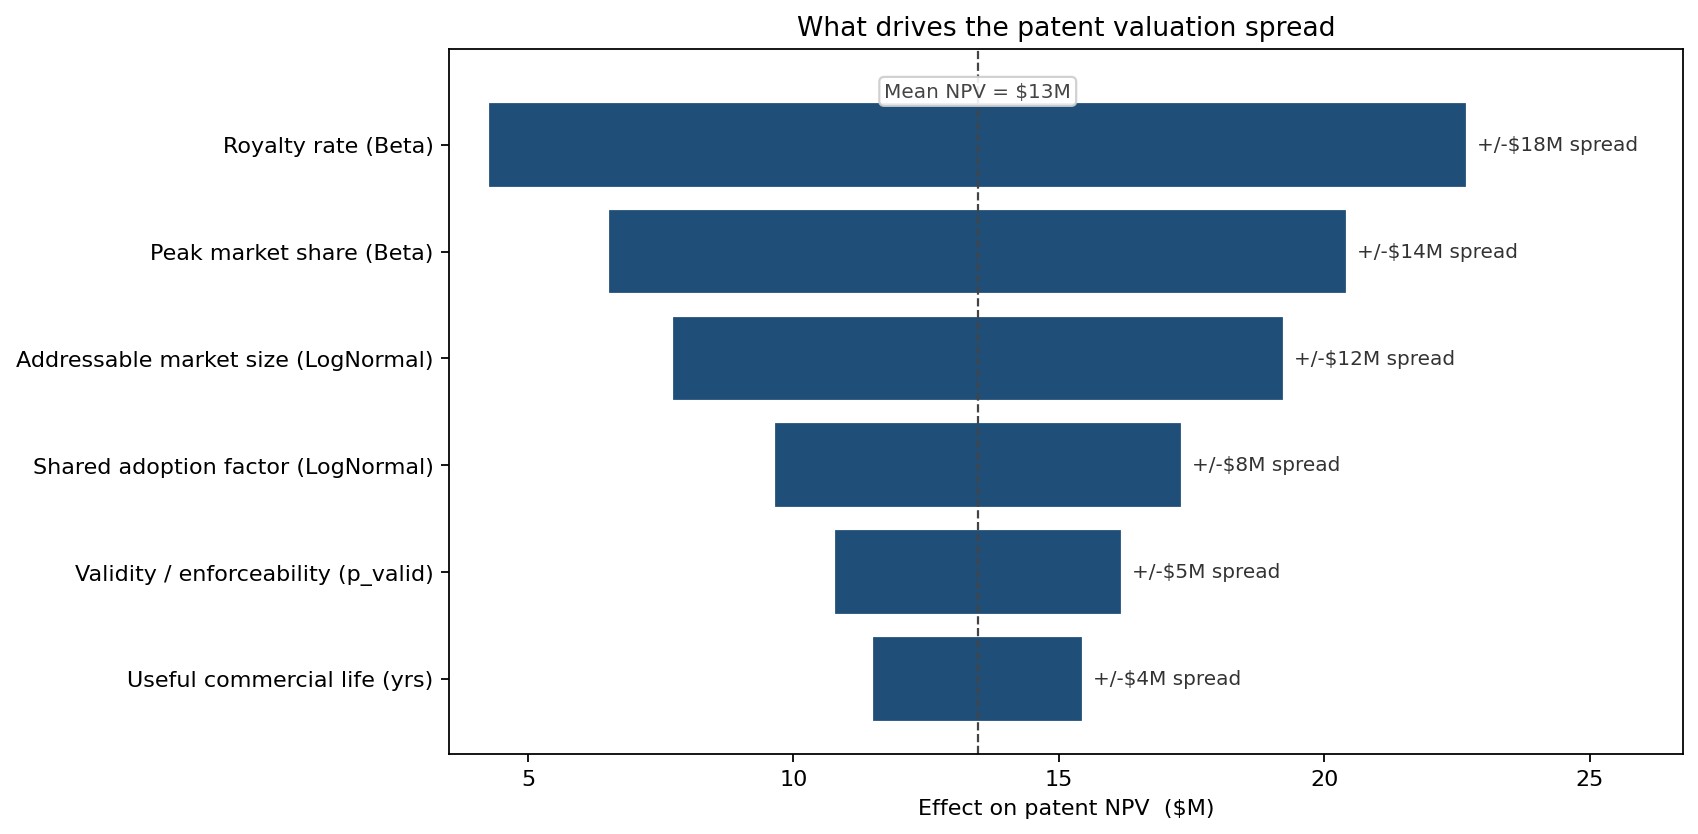
Ranking the inputs by rank-correlation half-spread around the $13.5M mean:
- Royalty rate — ±$9.2M (spread $18.4M)
- Peak market share — ±$7.0M (spread $13.9M)
- Addressable market size — ±$5.8M (spread $11.5M)
- Shared adoption factor — ±$3.8M (spread $7.7M)
- Validity / enforceability — ±$2.7M (spread $5.4M)
- Useful commercial life — ±$2.0M (spread $4.0M)
The commercial inputs — royalty rate, share, market size — drive the width of the distribution, while the validity gate drives its bimodality and its downside. Both matter, but they tell the negotiating team different things: tighten the royalty and share benchmarks to narrow the value range, and tighten the validity opinion to lift the whole curve. Note the role of the shared adoption factor: it scales every forecast year together, so the year cash flows are correlated rather than independent. Without it, summing the per-year flows would have collapsed the spread toward the mean — a central-limit artefact that would have understated the P10–P90 range the deal actually carries.
What the model changed
- The bid was re-anchored from the $12M asking price toward the $6.7M median, with an explicit premium the buyer was willing to pay for the upper tail — a defensible number rather than a round one.
- Spend was redirected to the validity question, because the sweep showed deal economics are far more sensitive to moving p_valid than to refining any single revenue input.
- The opposing damages claim was rebutted by showing it relied on the upheld-only mean ($18.3M) while ignoring the 30% invalidation branch — exactly the asymmetry the legal-gate chart isolates.
ModelRisk Functionality Used
- LogNormal addressable market + Beta share and royalty — a right-skewed, bounded value chain whose product mean ($13.5M) sits far above its median ($6.7M), the skew a deterministic DCF erases.
- Discrete Bernoulli validity gate with a Beta-distributed p_valid — modelling enforceability as a branch, not an average, producing the bimodal $18.3M / $2.2M split.
- Shared adoption common factor across forecast years — correlating the annual cash flows so the aggregate NPV keeps its true P10–P90 width instead of collapsing via the central-limit theorem.
- Threshold sweep of P(NPV > asking) vs p_valid — quantifying that the deal needs a near-certain validity opinion to be 50/50 at the asking price, directing diligence spend to the legal question.
- Rank-correlation tornado — ranking royalty rate (±$9.2M) and share (±$7.0M) as the width drivers above the validity gate, separating what widens the value from what gates it.
A patent's worth is not the average of its possible futures — it is a skewed distribution sitting behind a coin-flip on validity, and the only honest valuation is the one that prices both.