

Industry: Legal
Product: ModelRisk
Application: Compliance Cost Estimation
A $14M Compliance Budget With a Mean of $12.4M Still Overruns 3 Times in 10
A multinational stands up a combined data-privacy and financial-conduct compliance program spanning 48 distinct regulatory requirements. The legal department sizes it bottom-up — hours per requirement times a blended rate — and reports an expected cost of about $12.4M against a board-approved $14M budget. Comfortably inside, on the face of it. The Monte Carlo simulation in ModelRisk reports the same $12.4M mean and then the number the board actually needs: the program lands over budget 29.9% of the time, the P90 outcome is $19.9M, and the P99 is $33.5M — more than double the budget.
The gap between "mean under budget" and "overruns three times in ten" comes from two features a spreadsheet sum misses. The cost is right-skewed — a few requirements turn out far nastier than planned — and it carries a latent penalty tail: residual gaps the program fails to close can draw regulatory fines, and those fines are heavy-tailed. The budget question is not "what is the expected cost" but "what is the chance we breach, and what reserve covers the tail we cannot rule out."
Why a point estimate fails here
Adding up 48 best-estimate line items produces one number and destroys two kinds of information. First it hides skew within each requirement: implementation effort is LogNormal — most requirements are routine, a handful are genuinely hard — so the per-requirement mean already sits above its mode, and the sum inherits a long right tail. Second, and more dangerously, a cost-only estimate ignores penalty exposure entirely. After the program runs, each requirement still has some residual chance of a gap; a gap that gets examined draws a fine. Those fines do not appear in any effort estimate, yet they are exactly what turns a manageable overrun into a board-level event. A deterministic estimate prices the work and forgets the risk the work is supposed to retire.
Total cost plus exposure is a distribution, not a line item
The headline output aggregates direct effort cost and residual penalty exposure across 200,000 trials.
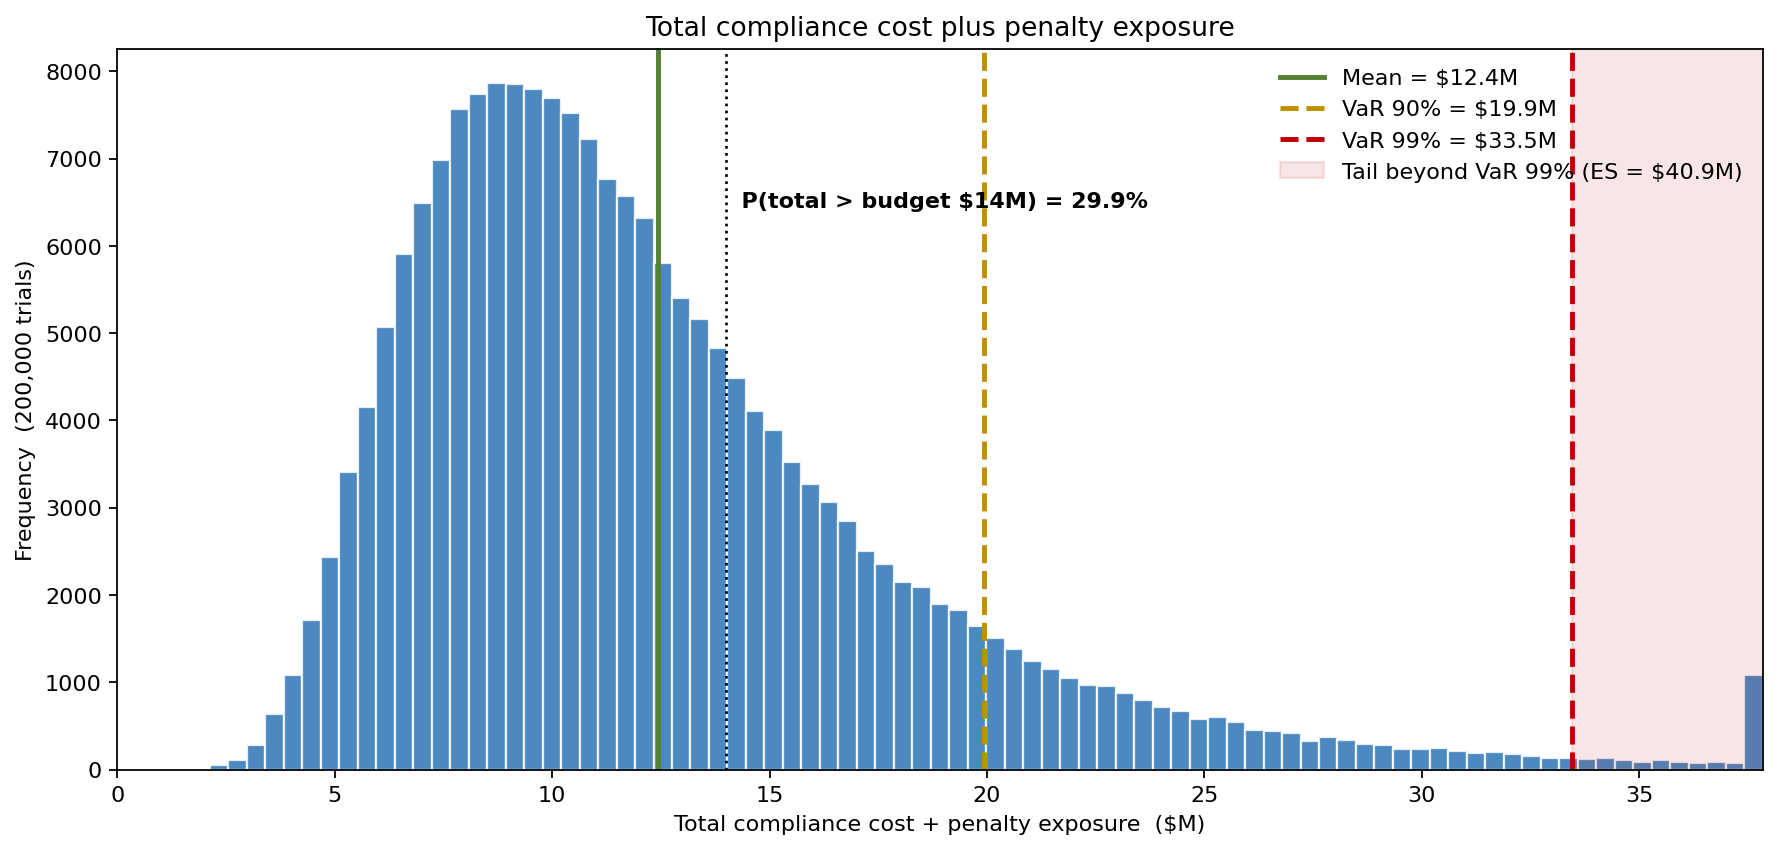
The distribution runs from a P10 of $6.5M to a P90 of $19.9M, with a mean of $12.4M and a median of $11.1M. The $14M budget sits in the right shoulder: P(total > $14M) = 29.9%, so P(total ≤ budget) = 70.1%. A 70% chance of coming in on budget is not the near-certainty a "mean of $12.4M against $14M" summary implies — it is roughly the odds of a single coin landing the same way twice. The P99 of $33.5M is the number the audit committee should see when they ask "what is the worst plausible case," and it is invisible to any deterministic roll-up.
The tail is penalty-driven, not effort-driven
Decomposing the cost at each percentile shows what fills the upper tail — and it is not overtime.
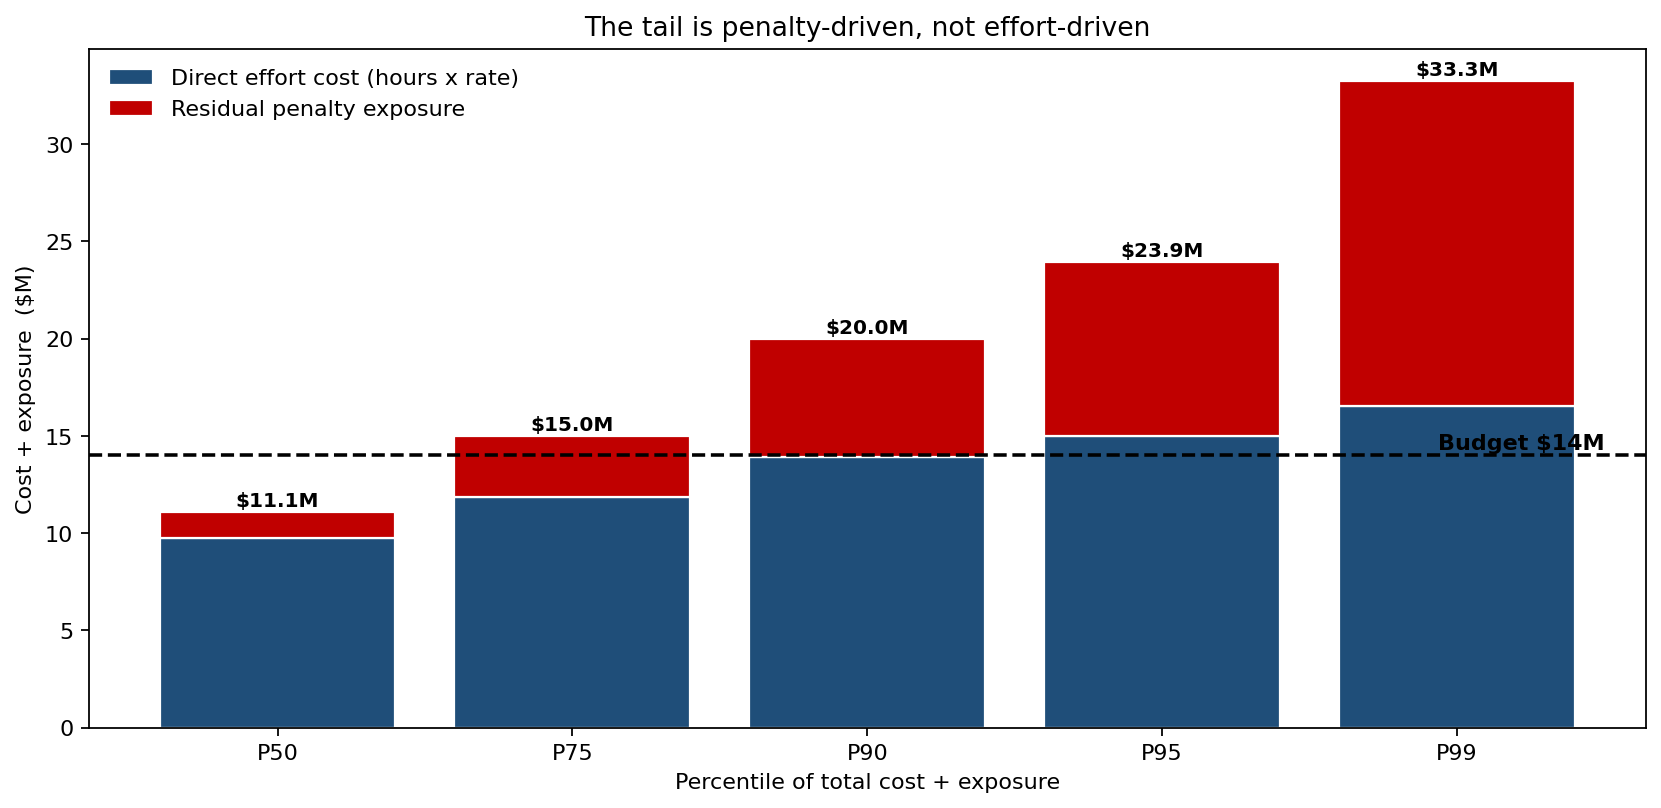
At the median, the $11.1M total is $9.7M of direct effort and just $1.3M of penalty exposure — penalties are 12% of the cost. By P90 the $20.0M total is $13.9M effort plus $6.1M penalty (30%). By P99 the $33.3M total is $16.5M effort and $16.7M penalty — a 50/50 split. The effort cost grows roughly linearly across the percentiles; the penalty exposure is what bends the tail upward. This is the decision-relevant finding: the budget overrun the board should fear is not driven by the program running long, it is driven by the program leaving gaps that draw fines. Buying down the tail means closing residual gaps, not adding contingency hours.
Three governance regimes, three exposure curves
The same model run under three program-governance regimes shows that the cost-versus-penalty trade-off has a non-obvious optimum.
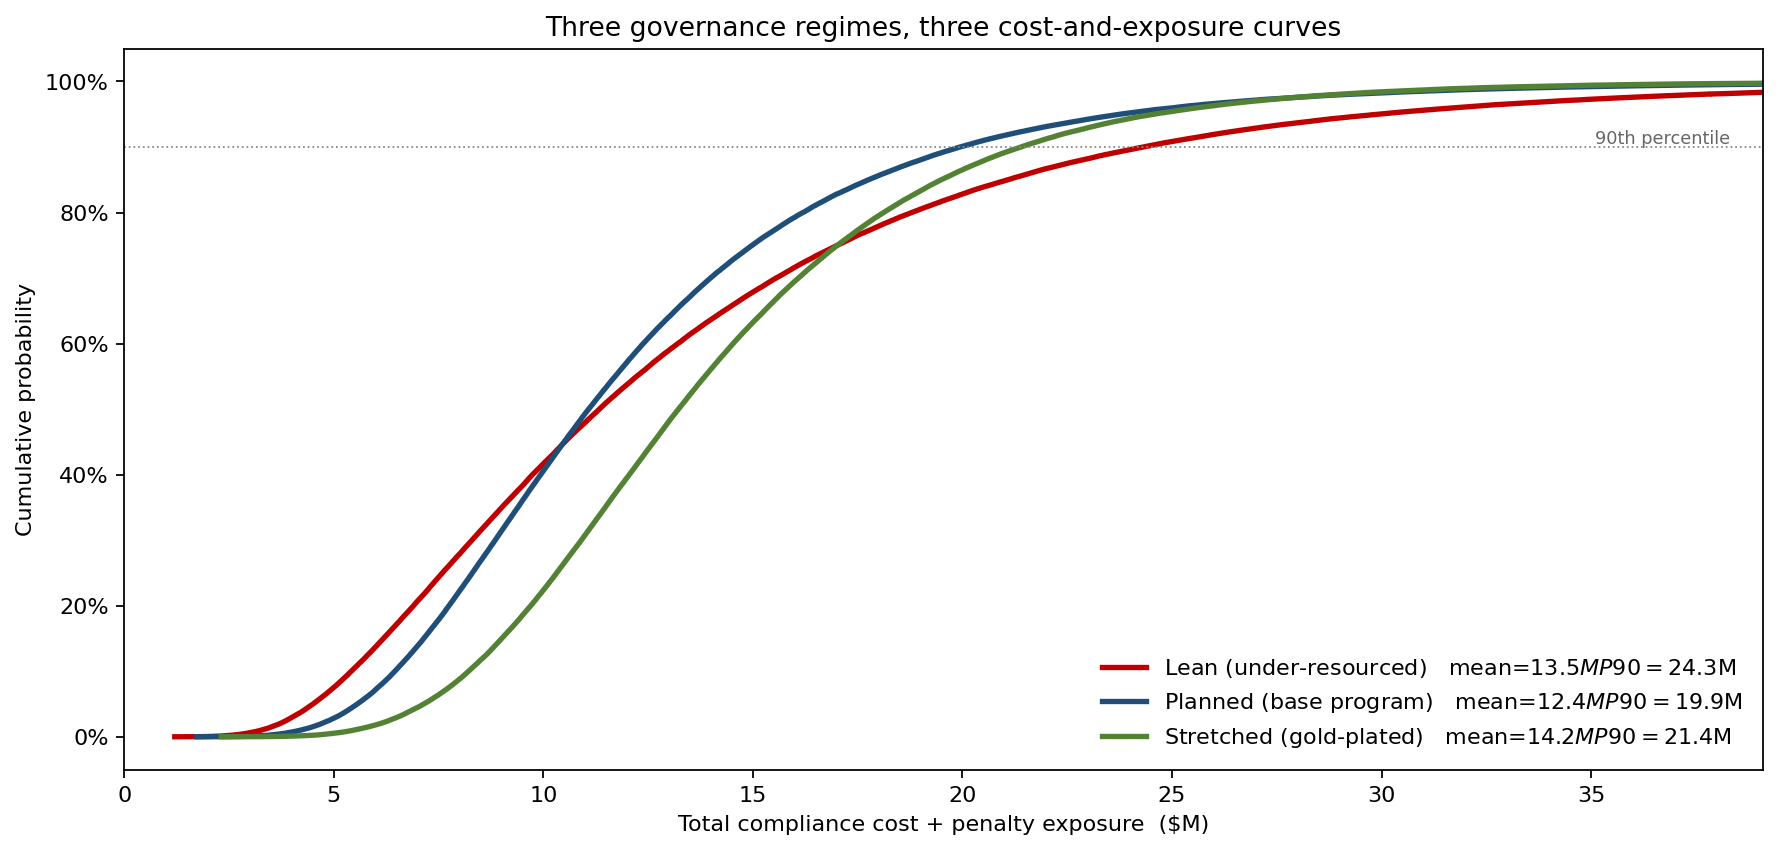
- Lean (under-resourced) — cut effort, accept more residual gaps: mean $13.5M, P90 $24.3M, P(over budget) 36.3%.
- Planned (base program) — mean $12.4M, P90 $19.9M, P(over budget) 29.9%.
- Gold-plated — spend heavily to close nearly every gap: mean $14.2M, P90 $21.4M, P(over budget) 43.9%.
The lean program is cheapest on effort yet its total mean and P90 are both higher than the planned base, because the extra penalty exposure more than offsets the labour saving — under-resourcing compliance is a false economy. The gold-plated program is the most expensive of all and breaches the budget most often. The planned base is the lowest-exposure regime: it is the floor of the cost-plus-penalty trade, and the simulation is what locates it.
What drives total cost plus exposure
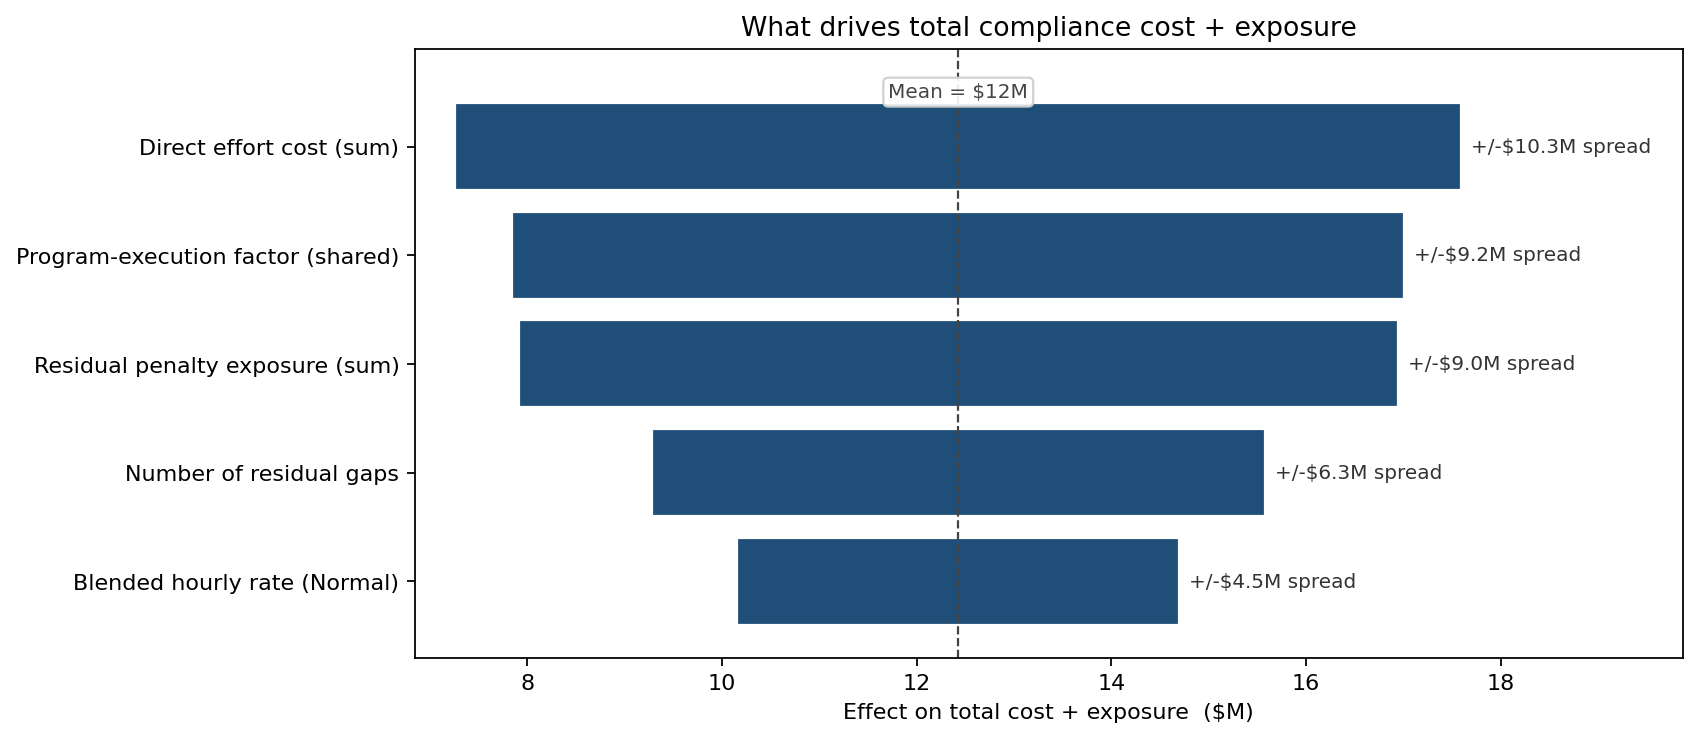
Ranking the drivers by rank-correlation half-spread around the $12.4M mean:
- Direct effort cost (sum) — ±$5.2M (spread $10.3M)
- Program-execution factor (shared) — ±$4.6M (spread $9.2M)
- Residual penalty exposure (sum) — ±$4.5M (spread $9.0M)
- Number of residual gaps — ±$3.1M (spread $6.3M)
- Blended hourly rate — ±$2.3M (spread $4.5M)
The shared program-execution factor is second only to the raw effort sum — and that is by design. One common factor scales every requirement's effort and gap propensity together, so a program that runs well runs well across all 48 requirements and one that runs poorly leaves gaps everywhere. Without that common factor, summing 48 independent requirements would have washed the spread out to almost nothing through the central-limit theorem — and the model would have reported a falsely precise budget that no real program ever achieves.
What the model changed
- The budget was re-framed from a single $14M number to a $12.4M mean with a $19.9M P90 reserve, and the audit committee funded the reserve once they saw the 29.9% breach probability behind the "comfortable" mean.
- Contingency was moved from hours to gap-closure, after the composition chart showed the tail is penalty-driven — the cheapest dollar of risk reduction closes a residual gap, not buys an overtime hour.
- The lean-program proposal was rejected, because the scenario CDF showed its lower effort cost was more than erased by higher penalty exposure: a higher mean total and a higher breach probability than the planned base.
ModelRisk Functionality Used
- LogNormal per-requirement effort + truncated-Normal blended rate — summed over 48 requirements into a right-skewed cost whose mean ($12.4M) sits above its median ($11.1M).
- Bernoulli residual-gap gate with heavy-tailed LogNormal fine severity — adding the penalty exposure that grows from 12% of cost at the median to 50% at P99, the layer a cost-only estimate omits.
- Shared program-execution common factor — correlating effort and gap propensity across all requirements so the aggregate keeps a real $6.5M–$19.9M P10–P90 width instead of collapsing via the central-limit theorem.
- Scenario CDF across three governance regimes — quantifying that the lean program ($13.5M mean, 36.3% breach) is worse on total exposure than the planned base, locating the cost-plus-penalty optimum.
- Rank-correlation tornado — ranking direct effort (±$5.2M), the execution factor (±$4.6M), and penalty exposure (±$4.5M) as co-equal drivers, directing risk reduction at gap-closure rather than hours.
A compliance budget that prices only the work it will do, and not the penalties the work is meant to prevent, is a number that looks safe and breaches the budget three times in ten.