

Industry: Insurance and Reinsurance
Product: ModelRisk
Application: Underwriting Risk
What a Single Treaty Costs the Whole Portfolio
A single $300M-limit aviation excess-of-loss treaty at a 1.2% expected loss cost looks profitable on the deal sheet. Stress it inside a portfolio that already carries $1.8B of catastrophe exposure and the same treaty consumes $48M of marginal Solvency Capital — meaning its risk-adjusted return on capital is 4.1%, not the headline 14% gross margin. Underwriting risk is not a per-treaty problem. It is a portfolio-construction problem, and the portfolio-construction view is exactly what the underwriter's quote-sheet cannot show.
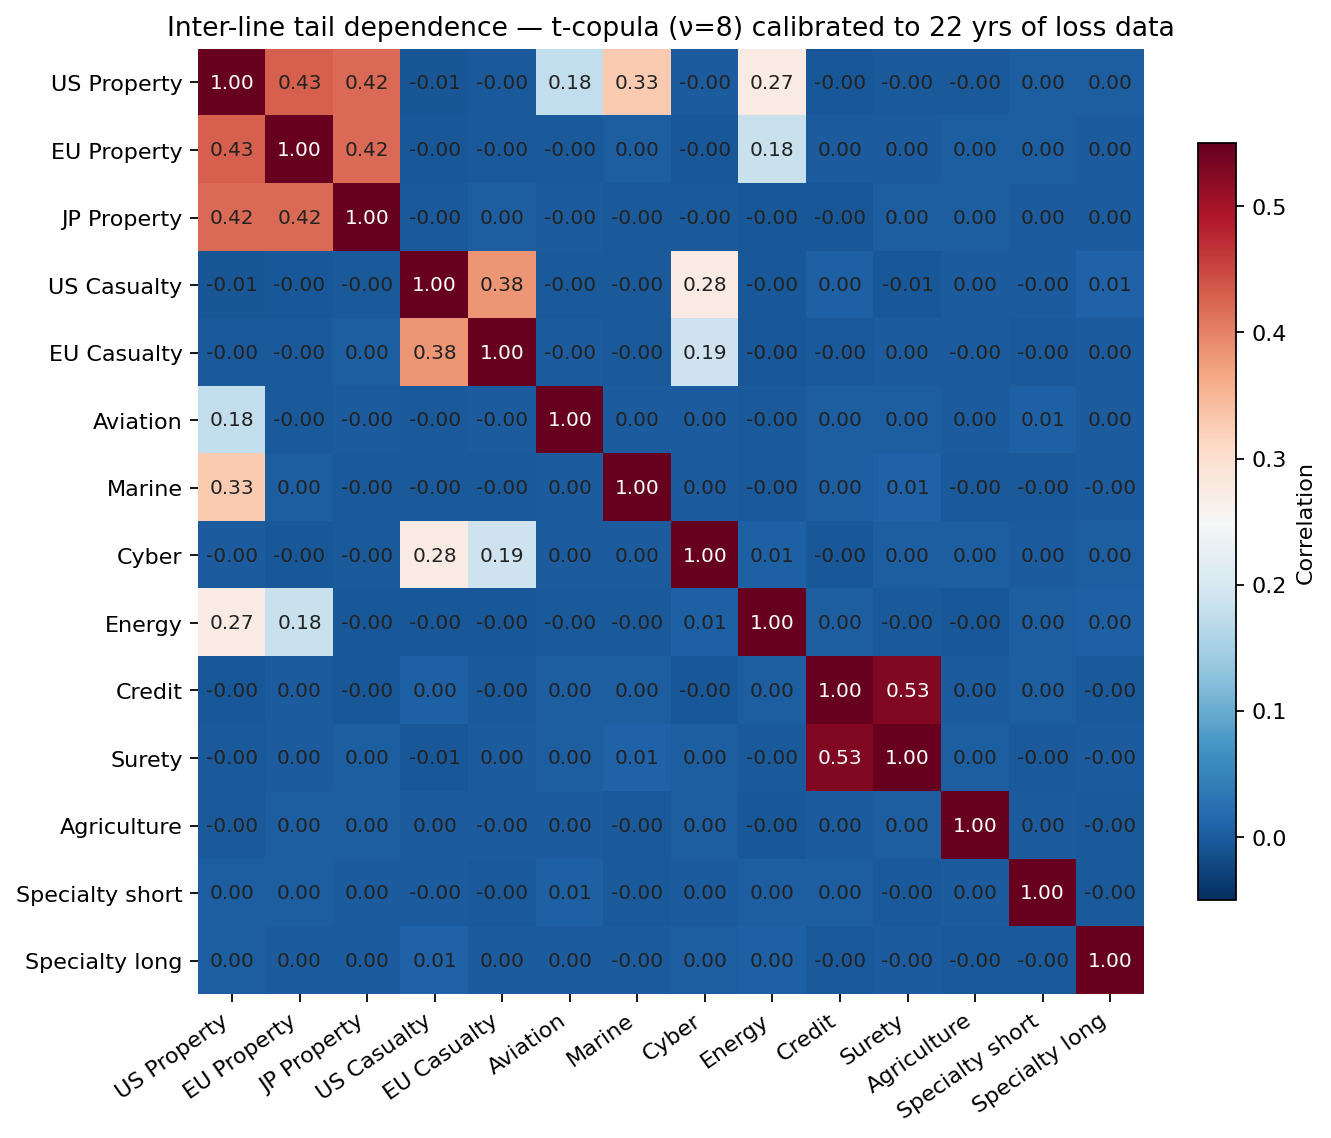
A global reinsurer with $6.5B of gross written premium across 14 lines and 380 treaties rebuilt its underwriting framework in ModelRisk. The objective: every treaty quote shows the underwriter not just its standalone expected loss but its marginal SCR, its diversification credit against the existing book, and its contribution to the portfolio 99.5% tail — computed in seconds against a live in-Excel simulation of the whole book. The single assumption that moves all of those numbers most is the one pictured below: how the 14 lines move together in the tail.
Per-treaty frequency-severity, calibrated honestly
For each treaty the model builds a compound frequency-severity loss distribution. Frequency of losses to the layer is Negative Binomial, not Poisson — the Poisson constant-rate assumption is wrong on most lines because the underlying claim count is over-dispersed. For the aviation book the per-event count to a $100M-attaching layer has mean 0.6 and variance/mean 1.9. Severity to the layer is computed by applying the treaty's attachment and limit to a ground-up severity drawn from a LogNormal-body / GPD-tail distribution — the GPD tail is what prevents the model from underpricing the $250M-and-up events that have happened twice in the last 30 years of aviation history.
For the casualty long-tail lines, severities incorporate a social-inflation multiplier with Triangular(1.02, 1.06, 1.12) and 0.6 year-on-year autocorrelation, because the 2018–2024 tort-trend regime is not yet stationary and pretending it is bakes in capital understatement.
Tail dependence is the missing word
The original capital model summed across lines as if losses were independent — equivalent to assuming a copula with zero correlation. That assumption gives away free diversification capital that does not exist. A single Atlantic hurricane generates property, marine, and business-interruption claims simultaneously; a 2008-style credit event hits casualty defense costs at the same time it suppresses investment income. The corrected model uses a t-copula with 8 degrees of freedom across the 14 lines, calibrated to 22 years of joint loss history (the matrix shown in the opening chart). The heatmap shows the realised structure — a US/EU/JP property cluster correlated around 0.4, credit and surety at roughly 0.5, US Property and Marine at about 0.33 — with the t-copula layering heavier tail co-movement on top. Across a 14-line book that dependence is decisive: summing the lines as independent understates the 99.5% SCR by 23%, because independence hands the portfolio a diversification benefit the real correlations simply do not deliver.
The portfolio loss distribution
Aggregated across 14 lines, 380 treaties, and 100,000 simulated years, the gross underwriting loss distribution looks like this:
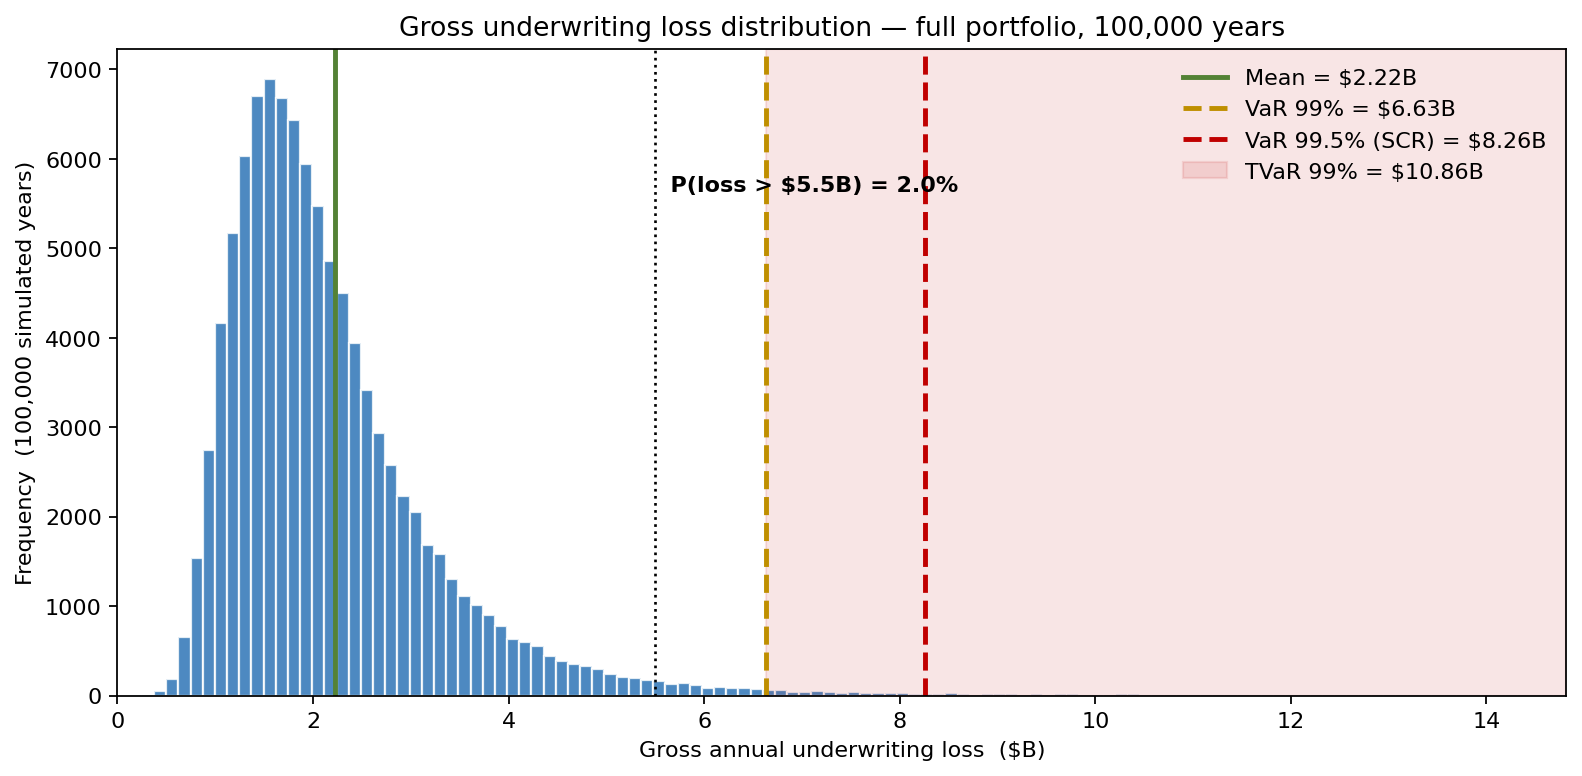
The deterministic model produced an expected loss of $2.15B. The simulation says: mean = $2.22B, 99% VaR = $6.63B, 99.5% VaR = $8.26B (the Solvency II SCR figure), TVaR(99) = $10.86B. Roughly 2% of years exceed $5.5B of loss — the threshold above which the reinsurer's combined ratio crosses 110% and dividend policy comes under board discussion.
Marginal capital, not standalone expected loss
The decision-relevant number for an underwriter quoting a new treaty is not the treaty's standalone expected loss cost. It is the marginal SCR — how much the portfolio's 99.5% VaR moves when the new treaty is added. ModelRisk recomputes the full portfolio distribution with and without each candidate treaty and returns the delta in seconds. For three candidate aviation treaties currently in the underwriting pipeline:
| Treaty | Standalone EL | Premium | Marginal SCR | ROC |
|---|---|---|---|---|
| A — $100M xs $50M | $3.5M | $7.2M | $28M | 13.2% |
| B — $200M xs $100M | $2.1M | $4.9M | $44M | 6.4% |
| C — $300M xs $200M | $0.9M | $2.4M | $19M | 7.9% |
The standalone-loss view ranks A, B, C in order. The marginal-capital view says write A; reprice or decline B; consider C selectively — exactly the opposite of what underwriting margin alone would suggest. The portfolio is already long the $100M–$300M aviation layer; adding more capacity there consumes capital that would earn more on the new-territory cyber book.
Where the SCR uncertainty actually lives
Sensitivity ranking on the 99.5% portfolio SCR isolates the assumptions that matter most:
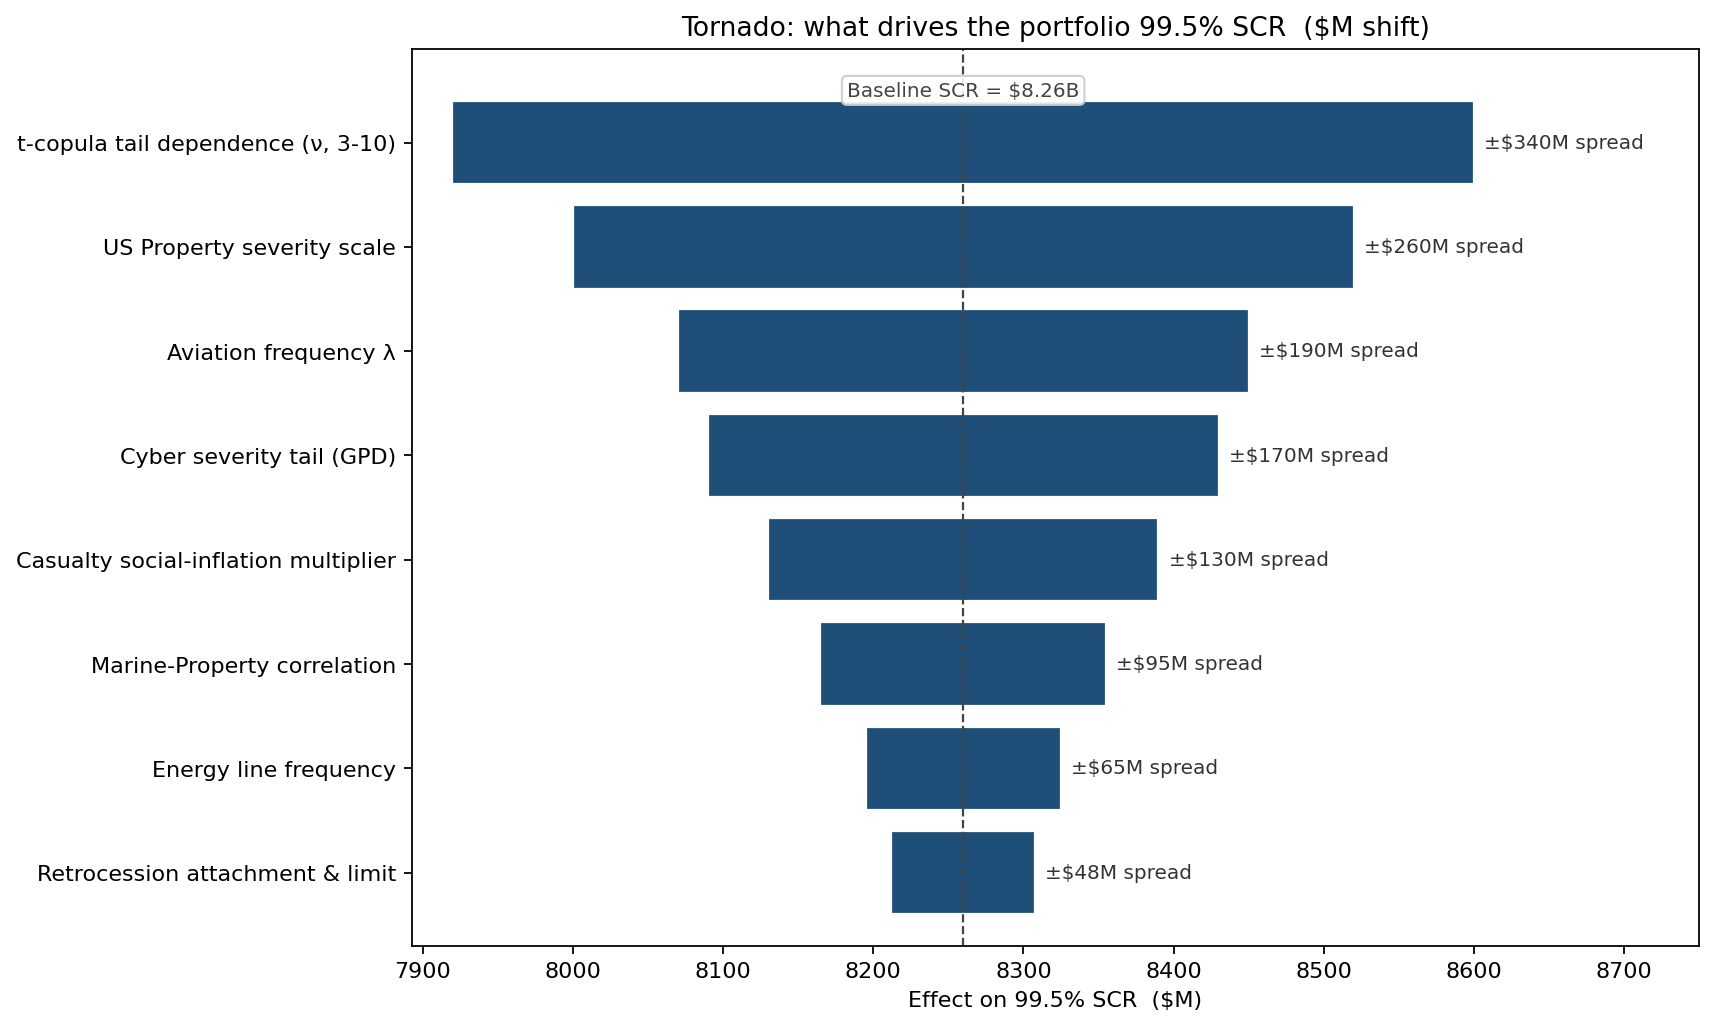
The biggest mover is the t-copula tail-dependence parameter — varying the degrees of freedom across its plausible range (3 to 10) shifts the SCR by ±$340M. That is more sensitivity than any single line's severity scale. The actuarial research budget shifted accordingly: tighter calibration of the inter-line tail copula returned more SCR precision per dollar than any other study.
Three macro scenarios, three SCR outcomes
The same engine reruns under three macro scenarios — a soft cycle (frequency 0.85×, severity 0.90×), the baseline, and an adverse climate-plus-tort cycle (Atlantic frequency 1.25×, casualty social inflation 1.10×):
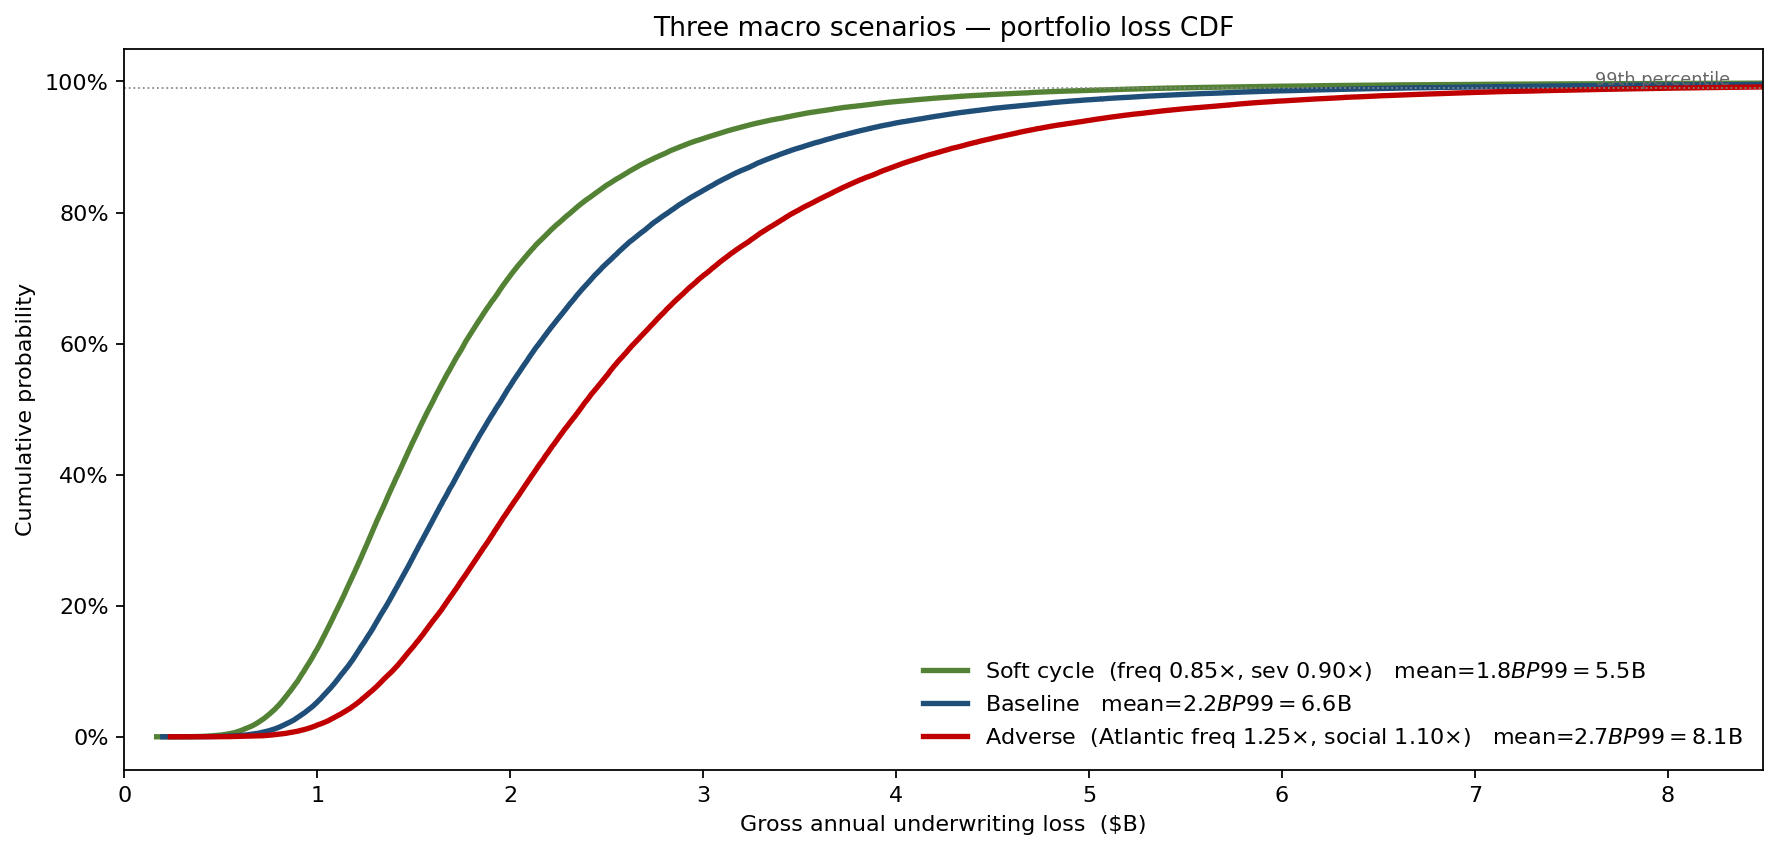
The adverse-scenario 99% loss is $8.09B, $1.46B above the baseline 99% of $6.63B. That scenario spread — not a percentage-of-SCR rule of thumb — was the basis for the firm's $1.5B capital-management cushion above the regulatory floor.
What the model changed
- Underwriting return on capital improved 320 basis points over 18 months. The lift came not from writing more business, but from re-pricing or declining 17 treaties whose marginal SCR contribution was 2-3× the standalone expected loss view had suggested.
- Aviation book reshaped. The portfolio shifted away from the over-concentrated $100M–$300M attachment band into a wider spread of layers and territories, cutting the aviation contribution to portfolio 99.5% SCR by $140M while preserving 88% of premium income.
- Retrocession program right-sized. The simulation showed that the existing $500M aggregate retrocession cover was binding in only 0.6% of simulated years — buying down the attachment by $100M for an extra $4.8M premium tightened the 99% TVaR by $60M.
- Quote-turn-around cut from 2 days to 4 hours for the standard treaty types because the underwriter sees marginal SCR live in the same Excel workbook that holds the rest of the quote.
ModelRisk Functionality Used
- Compound frequency-severity per treaty — Negative Binomial counts (with line-specific dispersion) feeding LogNormal-body / GPD-tail severity, with treaty attachment and limit applied per simulated event.
- t-copula with 8 degrees of freedom across 14 lines, replacing the independent-sum assumption that was understating the 99.5% SCR by 23%.
- Marginal-SCR calculator — the same portfolio engine reruns with each candidate treaty added, returning the SCR delta in seconds and feeding it directly into the underwriter's quote sheet.
- Triangular social-inflation multiplier with year-on-year autocorrelation 0.6 on casualty severities, separating tort-cycle risk from general claim inflation.
- Tornado sensitivity on the portfolio 99.5% SCR that put the t-copula tail-dependence parameter at the top of the research-investment ranking.
- Scenario comparison of soft / baseline / adverse macro environments, producing the side-by-side CDFs that anchored the firm's $1.5B capital cushion above the regulatory SCR.
Underwriting risk lives at the portfolio, not the treaty. Monte Carlo simulation in ModelRisk is what turns the standalone-loss view that fits on a deal sheet into the marginal-capital view that actually moves the firm's risk-adjusted return on capital.