

Industry: Insurance and Reinsurance
Product: ModelRisk
Application: Risk Transfer
Choosing the Risk-Transfer Toolkit: Retain, Reinsure, or Securitise?
A specialty insurer writing US property, marine cargo, and standalone cyber wrote $1.8 billion of gross premium in 2024 and carried $420 million of capital against it. Three forces were squeezing the balance sheet at once: a hardening cyber market that no traditional reinsurer wanted to write at last year's terms, a marine book exposed to one specific Suez-canal-style shock the reinsurance treaty did not contemplate, and a regulatory request to demonstrate that the 1-in-200 net loss stayed below 60% of capital. The CFO needed a strategic risk-transfer review, not a quote.
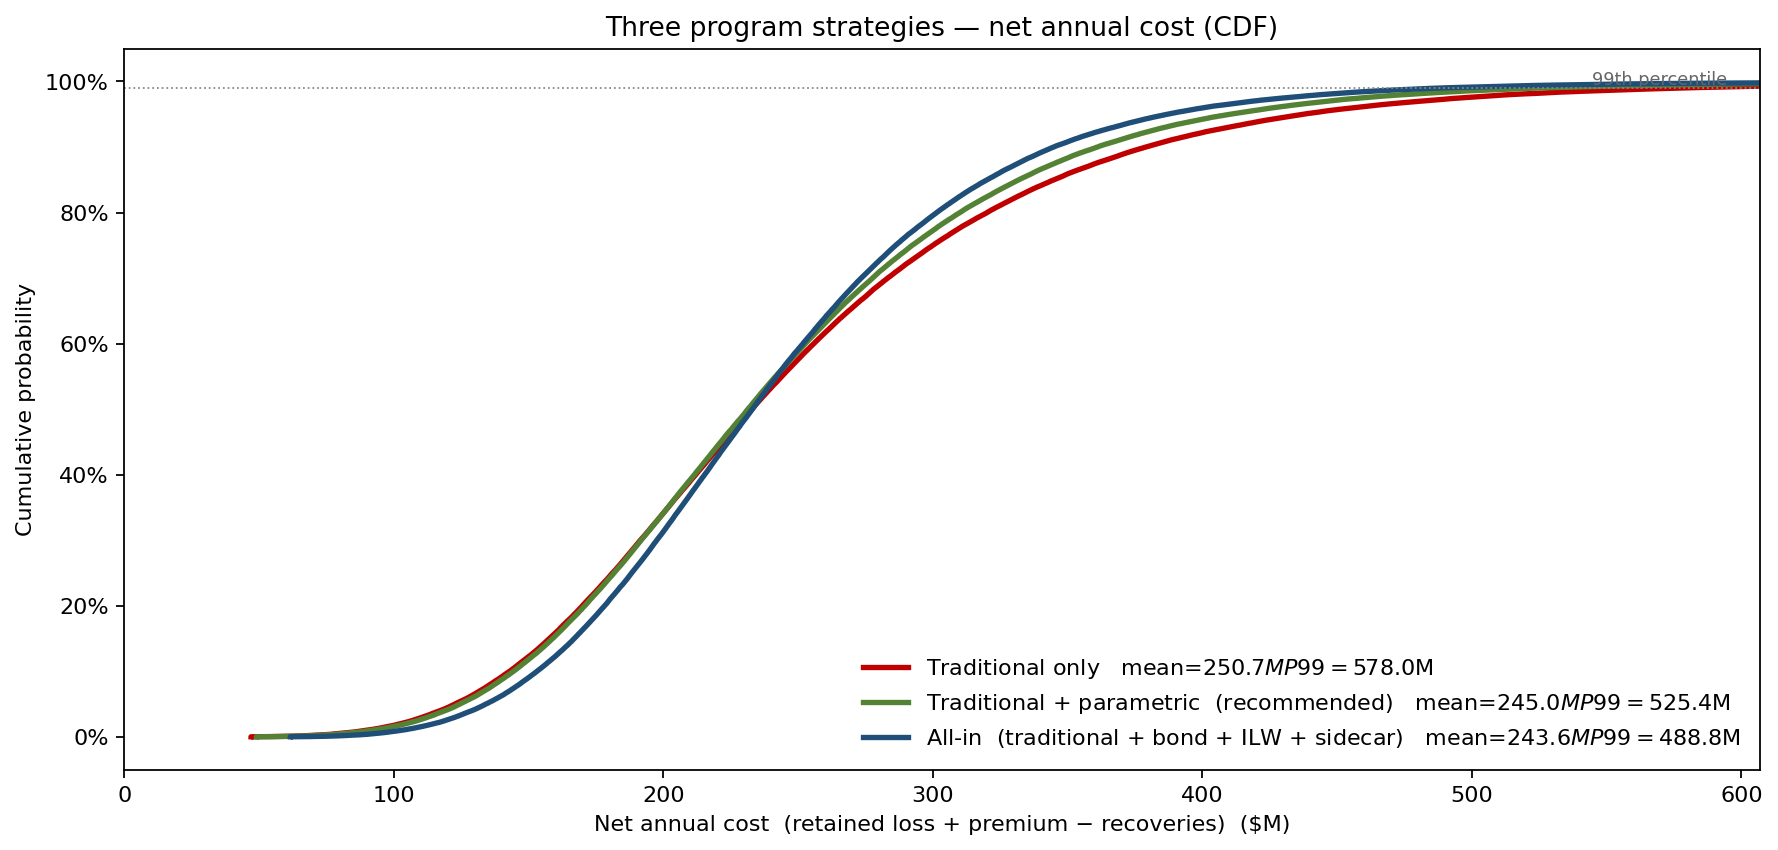
The actuarial team built a single ModelRisk workbook covering all three lines, the gross-loss model, every realistic transfer instrument (quota share, surplus, XoL, aggregate stop-loss, catastrophe bonds, industry-loss warranties, and an insurance-linked sidecar), and the capital model that turned a net-loss distribution into a regulatory metric. The output was not a price for a single treaty but a comparable cost-of-capital surface across the toolbox. The decisive comparison is the one below: three coherent programs, each simulated end-to-end, plotted as net-annual-cost distributions so the cost-versus-tail-protection trade-off is visible at a glance.
Mapping the gross loss
Each line was modelled compound, with line-specific distributions chosen to match what the underwriters actually saw:
- Property — Poisson frequency (\(\lambda = 6\) attritional + \(\lambda = 0.6\) cat), severity LogNormal body spliced to a Generalised Pareto tail above $30M per event. Annual gross loss: mean $93M, P99 $294M.
- Marine cargo — negative binomial frequency (mean 11, dispersion 2.1 — pure Poisson misses the cluster years), severity LogNormal with a separate transport-corridor shock distribution (5% annual probability, severity LogNormal mean $40M). Annual gross loss: mean $63M, P99 $234M.
- Cyber — frequency NegBin (mean 22, dispersion 3.4 — cyber clusters around exploit cycles), severity LogNormal with \(\sigma = 1.3\) (very heavy tail), plus a systemic event with 2% annual probability and LogNormal mean $80M for shared-vendor outages. Annual gross loss: mean $104M, P99 $364M.
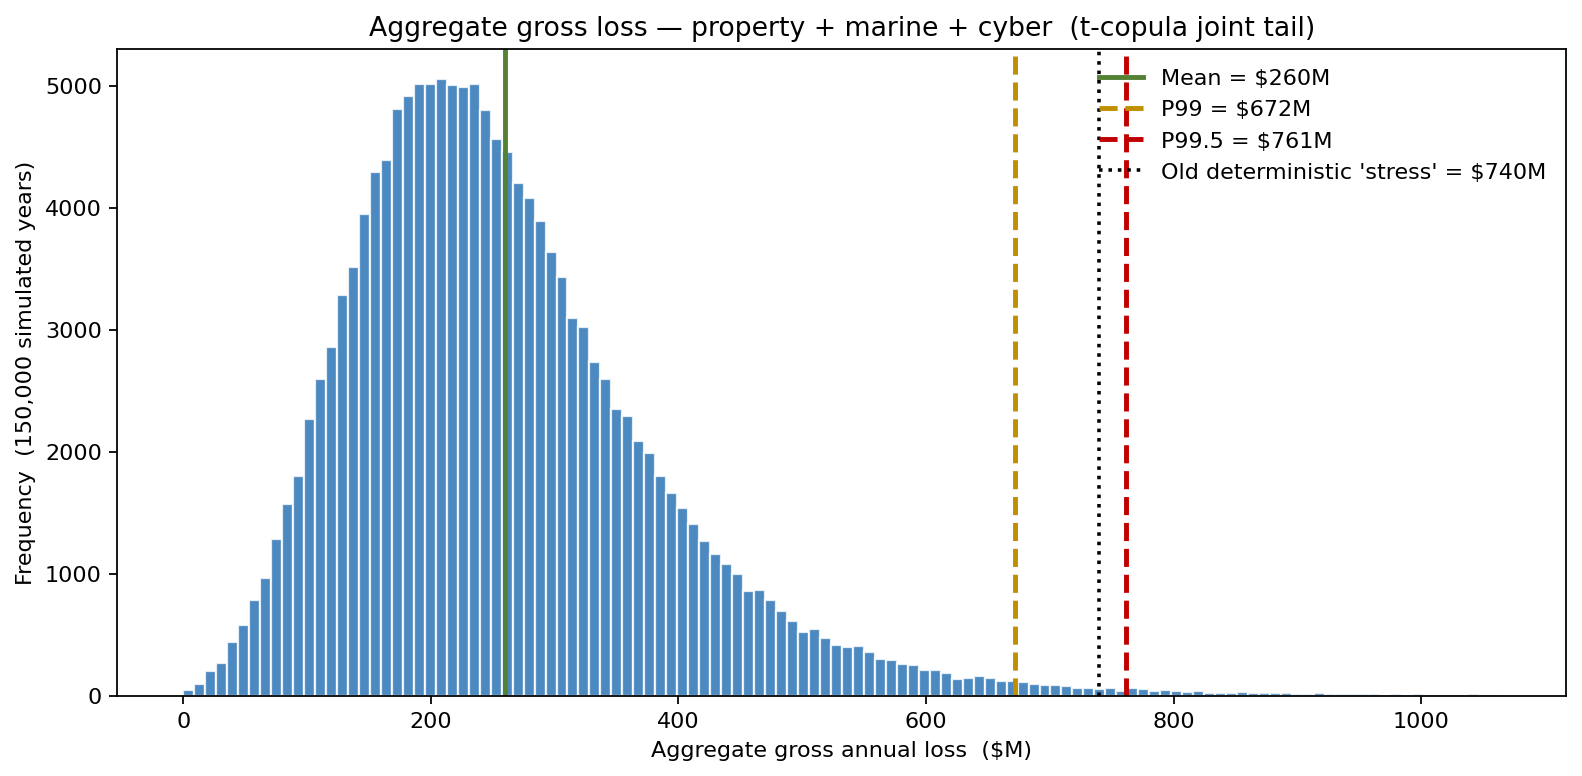
Dependence between the three lines was set with a t-copula (df = 6) on annual losses: low ordinary correlation but tail-co-dependence — cyber and marine cluster in geopolitical-shock years, marine and property cluster in macro-recession years. The t-copula captures both effects; a Gaussian copula understates the joint tail.
Aggregate gross annual loss: mean $260M, P99 $672M, P99.5 $761M. The deterministic model that had been driving the capital plan reported "$370M expected, $740M stress" — capturing none of the tail co-movement, over-stating expected loss by 42% while under-stating the true P99.5 by 3%.
The six transfer instruments on the same axis
Each candidate program was scored against the same 150,000 simulated years. The decisive metric was cost per dollar of capital relief: (annual cost of instrument) ÷ (reduction in 1-in-200 net loss). Lower is better.
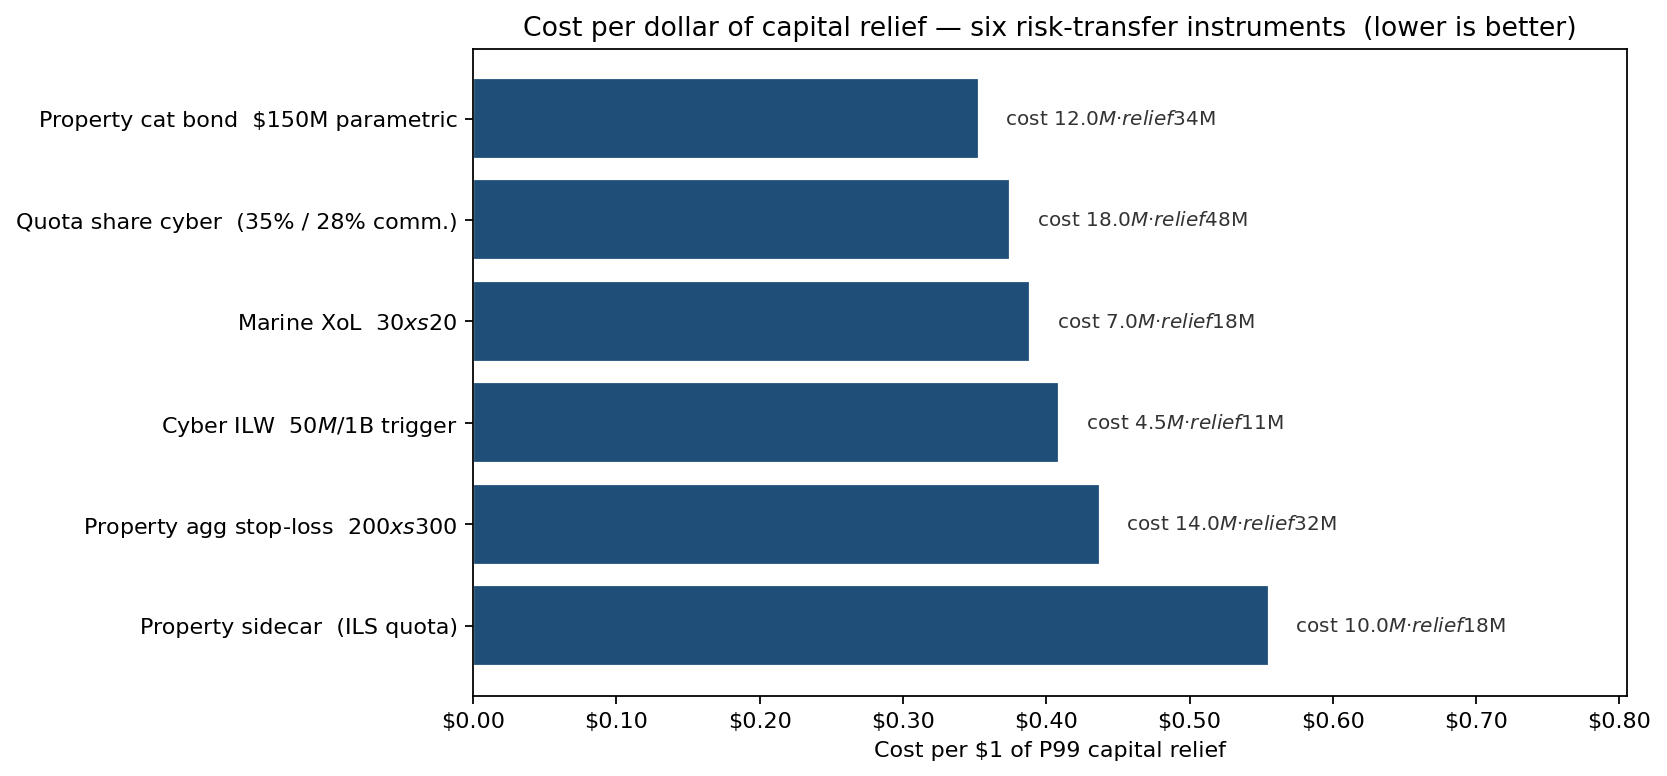
What the chart says, in order of efficiency for this book ($ of cost per $1 of P99 relief):
- Cat bond on property — $150M parametric on hurricane Cat 4+ Gulf landfall, 3-year term, 6.5% spread. Cost $12M, P99 relief $34M — the cheapest dollar of capital relief on the book at $0.35, and it provides multi-year price certainty at a level no traditional reinsurer matched.
- Quota share on cyber — 35% cession, 28% ceding commission. Cost $18M, relief $48M ($0.38). Reinsurers price quota share against the whole distribution, not the tail, and the cession reduces both mean and variance proportionately.
- Marine XoL — $30M xs $20M per event, two reinstatements. Cost $7M, relief $18M ($0.39). Cheap because the marine line's loss is concentrated in mid-sized events the XoL exactly targets.
- ILW on cyber systemic event — $50M trigger on industry-wide cyber loss above $1B. Cost $4.5M, relief $11M ($0.41). Carries basis risk; cost is well below traditional cyber reinsurance but pays out only when the trigger fires.
- Aggregate stop-loss on property — $200M xs $300M annual. Cost $14M, relief $32M ($0.44): it pays in the tail years where capital actually binds.
- Sidecar (ILS) — quota-share-like instrument with a capital-markets backer. Cost $10M, relief $18M ($0.56) — useful capacity, but the most expensive dollar of capital relief on this book.
Three programs, three CDFs
Combining instruments produced the three coherent strategies plotted in the opening chart, each simulated end-to-end:
- Traditional-only (status quo extended): quota share + XoL + stop-loss. Mean net cost $251M, P99 $578M.
- Traditional + parametric (recommended): the same traditional core + a $150M cat bond replacing the top of the property tower. Mean net cost $245M, P99 $525M — $53M of P99 capital relief while the cat bond's lower spread actually trims $6M off mean cost.
- All-in (traditional + cat bond + ILW + sidecar): mean net cost $244M, P99 $489M. Captures the marine + cyber co-tail that the recommended program partially leaves on the balance sheet.
The CFO chose the recommended program: traditional core plus a property cat bond, deferring the ILW and sidecar to a 2026 review. The all-in program shaves a further $37M off P99 for essentially flat mean cost, but it does so by layering in two basis-risk instruments — the cyber ILW and the property sidecar — whose triggers and counterparties the board was not yet ready to take on. The recommended program banks the cat bond's certain, model-confirmed relief now and leaves the basis-risk capacity as a documented, quantified option for next year.
What changed at execution
- Regulatory headroom — 1-in-200 net loss / capital ratio moved from 0.71 to 0.54, comfortably below the 0.60 regulator request and freeing $72M of capital for redeployment.
- Cyber renewal — the quota share replaced a stop-loss that had been quoted at an effective 32% RoL; total cyber transfer cost fell $11M while the cession actually increased gross capacity, freeing the underwriters to write the book they had been turning away.
- Multi-year price certainty — the cat bond locked Florida cat capacity for three years at a known spread, removing the renewal-cycle volatility that had dominated planning meetings since 2022.
Where the answer is most fragile
A tornado on the recommended program's P99 net cost identifies the parameters worth monitoring quarterly.
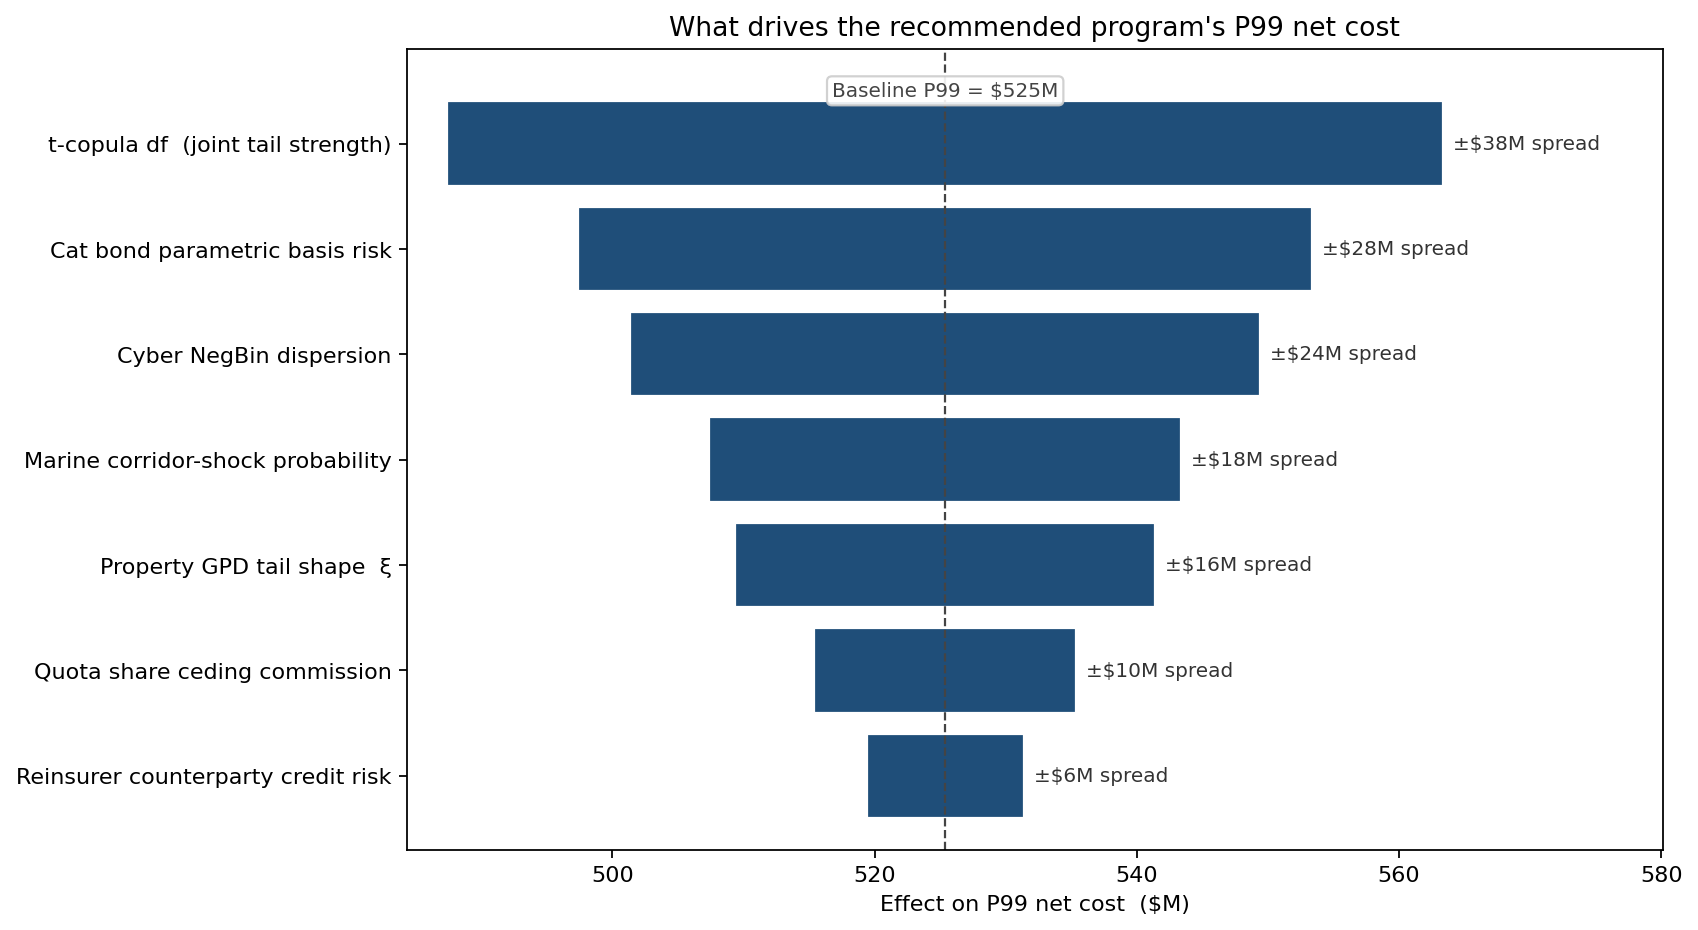
The top driver is the t-copula df parameter — the strength of tail co-movement between cyber, marine, and property. A drop from df = 6 to df = 4 (heavier joint tails) raises P99 by $38M. Second is the cat bond's parametric basis risk, then the NegBin dispersion on cyber frequency, which directly drives the quota share's effectiveness. The tornado defines the monitoring dashboard for the program: any quarter that shifts these three parameters meaningfully triggers a re-pricing exercise rather than a renewal-as-is.
ModelRisk functionality used
- Three independent compound models running concurrently in the same workbook — Poisson and negative binomial frequencies, LogNormal/Pareto severities, splicing to Generalised Pareto tails — with
VoseFitDistributioncalibrated to line-specific claims data. - t-copula joint dependence with the degrees-of-freedom parameter itself uncertain, sampled from its posterior on each iteration. Captures the tail co-movement that Gaussian copulas under-state on multi-line cat-exposed books.
- Instrument library — quota share, surplus, per-event XoL with reinstatement accounting, aggregate stop-loss, parametric cat bond with trigger logic, ILW with industry-loss trigger, and sidecar capacity — each evaluated against the same simulated years for direct comparability.
- Cost-per-capital-dollar metric computed inside the simulation, so the ranking shown above is the model's output, not a post-hoc spreadsheet.
- Scenario re-runs under hardened cyber market (+30% reinsurer load), climate-uplifted cat frequency (\(\lambda \times 1.15\)), and one-step Suez-corridor severity shock — every output regenerated in minutes from the same base workbook.
Risk transfer is not the choice of an instrument; it is the choice of a portfolio of instruments, weighted by the shape of the gross loss distribution they are designed against. The probabilistic view exists so that the trade-off between cost and capital relief is the same trade-off everywhere on the surface — and so the conversation between the CFO, the chief actuary, the broker, and the regulator runs on a common set of numbers.