

Industry: Insurance and Reinsurance
Product: ModelRisk
Application: Reinsurance Pricing
Pricing a Cat XoL Treaty: Building Technical Premium from Exposure and Experience
A property reinsurer was quoting renewal terms for a $200M xs $100M Florida cat layer for a regional cedent. The previous broker quote was 18% rate-on-line — $36M premium for $200M of capacity. The reinsurer's deterministic model said the expected loss was $11.4M, implying a loaded technical price near $24M. The two numbers disagreed by 50%, and the deciding question was not "who is right on the mean" but "what does the loss distribution actually look like in the layer being quoted?" That is a question only a probabilistic model can answer.
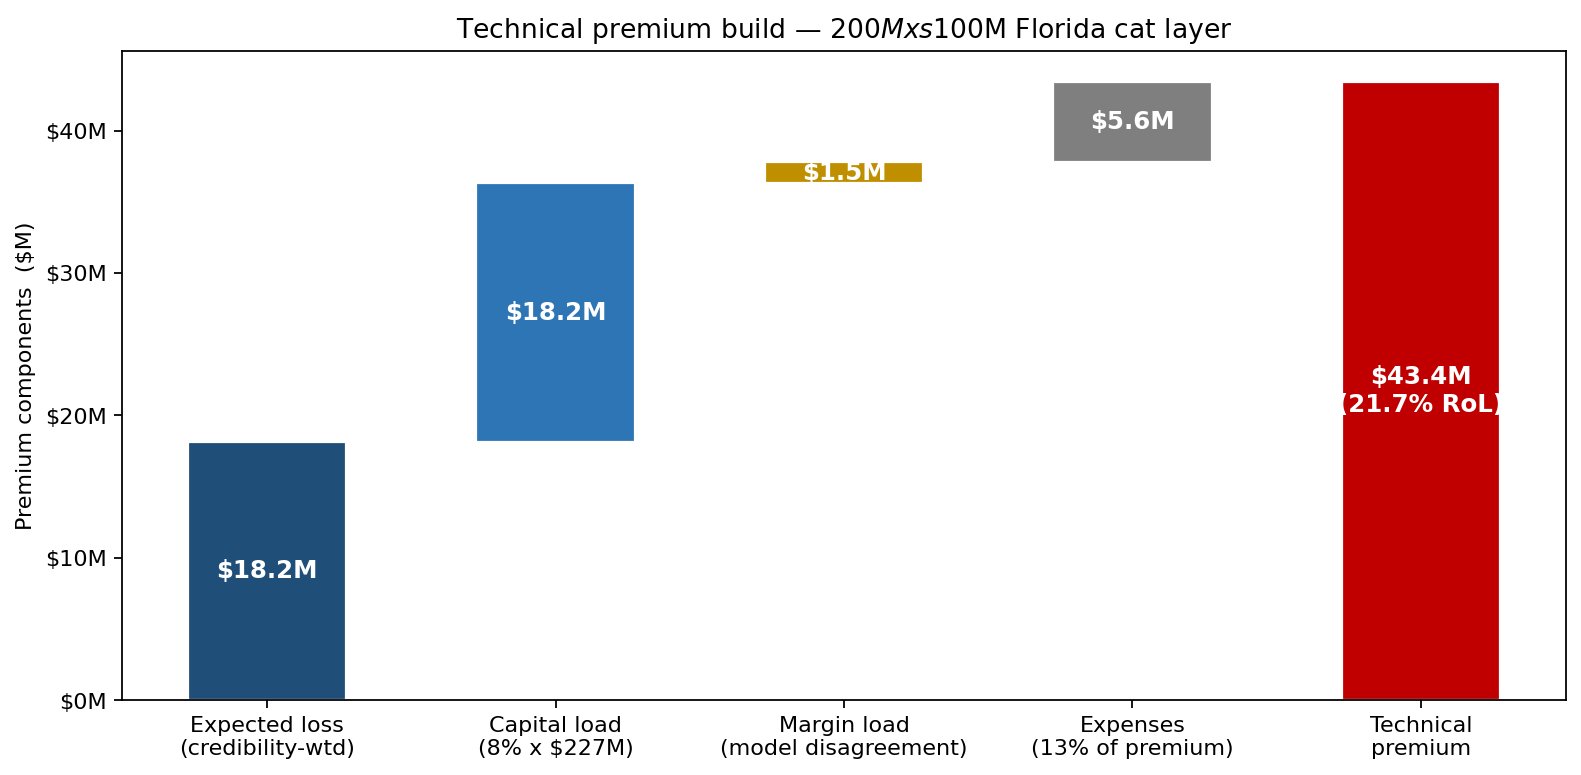
The pricing actuary rebuilt the treaty in ModelRisk and ran 100,000 simulated treaty years. The output that mattered was not a single technical premium but a distribution of underwriting result, from which premium, capital, and loading could be derived defensibly. Built up component by component, the technical premium lands at $43.4M — 21.7% rate-on-line once the cost of capital backing the layer is priced in, well above both the broker indication and the old deterministic estimate.
Two views of the same layer
Cat treaty pricing rests on two independent estimates of expected loss in the layer. A defensible price triangulates them and applies a load for the disagreement itself.
Exposure rating. Start from the cedent's exposure schedule, apply a vendor cat model's industry curve, and scale by the cedent's market share. The output is a per-event ground-up loss distribution for the cedent's portfolio. ModelRisk wrapped the vendor output in VoseLogNormal body + Generalised Pareto tail (shape \(\xi=0.32\), scale \(\beta=120\)) so the exposure curve carried the same tail behaviour as the original event set. Each per-event loss was then run through the treaty mechanics — $100M attachment, $200M limit, one reinstatement at 100% — to produce a per-event ceded loss.
Experience rating. The same cedent had 14 years of catastrophe history "as if" the treaty had been in force. The annual frequency of layer-hitting events fit a negative binomial (mean 0.42, dispersion 1.7) — using a plain Poisson here is the most common pricing error in cat. NB allows for over-dispersion that real catastrophe counts always show. Severity in the layer fit a truncated LogNormal.
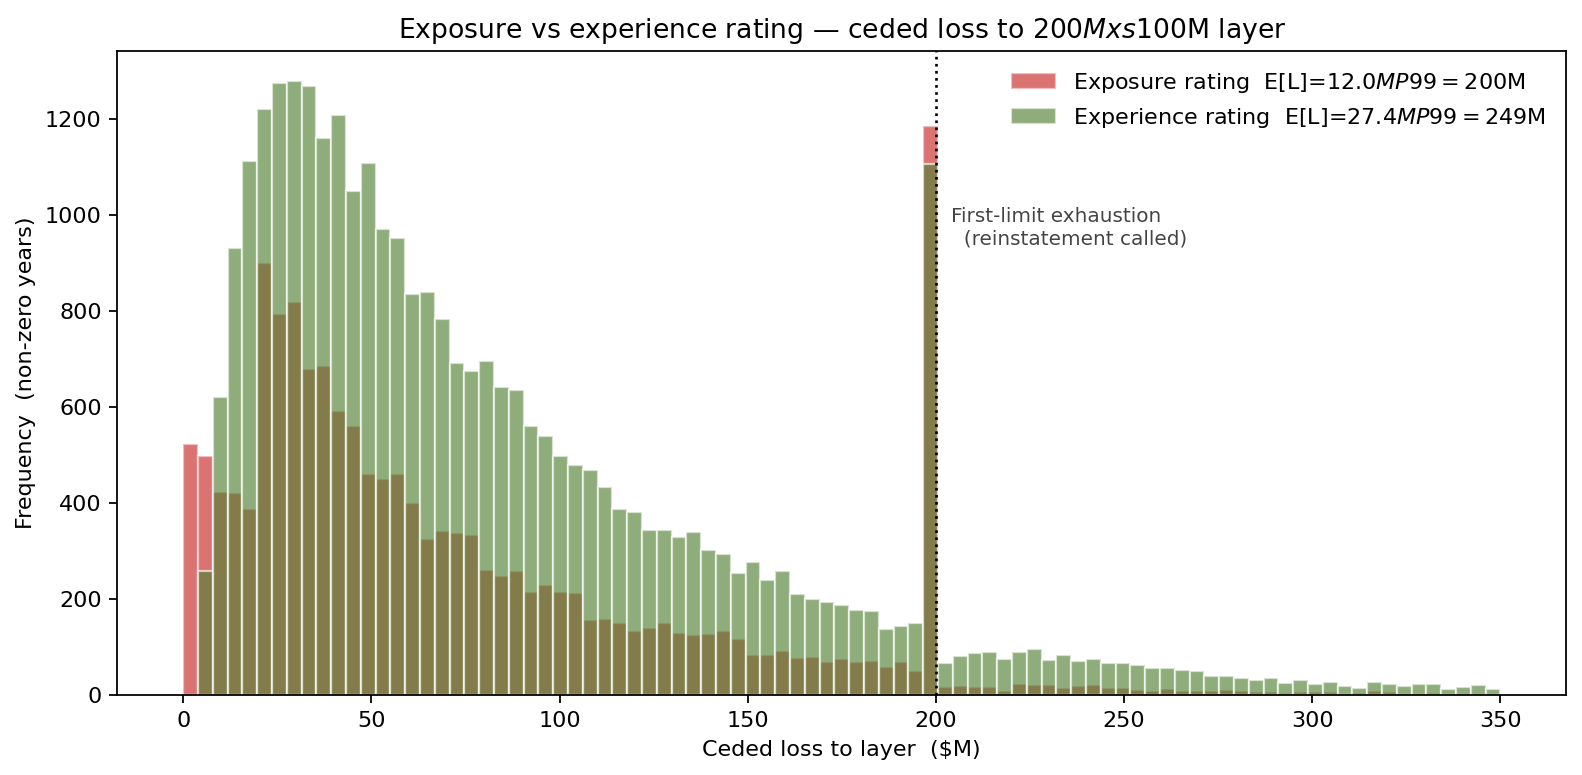
The two methods produced expected layer losses of $12.0M (exposure) and $27.4M (experience) — the experience view runs heavier because clustered seasons in the as-if record drive more frequent layer-piercing events. The reinsurer's pricing manual gave a 60/40 credibility weight (favouring the exposure view), yielding $18.2M pure expected loss.
Why one expected-loss number is not a price
The two distributions disagree on the mean by more than $15M and diverge again in the tail. The experience curve carries more weight above $100M of ceded loss — the regime where the treaty's single reinstatement matters most. A deterministic price built on the credibility-weighted mean would charge identically against both views and would price the reinstatement as if it were free, because the average never triggers the second limit. The simulation shows the reinstatement gets called in 0.4% of years on the exposure curve and 2.0% on the experience curve. That spread translates directly into how much capital the reinsurer must hold and therefore into the capital loading on top of the expected loss.
From expected loss to technical premium
The technical premium decomposes:
\[ P_{\text{tech}} \;=\; \mathbb{E}[L_{\text{ceded}}] \;+\; \rho \cdot \mathrm{Capital}_{99.5} \;+\; \mathrm{Expenses} \;+\; \mathrm{Margin} \]
- Expected ceded loss \(\mathbb{E}[L_{\text{ceded}}]\) — credibility-weighted, $18.2M.
- Capital charge — \(\mathrm{Capital}_{99.5} = \mathrm{TVaR}_{99.5}(L_{\text{ceded}}) - \mathbb{E}[L_{\text{ceded}}]\), the additional capital the reinsurer must hold beyond expected. Simulation gave TVaR 99.5% = $245M, so capital backing the layer = $227M. At a target return on capital \(\rho = 8\%\), that is an $18.2M load.
- Expenses — brokerage 10%, internal 3%, totalling \(\approx 13\%\) of premium.
- Margin — model-disagreement load, scaled to the gap between exposure and experience curves; here 8% of expected loss.
Solving for \(P\) with expenses as a percentage of premium gives a technical premium of $43.4M — 21.7% rate-on-line, as the opening build-up chart shows. The broker's 18% RoL quote, in other words, sat below the loaded technical floor: the capital cost of the layer's tail makes the risk more expensive to carry than the indication assumed, and the previous deterministic estimate of $24M was well under the capital-cost floor.
Where the price is most exposed
A tornado over the inputs ranks the drivers of technical premium.
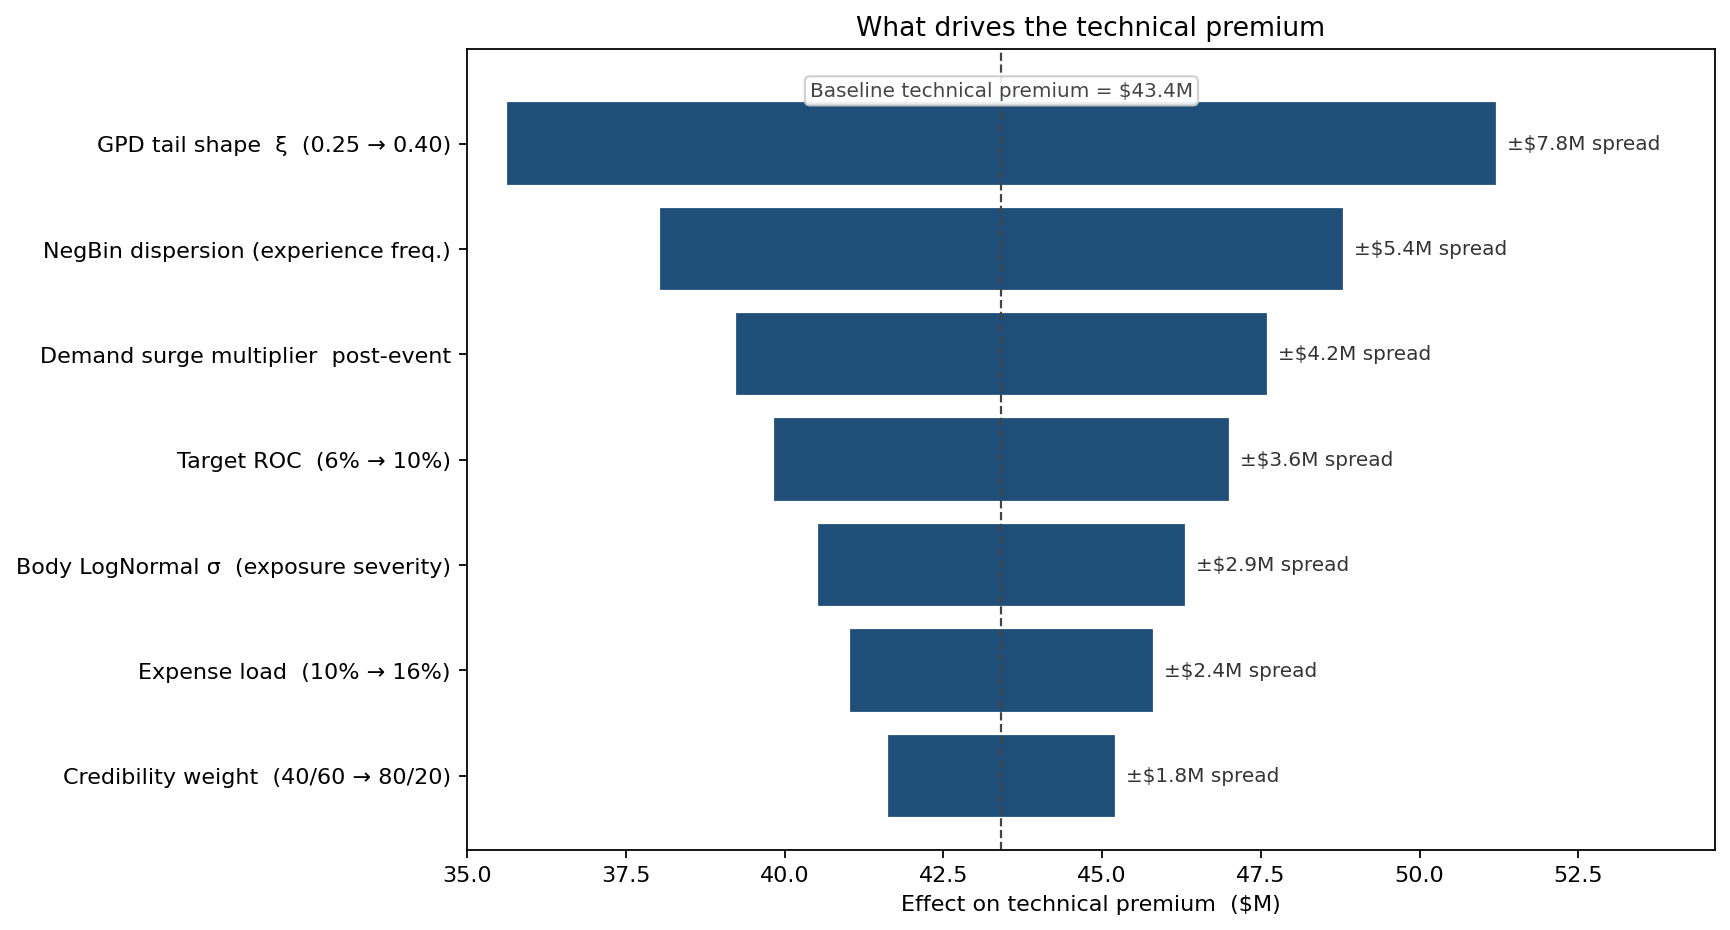
The single largest driver is the GPD tail shape parameter \(\xi\) on the exposure curve. Moving \(\xi\) from 0.25 to 0.40 — a range well inside the academic literature on Atlantic hurricane severity — moves the technical premium by $7.8M. The second-largest is the negative-binomial dispersion on experience frequency: clustered cat seasons (2004, 2005, 2017) push the dispersion up and lift both expected loss and TVaR. Demand surge post-event ranks third, ahead of expense load and target ROC. The tornado told the underwriter exactly which parameters to defend in committee — and which two-line caveat to put in the quote letter.
Stress scenarios and the line decision
Three scenario runs answered the question "what does the loss look like if the world is not the average year?"
- Climate-uplifted basin — \(\lambda \times 1.15\), tail shape \(\xi + 0.05\). Expected layer loss rises and technical premium climbs above $50M.
- Soft market — target ROC drops to 6%, dispersion held flat. Technical premium falls toward $38M; the layer remains profitable in the central scenario but the capital cushion shrinks.
- Tail-heavy realisation — exposure curve held, but assume the worst-fit decile on GPD parameters. P99 ceded loss rises 22%; the layer can still be written, but only with a higher line on the cedent's net worth covenant.
Because the loaded technical premium ($43.4M, 21.7% RoL) sat above the broker's 18% indication, the reinsurer did not match the quote. The line was rewritten with a tightened reinstatement clause and a written-down line size of 75% of the original ask, which pulled TVaR — and therefore the required premium — back toward terms the cedent would accept.
What changed
- Combined ratio target on Florida cat treaties moved from 92% to 88% as the loaded technical price replaced the historical-average price across the book.
- Capital allocated to a single treaty stopped being a fixed-share approximation and became
TVaR_99.5 - E[L], with the simulation rerun at every quarter-end. - Two treaties were declined at quoted terms because the loaded technical premium exceeded the broker indication by more than the underwriter's authority band. Both were re-quoted with structural changes the broker accepted.
ModelRisk functionality used
VoseFitDistributionon 14 years of as-if cat experience, producing the negative binomial frequency fit and the truncated LogNormal severity inside the layer.- Splice construction combining LogNormal body and GPD tail for the exposure-rating curve, parameter-uncertainty captured by sampling \(\xi\) from its own posterior (Beta around 0.32) on each iteration.
- Custom layer formula evaluating attachment, limit, and reinstatement mechanics inside
VoseAggregateMC— full per-event accounting, not annual approximations. - Tornado on technical premium ranking GPD tail shape and NB dispersion as the top two drivers — directly informing the quote-letter caveats.
- Scenario re-runs holding model architecture constant while shifting climate uplift, target ROC, and dispersion — produced the three loaded-premium scenarios above in a single workbook.
Reinsurance pricing is not "estimate the mean and add a load." It is the construction of a loss distribution in the layer being quoted, the conversion of that distribution into a capital number, and the conversion of that capital number into a price the reinsurer can defend on a Monday morning in front of the chief underwriter. ModelRisk is the bookkeeping that makes each of those conversions auditable.