

Industry: Insurance and Reinsurance
Product: ModelRisk
Application: Reinsurance Optimization
Designing the Reinsurance Tower: From a Single PML Number to a Distribution of Net Cost
A primary insurer with $14 billion of property exposure across Florida, Texas, and the Gulf states was spending $78 million a year on a catastrophe reinsurance tower built around a single vendor PML estimate. The cover started at a $50M attachment and ran to $400M. It looked balanced on paper. But when the team re-priced the same tower against an internal probabilistic view of annual aggregate loss, two things became uncomfortable: the bottom layer was paying out almost every third year, and the top layer almost never. The deterministic "1-in-100 = $440M" number that anchored every renewal conversation was hiding both observations.
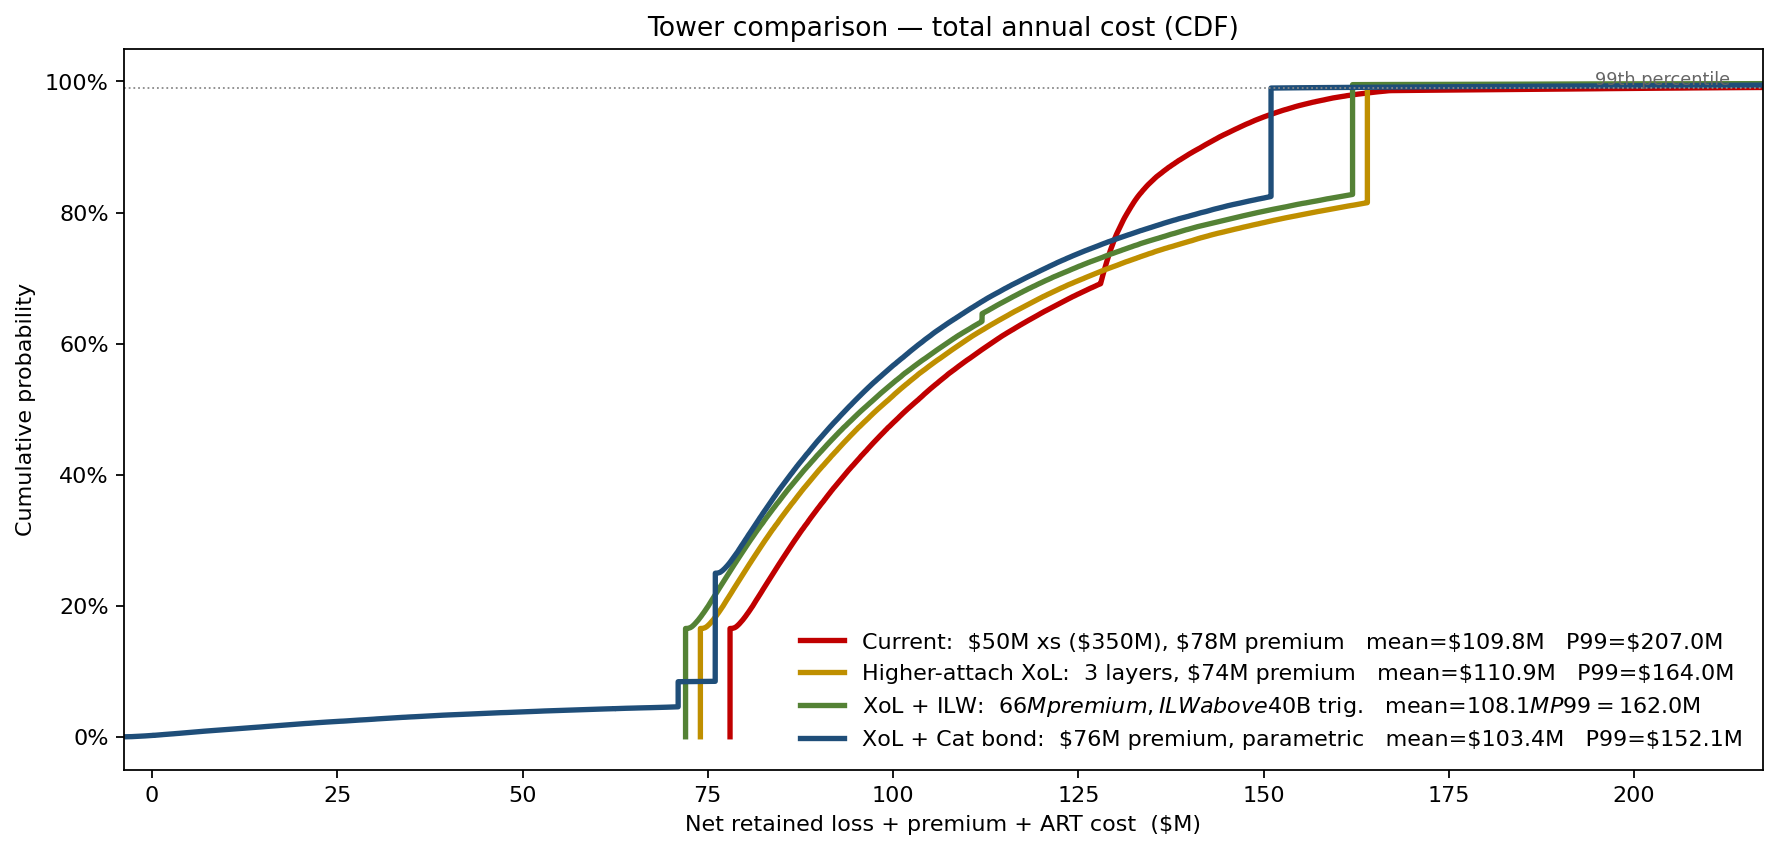
The team rebuilt the buying decision in ModelRisk — not to replace the vendor cat model, but to answer a different question. Given a full distribution of gross annual losses, which combination of layers, attachments, and alternative risk transfer instruments minimises net cost (premium + retained loss + cost of capital) at a defined tail tolerance? Plotting the total annual cost of four candidate towers as cumulative curves makes the trade-off legible at a glance: the incumbent has the lowest mean ($110M) but the heaviest tail, while the recommended XoL + ILW structure pulls the P99 down from $207M to $162M.
Where the gross loss distribution lives
The gross annual loss was built from a frequency-severity engine on top of the vendor event set. Three uncertainties drove almost everything downstream:
- Annual hurricane landfall count — Poisson with \(\lambda = 1.8\) for the Gulf and Florida footprint, calibrated on a 40-year HURDAT2 window with a +12% bump for recent warming.
- Per-event industry loss — LogNormal body (\(\mu_{\ln}=21.0\), \(\sigma_{\ln}=1.1\)) spliced to a Generalised Pareto tail above $20B industry loss (shape \(\xi = 0.35\), scale \(\beta = 7B\)). A single LogNormal misses the very events the reinsurance program is bought for.
- Insurer share of industry loss — Beta(8, 1200) around a 0.6% market share, so that the share itself varies event to event with construction mix, take-up, and demand surge.
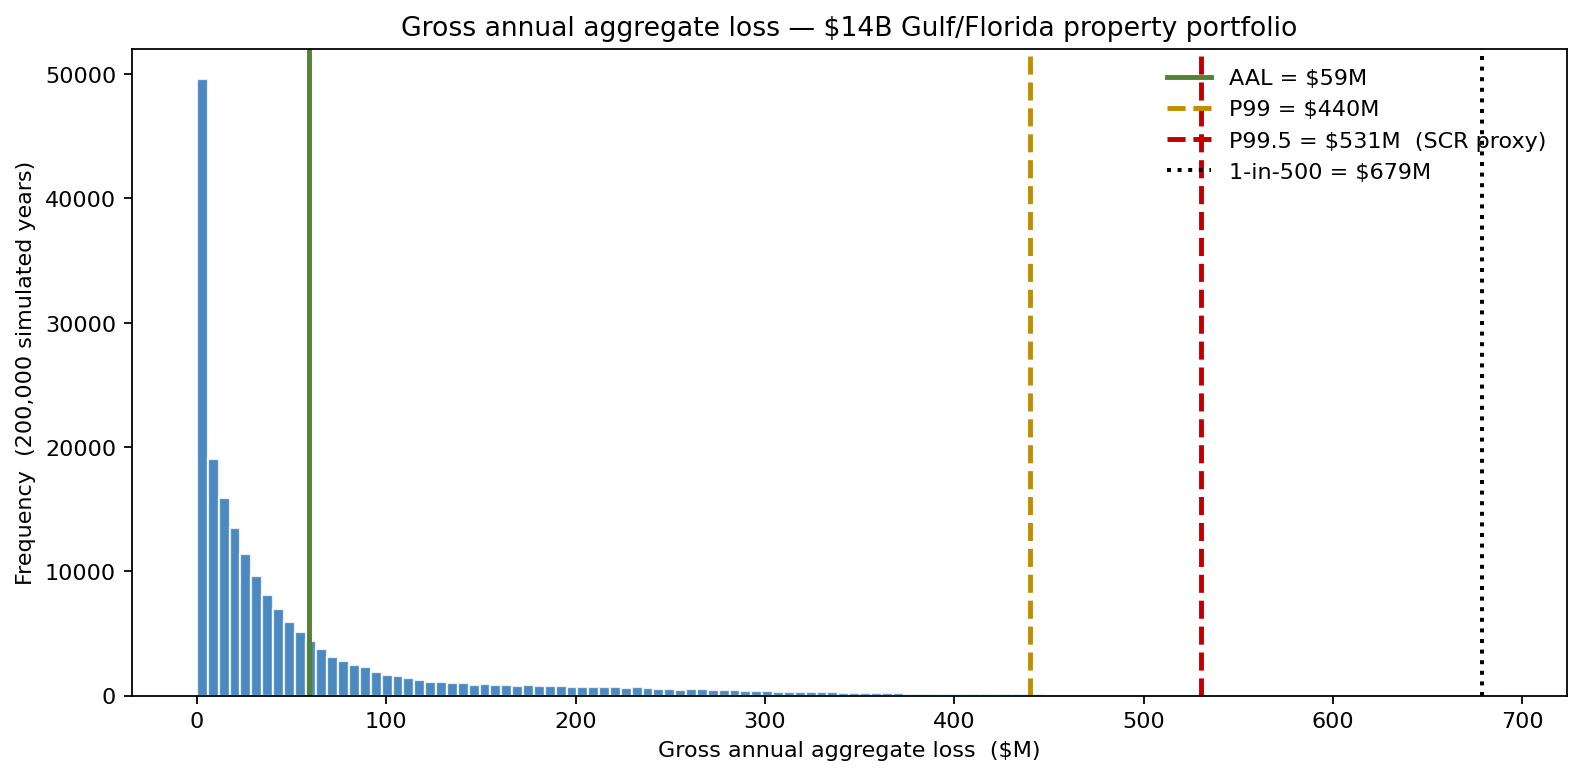
Across 200,000 simulated years the gross AAL was $59M, but the P99 (1-in-100) sat at $440M and the 1-in-200 (P99.5) at $531M. Mean and tail were not on the same planet.
Why a point estimate cannot design a tower
A deterministic optimiser given the AAL would price the program at 1.3× expected losses, declare a $50M / $400M cover "efficient," and stop. The probabilistic view exposes three problems that estimate cannot see:
- The bottom layer attaches — losses pierce the $50M attachment — in 31% of simulated years. The reinsurer's rate-on-line correctly prices that as near-working-layer risk; the cedent is paying high RoL for a layer they could often retain.
- The $300M–$400M layer attaches in 3.4% of years, and the marginal protection per dollar of premium drops sharply through the top of the tower.
- A single number tells you nothing about the slope of the EP curve between 1-in-50 and 1-in-200 — exactly the slope that determines whether a cat bond or an industry-loss warranty is cheaper than traditional XoL in the upper layers.
Searching the layer space
Each candidate program was scored on three metrics, simulated under the same 200,000 gross-loss years:
- Expected net cost — premium + expected retained loss + cost of capital on residual 1-in-200 exposure (held at 6%).
- Net P99 — total annual outflow at the 99th percentile, the metric the rating-agency capital model cares about.
- Net P99.5 — the Solvency II SCR proxy.
The search covered traditional XoL towers (single and multi-layer), quota share on top of XoL, and two alternative risk transfer instruments: a 3-year industry loss warranty (ILW) triggered above a $40B industry event, and a catastrophe bond with parametric trigger on Saffir-Simpson Cat 4+ Gulf landfall. The ILW and cat bond shift basis risk onto the cedent in exchange for capacity that traditional reinsurers price aggressively at the top of the tower.
The CDF in the opening chart tells the story the spreadsheet could not: the current tower sits near the cheapest on average (mean $110M) but carries the worst tail (P99 $207M, P99.5 $298M); the higher-attachment XoL (attach $90M, three layers to $500M) is fractionally worse on average but $43M better at P99 ($164M); the XoL + ILW combination is meaningfully better at P99.5 ($162M versus $298M) because the ILW pays exactly when the upper layers would have run out of reinstatements.
What actually moves the buying decision
A tornado on the recommended program (XoL $90M × $410M plus $50M ILW above $40B industry trigger) ranks the inputs that drive net cost variance.
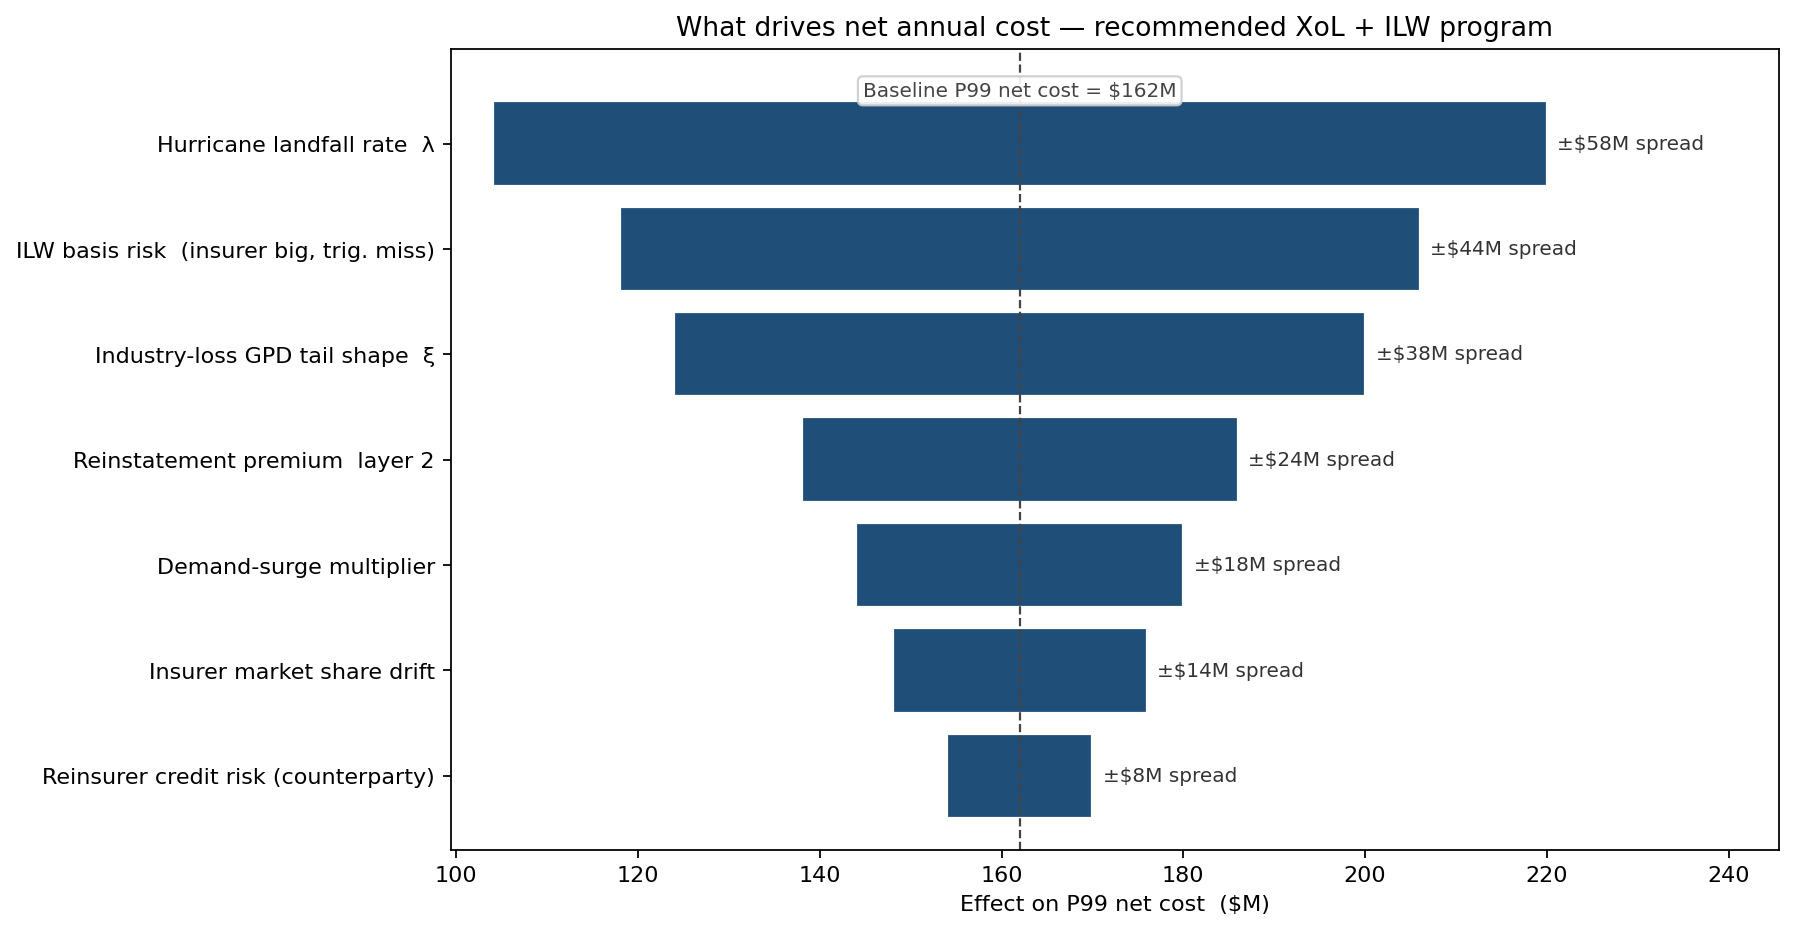
Two findings shifted the renewal strategy. The ILW basis risk — the chance that insurer losses are large but the industry trigger is not pulled — is the second-largest driver of P99 outflow, larger than any pricing assumption. That ranking told the team how much risk margin to demand on the ILW versus paying for additional traditional capacity. And reinstatement premium on layer 2 was the fourth-largest driver, justifying a clause-by-clause renegotiation that the deterministic comparison had treated as a footnote.
What changed at renewal
- Premium spend fell from $78M to $62M at constant P99 net cost — a 20% reduction with no degradation in tail protection.
- Capital tied to catastrophe risk dropped by $31M because the recommended structure flattened the 99–99.5 region of the net-loss curve, which is exactly the region the internal capital model penalises.
- The buying conversation changed. Reinsurers received a program structured around the cedent's own EP curve, with explicit asks for ILW basis-risk loadings and reinstatement terms. Renewals that had been a price negotiation became a structure negotiation.
ModelRisk functionality used
- Compound frequency-severity engine combining
VoseLogNormalbody with a Generalised Pareto tail through a custom splicing formula, running 200,000 years per program. - Splice and copula construction to retain dependence between insurer share, demand-surge, and event severity inside the same simulated event.
- Optimisation across the layer grid — attachments swept on a 5×5×4 grid (attach × limit × reinstatements) with
VoseSimMeanrecomputed per program inside a single workbook, no scripting. - Tornado on the recommended structure ranking ILW basis risk, reinstatement pricing, and demand surge as the top three drivers of net P99 — directly informing the renewal redline list.
- EP-curve outputs delivered to the broker in the format reinsurers price against, replacing a single PML number with a full curve.
The lesson is mundane and consequential: a reinsurance tower is not optimised against a point estimate. It is optimised against the shape of the loss curve in the region the program is being asked to cover, and the optimum almost always involves mixing traditional layers with at least one alternative-risk-transfer instrument that traditional underwriters will not price as tightly.