

Industry: Insurance and Reinsurance
Product: ModelRisk
Application: Claims Reserving
What the Chain-Ladder Cannot Show You
The chain-ladder is the most-used reserving method in P&C insurance, and it returns one number. For a long-tail casualty book where claims develop over 12–15 years, "one number" is a forecast of the median in a distribution that is heavy-skewed, fat-tailed, and dependent on inflation paths that have not happened yet. The IFRS 17 risk adjustment, the Solvency II 99.5% reserve risk capital, and the rating-agency stress tests all want something the chain-ladder does not produce: a distribution of ultimate loss, with the inflation, social-inflation and tail dependence written down explicitly.
A multi-line carrier with $2.1B of net reserves across motor liability, general liability, workers' compensation, and commercial property rebuilt its reserving framework in ModelRisk. The deterministic chain-ladder reserve was $2.14B. The probabilistic view said the mean ultimate was $2.23B, the 75th percentile (the standard IFRS 17 confidence-level target for the risk adjustment) was $2.32B, and the 99.5th percentile was $2.69B — a $550M tail the point estimate did not see. The whole shape of that exposure falls out of one chart:
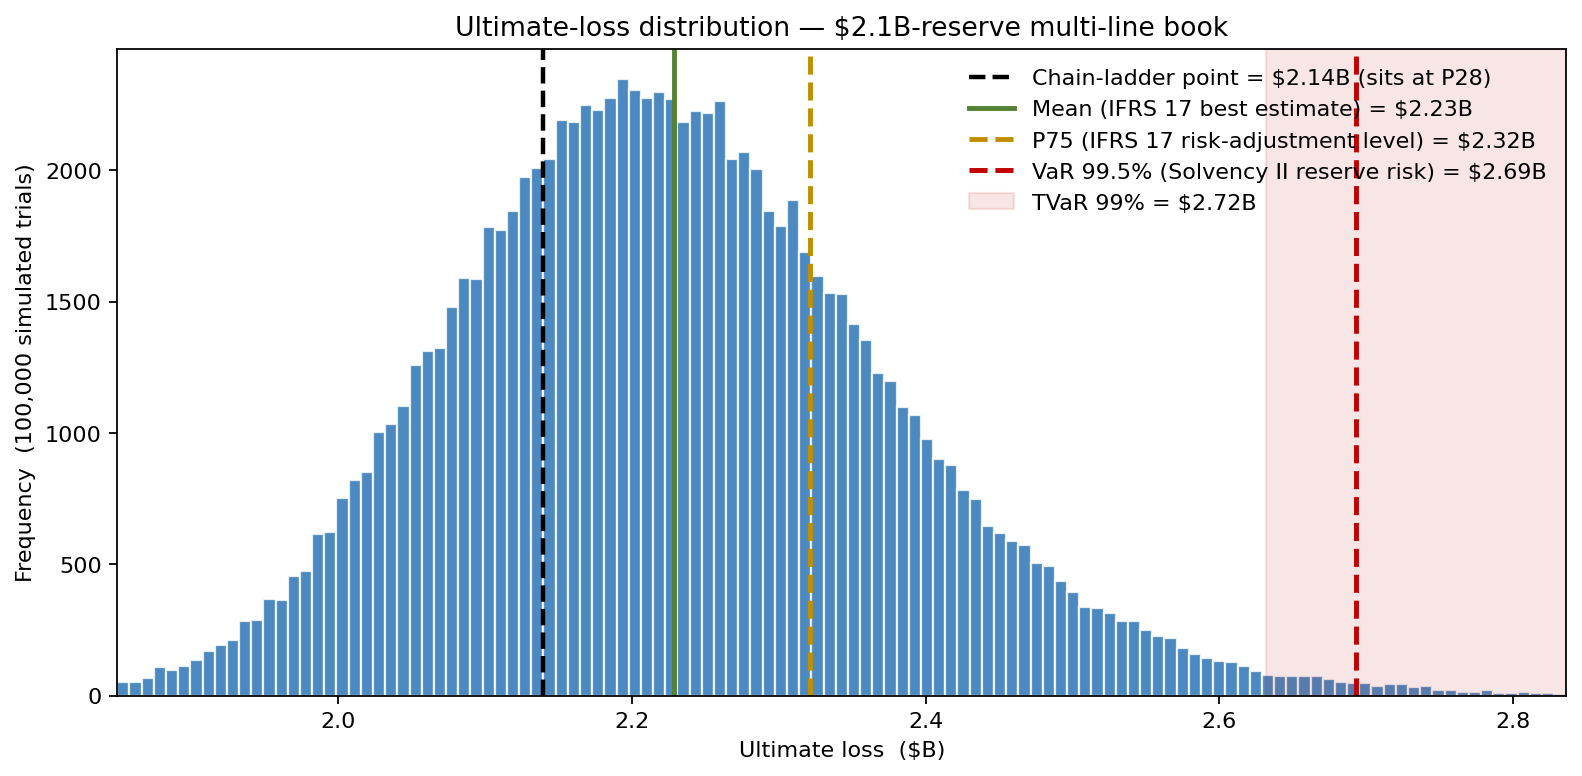
The single chain-ladder number lands at the 28th percentile of the simulated distribution — meaning a 72% chance the ultimate comes in above the booked reserve. Everything that follows is about reading that distribution rather than the one point estimate.
Distributions on the development factors
The chain-ladder reduces each development period to a single age-to-age factor. The stochastic version replaces each factor with a distribution. The team used three families based on the volume and behavior of the triangle:
- LogNormal for stable lines with well-behaved triangles (commercial property short-tail). The age-to-age factor for development period 2-to-3 was LogNormal with mean 1.18, P10 1.11, P90 1.26.
- Gamma for casualty lines where variance grows with the factor mean. Workers'-comp development period 5-to-6 was Gamma-shaped, mean 1.07, P10 1.02, P90 1.13.
- Triangular for newer specialty lines with limited history, where the actuary's min / most-likely / max judgment is more honest than a fitted distribution. Cyber-liability development used Triangular(1.05, 1.20, 1.55) at the early-development periods.
The Monte Carlo engine draws a complete set of factors per simulated trial — one full triangle's worth — applies them to the cumulative paid losses, and produces an ultimate-loss draw. Repeat 100,000 times and the empirical distribution of ultimate losses is the reserve risk distribution shown above.
The chain-ladder's $2.14B sits at the 28th percentile of that distribution. That is a real finding: the deterministic method, on this data, sits low relative to the simulation mean — and the gap is exactly the "best-estimate vs. probability-weighted mean" gap that IFRS 17 forces firms to recognize.
Why the deterministic answer cannot move
For each line the chain-ladder is a fixed function of one triangle. Inflation does not enter as a stochastic input — it is implicitly baked into the historical paid-loss pattern. Social inflation (the trend in casualty severity that has run at 5–9% per year in U.S. tort markets since 2018) is invisible. The Monte Carlo model puts both in explicitly. General inflation is modeled as a regime-switching process rather than the geometric Brownian motion the old model used — GBM compounds in a single state at constant drift and cannot represent the abrupt low-to-high regime shift the post-2021 period actually delivered — drawing from a low-inflation regime 80% of the time and a high-inflation regime 20% with persistence 0.85. Social inflation is modeled as a separate per-year multiplier on casualty severity with Triangular(1.02, 1.06, 1.12) and 0.6 autocorrelation across years.
The deterministic reserve is one number across all inflation paths. The stochastic reserve is a distribution shaped by the inflation paths.
Three macro scenarios, three reserve curves
The same engine reruns under three macro calibrations: a low-inflation scenario (general 2.5%, social 3%), a baseline (general 3.5%, social 6%), and an adverse scenario (general 5.5%, social 9%).
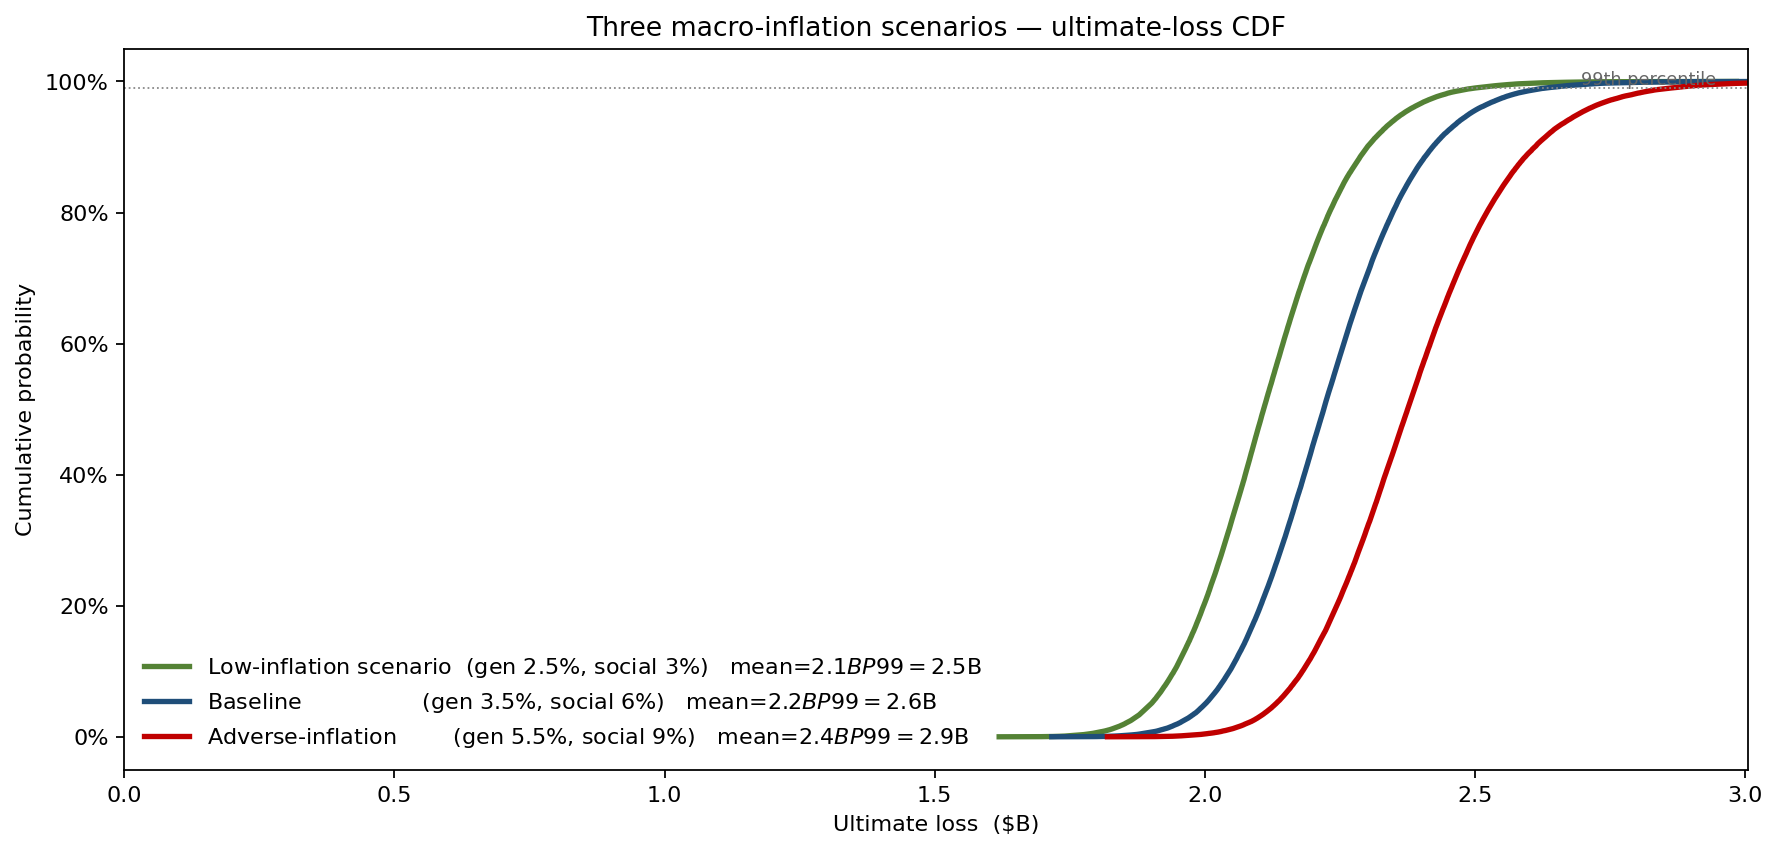
The 99th-percentile ultimate under the adverse scenario is $2.86B — $232M higher than the baseline 99th percentile of $2.63B. That gap, multiplied by the firm's view of how likely the adverse scenario actually is, becomes a defensible IFRS 17 risk-adjustment uplift that the chain-ladder could not motivate on its own.
What actually moves the reserve
Sensitivity ranking on the 99.5% ultimate loss isolates which assumptions deserve more research:
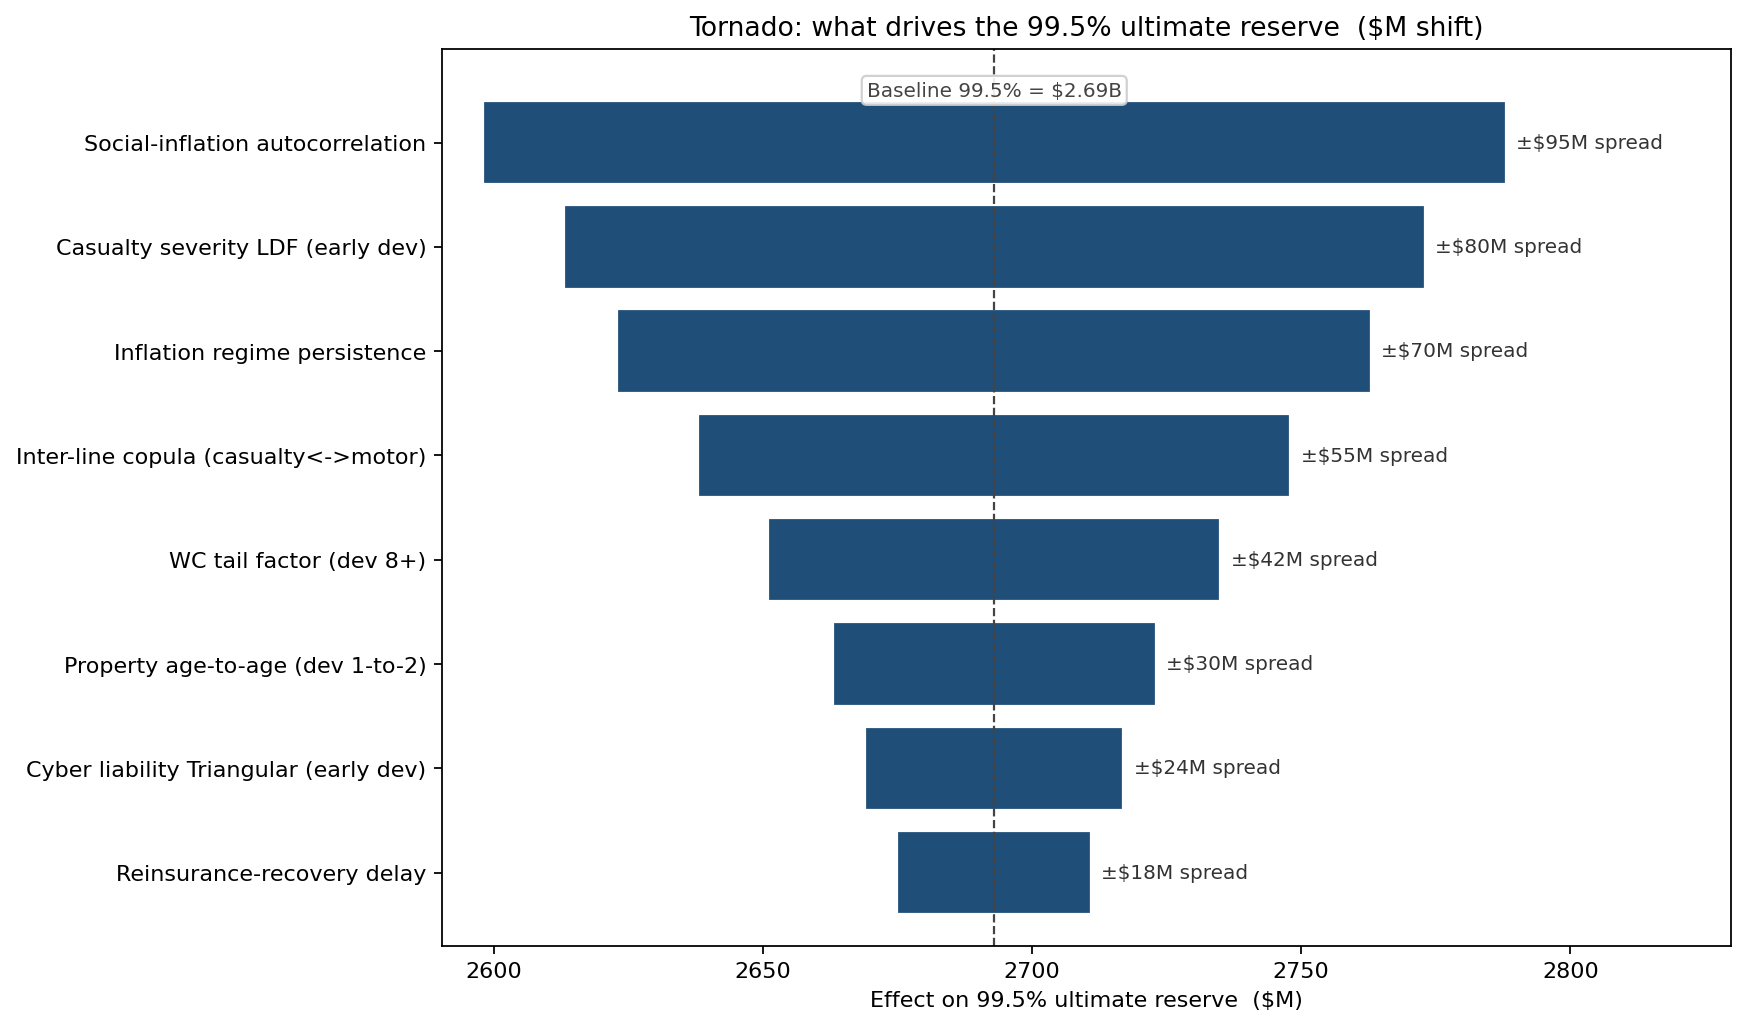
The top mover is the social-inflation autocorrelation parameter — varying it across its plausible range moves the 99.5% reserve by ±$48M, the widest bar on the chart. That ranking redirected the actuarial research budget toward jury-verdict and settlement-trend studies rather than further refinement of the early-development chain-ladder factors, which ranked sixth.
Reserve-adequacy testing made concrete
The firm's booked reserve was $2.14B (the deterministic chain-ladder). Plotting that against the probabilistic distribution gives a direct probability of inadequacy: the booked reserve sits at the 28th percentile of the simulation. There is a 72% chance the ultimate will exceed it. That number became the trigger for a $160M IBNR strengthening at year-end — not because regulators demanded it, but because the simulation made the asymmetry of being short impossible to ignore.
What the model changed
- IFRS 17 risk adjustment cut variance by 28% quarter-over-quarter. The chain-ladder + manual judgment approach produced a risk adjustment that moved ±$40M on quarterly close; the simulation-anchored version moves ±$11M because the assumption drivers are explicit and trackable.
- $160M IBNR strengthening on the casualty book in year one, motivated by the booked reserve sitting at the 28th percentile of the simulated distribution.
- Reinsurance program reshaped. An inflation-linked aggregate cover was added on the casualty book after the scenario analysis showed adverse-inflation ultimates exceeding $2.86B with non-trivial probability — a tail the deterministic view could not price.
- Audit conversation shorter, not longer. The Big-4 audit team and the regulator both received the same workbook the actuaries used. The probabilistic outputs replaced a two-week back-and-forth on "where did the IBNR judgment come from?" with a single afternoon walk-through of the simulation drivers.
ModelRisk Functionality Used
- Stochastic chain-ladder — every age-to-age factor replaced by a distribution (LogNormal, Gamma or Triangular per line) drawn jointly per iteration, producing 100,000 ultimate-loss triangles instead of one.
- Regime-switching inflation with low-state mean 2.5% and high-state mean 6.5%, persistence 0.85 — appropriate for the current macro regime where mean-reverting GBM would have been wrong.
- Triangular social-inflation multiplier on casualty severity with 0.6 year-on-year autocorrelation, separating tort-trend risk from general inflation risk.
- Per-line copula linkage so the casualty and motor liability ultimates draw correlated inflation paths — independence here understates the reserve risk.
- VaR(99.5) and TVaR(99) outputs feeding the Solvency II reserve-risk capital line, plus the 75th-percentile output feeding the IFRS 17 risk adjustment.
- Tornado sensitivity on the 99.5% ultimate that re-ranked the actuarial team's research priorities — putting social-inflation studies above further chain-ladder refinement.
The chain-ladder gives you a best estimate. The probabilistic view gives you the shape of what the best estimate is sitting inside — and on a long-tail casualty book in an inflationary regime, that shape is what the regulator, the auditor, and the rating agency actually want to see.