

Industry: Insurance and Reinsurance
Product: ModelRisk
Application: Claims Fraud Detection
Triaging 1.4M Claims a Year, One Fraud Probability at a Time
The Coalition Against Insurance Fraud estimates U.S. P&C carriers lose about $45 billion per year to claims-side fraud — roughly 10% of paid losses. A motor insurer handling 1.4M claims annually with an average paid loss of $4,200 is exposed to an embedded fraud bill on the order of $400M. The constraint is not detection in the abstract. It is investigator hours. A Special Investigation Unit of 80 adjusters can deeply review perhaps 12,000 claims per year. The pricing question is brutal: which 12,000?
A national auto insurer rebuilt that triage decision in ModelRisk. The point was not a black-box "fraud score" — those already existed and were already wrong about half the time at the operational threshold. The point was to put a probability distribution of fraud, expected recovery, and investigation cost on every claim, so the SIU could allocate hours to where the marginal recoverable dollar was highest, with the uncertainty in that decision made explicit. Spread across the whole 1.4M-claim book, those per-claim fraud probabilities look like this:
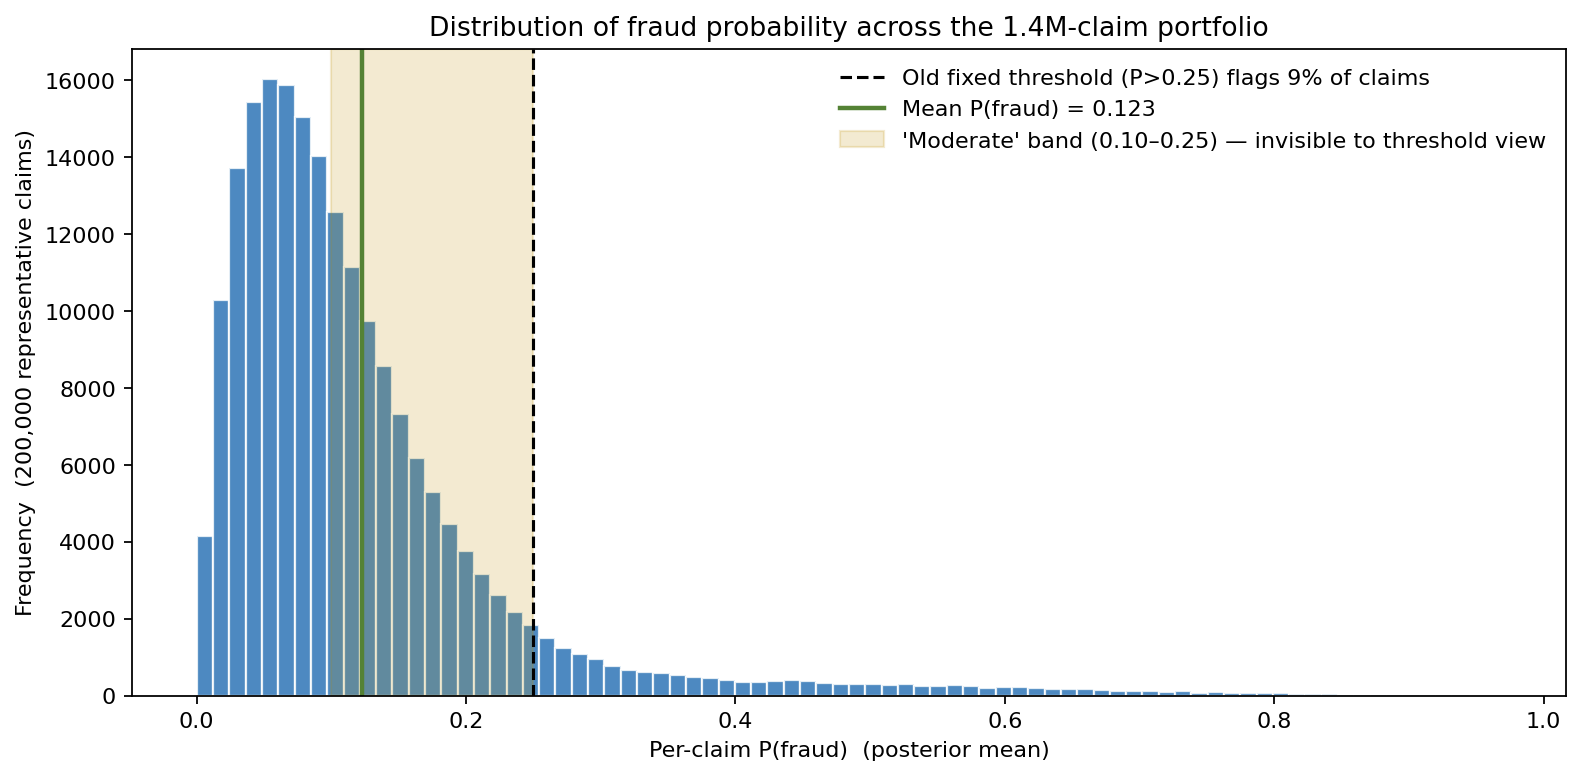
The mean fraud probability is 0.123, and the old fixed threshold of P > 0.25 flags only about 9% of claims — leaving a fat "moderate" band between 0.10 and 0.25 that the threshold view never sees. That band is where most of the recoverable-dollar opportunity turns out to hide.
Building a per-claim fraud-probability distribution
For each claim the model produces a distribution of \(P_{fraud}\), not a point score. The base rate for the claim's segment (e.g. soft-tissue bodily injury, single-vehicle late-night collision, total-loss theft) comes from a Beta prior fitted to 5 years of confirmed-fraud outcomes — Beta(\(\alpha, \beta\)) is the right choice here because \(P_{fraud}\) is bounded on [0, 1] and the segment sample size sets the prior's strength. The base rate is then updated by independent red-flag indicators combined as log-odds:
\[ \text{logit}(P_{fraud}) = \text{logit}(p_0) + \sum_k \beta_k \, R_k + \varepsilon \]
with each \(\beta_k\) itself a distribution (a Normal centered on the logistic-regression coefficient, with standard error from the fit) and \(\varepsilon\) capturing model error. ModelRisk samples coefficients, base rates and unobserved noise together, so the per-claim output is a full posterior on \(P_{fraud}\) — not a single number with a confidence interval bolted on.
For a typical "tier 3" claim the posterior comes out as mean 0.18, P10 0.09, P90 0.31. The point-score system reported "0.18 — below the 0.25 investigation threshold." The distribution says there is a roughly 1-in-4 chance this is actually a high-fraud-probability claim that the threshold view discards.
Why the threshold view is wrong
A deterministic threshold of \(P_{fraud} > 0.25\) flagged about 9% of claims — on the order of 125,000 a year, ten times what the SIU could actually investigate. The result was a queue managed FIFO, with the 12,000 reviewed claims being roughly the first 12,000 to arrive above threshold. The Monte Carlo view replaces "is this claim above 0.25?" with expected recoverable dollars from investigating this claim:
\[ E[\text{Recovery}] = P_{fraud} \times C \times R - K \]
where \(C\) is the claim amount, \(R\) the investigator-recovery rate (a Beta with mean 0.42, P10 0.28, P90 0.55 calibrated to historical SIU outcomes), and \(K\) the investigation cost (Triangular, $250 / $450 / $1,100 by claim complexity). The triage now ranks claims by the mean of the \(E[\text{Recovery}]\) distribution, with the spread of that distribution flagging high-uncertainty claims that should be sampled rather than ignored.
Before and after: where the marginal hour goes
The before-and-after comparison of recovered fraud dollars per investigated claim:
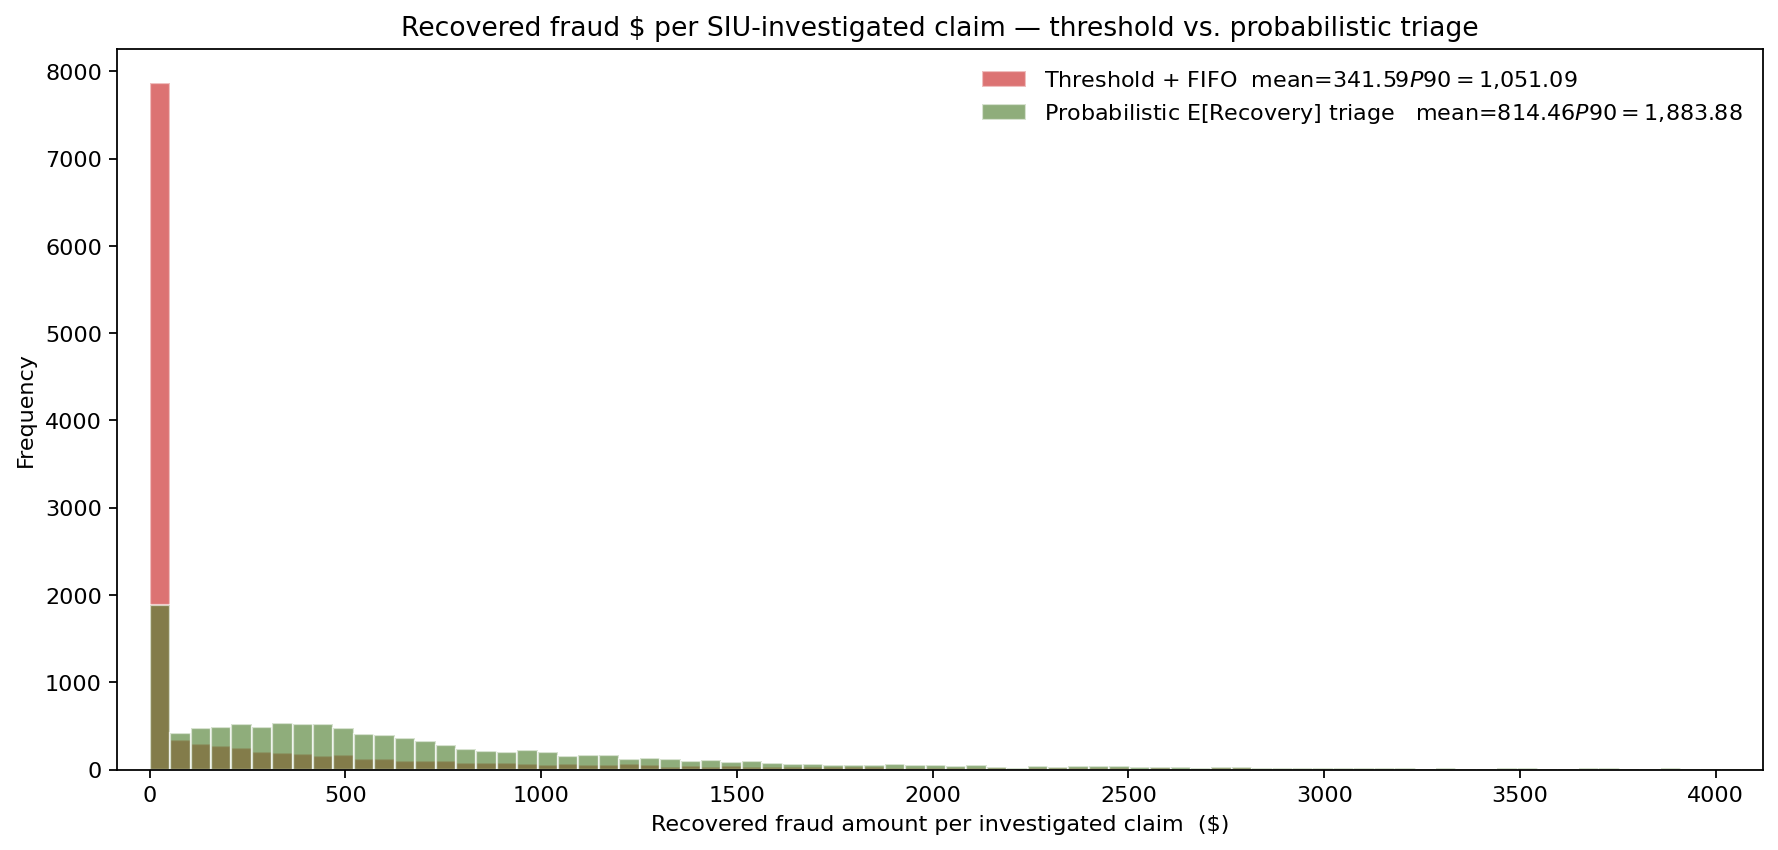
Under the FIFO-threshold regime the mean recovered amount per investigated claim was $342; under the probabilistic triage it became $814 — a 138% lift on the same 80 investigators and the same 12,000 reviews per year. P90 recovery rose from $1,051 to $1,884. The lift comes almost entirely from de-prioritizing high-probability/low-value claims (small windshield-replacement frauds) and surfacing moderate-probability/high-value claims (organized staged-collision rings on commercial policies) that the threshold view never queued.
What actually moves the recovery number
Sensitivity ranking on expected annual recovery isolates which inputs the answer depends on:
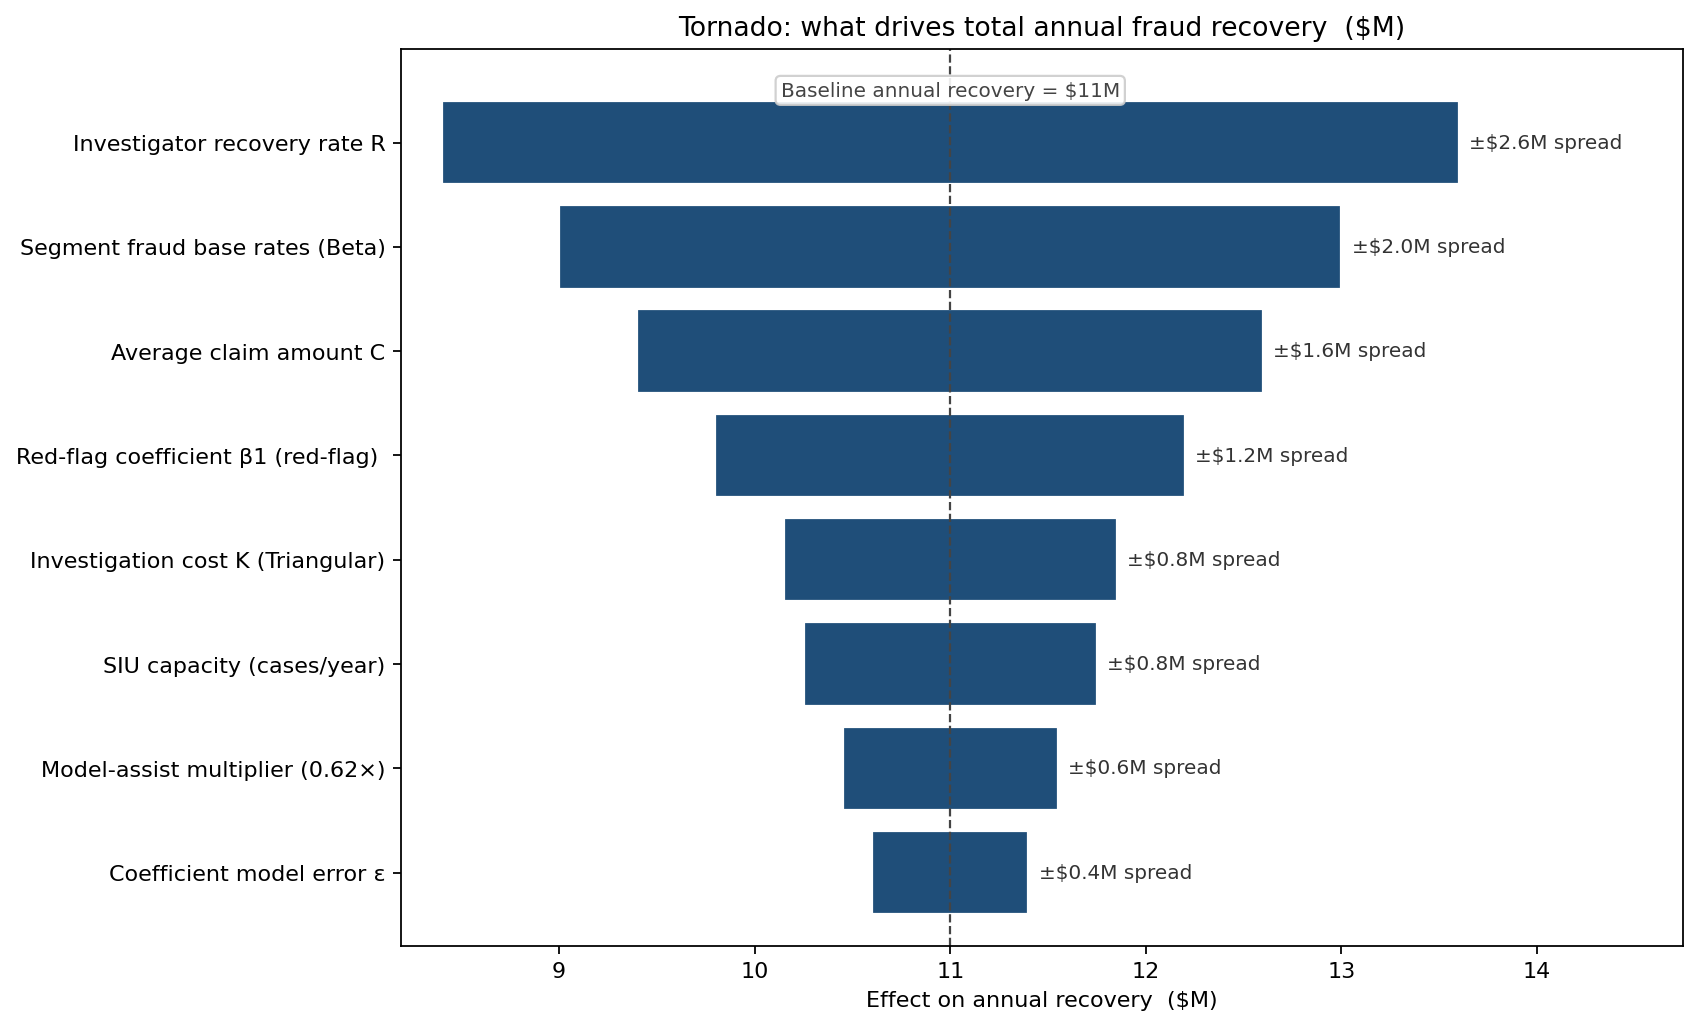
The biggest mover is the investigator-recovery rate \(R\) — varying it across its 90% CI shifts annual recovery by ±$1.3M, the widest bar on the chart, against the $11M baseline. That ranking changed the SIU's training budget: a $400k investment in interview and digital-forensics training had a higher expected return than adding three investigators, because it directly compounds the recovery rate on every reviewed claim.
Three policy scenarios, three outcomes
Three operating scenarios were compared on the same simulation engine: the current 80-investigator baseline, a +20% staffing scenario, and an automation-augmented scenario where 30% of low-complexity claims are reviewed by a model-assisted workflow that costs $90 per review and recovers 0.62× of what a human investigator recovers.
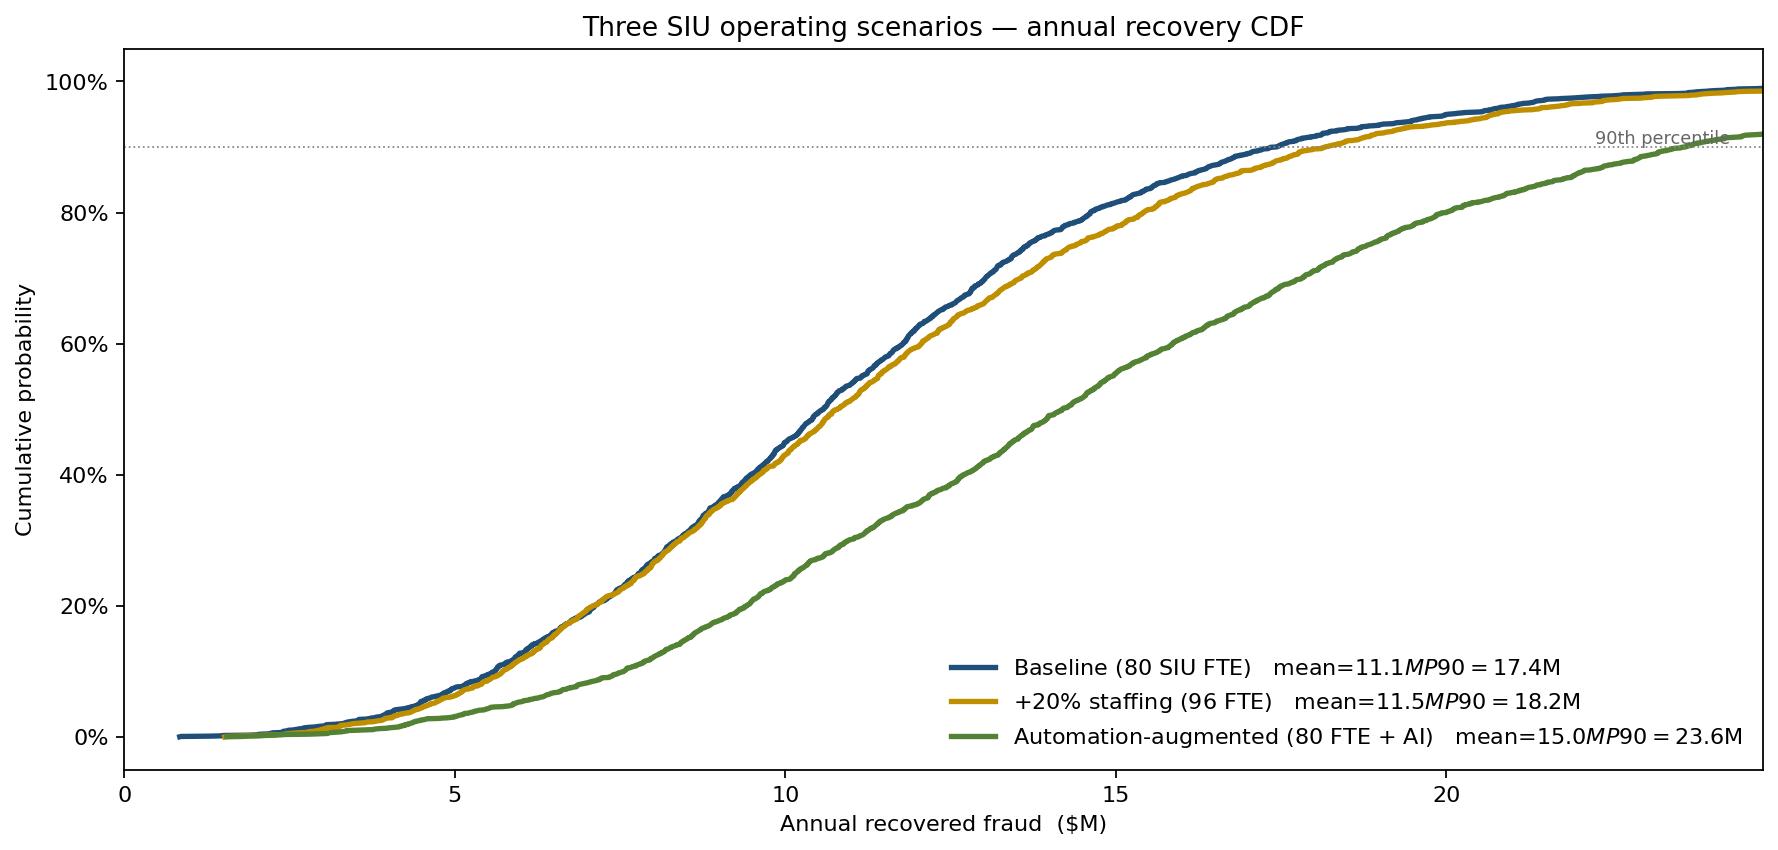
The result is a textbook diminishing-returns picture. The +20% staffing scenario barely moves mean annual recovery — it stays near $11M — because the extra investigators work their way down to lower-value claims whose marginal recoverable dollars are small, and it costs a fully-loaded $4.2M to get there. The automation-augmented scenario lifts the mean to $15M at a cost of $1.1M and — critically — raises both ends of the distribution: the P10 floor rises from $6M to $8M and the P90 ceiling from $17M to $24M, because the cheap model-assisted tier keeps clearing the queue when human capacity is constrained by leave or training. More people chasing the same ranked list is the wrong lever; more throughput on the ranked list is the right one.
What the model changed
- Annual recovered fraud roughly doubled — from about $4M to about $11M — at constant SIU headcount in year one, driven by re-ranking the queue on expected recoverable dollars rather than a fixed score threshold.
- False-positive investigations fell 31% — investigator hours wasted on claims that turned out clean dropped because the triage de-prioritized high-probability low-value claims that contributed mostly noise to the recovery line.
- The "moderate fraud probability" gap closed. Claims with \(P_{fraud}\) between 0.10 and 0.25 had been invisible to the threshold system. They turned out to contain ~$2M of recoverable fraud per year, mostly on commercial-fleet policies.
- Investigator-training spend reprioritized. The tornado put recovery-rate \(R\) at the top of the sensitivity ranking, and a $400k forensics-and-interview training program returned more than three additional investigators would have.
ModelRisk Functionality Used
- Per-claim posterior simulation of \(P_{fraud}\) — Beta segment priors updated by logistic red-flag coefficients with parameter uncertainty propagated, generating a distribution (mean, P10, P90) on every one of 1.4M claims.
- Beta and Triangular fits to historical SIU data for the recovery rate \(R\) (mean 0.42, P10 0.28, P90 0.55) and investigation cost \(K\) (Triangular $250 / $450 / $1,100 by complexity).
- Custom Excel triage formula combining \(P_{fraud}\), claim amount, recovery rate and cost into a per-claim \(E[\text{Recovery}]\) distribution, with the queue re-sorted automatically by mean recoverable dollars.
- Tornado sensitivity ranking eight drivers of total annual recovery, which redirected the unit's training budget to the recovery-rate lever.
- Scenario simulation comparing baseline, +20% staffing, and automation-augmented operating models on identical claims data, isolating the P10 risk reduction of automation.
- Output dashboards feeding the SIU's daily work queue with re-ranked claims plus their \(E[\text{Recovery}]\) confidence bands so adjusters know which calls are firm and which need a sampling check.
Claims-fraud detection is not a yes/no decision on a fixed score threshold — it is the allocation of a scarce hour against a distribution of expected recoveries. Monte Carlo simulation in ModelRisk is what turns the SIU queue into that allocation, with every dollar of recovery defended by the distribution that produced it.