

Industry: Insurance and Reinsurance
Product: ModelRisk
Application: Claims Adjudication
Three Doors per Claim: Pricing Settle, Negotiate, and Litigate with Monte Carlo
A disputed bodily-injury liability claim with a $250,000 reserve sits in front of an adjuster. The first offer is on the table at $112,000. Plaintiff's counsel has signalled they'll go to verdict if pushed. The adjuster has three doors: settle now, mediate to negotiated payout, or litigate. Each door is a cost distribution, not a number — and the door whose distribution looks cheapest on average is rarely the one that looks safest in the tail. This is what makes claims adjudication, at the per-claim level, a probabilistic problem rather than a workflow problem.
A casualty insurer's complex-claims unit, which adjudicates roughly 14,000 contested liability files per year, rebuilt its decision template in ModelRisk. The goal was to put each open file through a structured Monte Carlo treatment so that adjusters could see — file-by-file — what their reserve number actually covered and which "door" the file's loss distribution recommended. For the canonical file above, the three doors look like this:
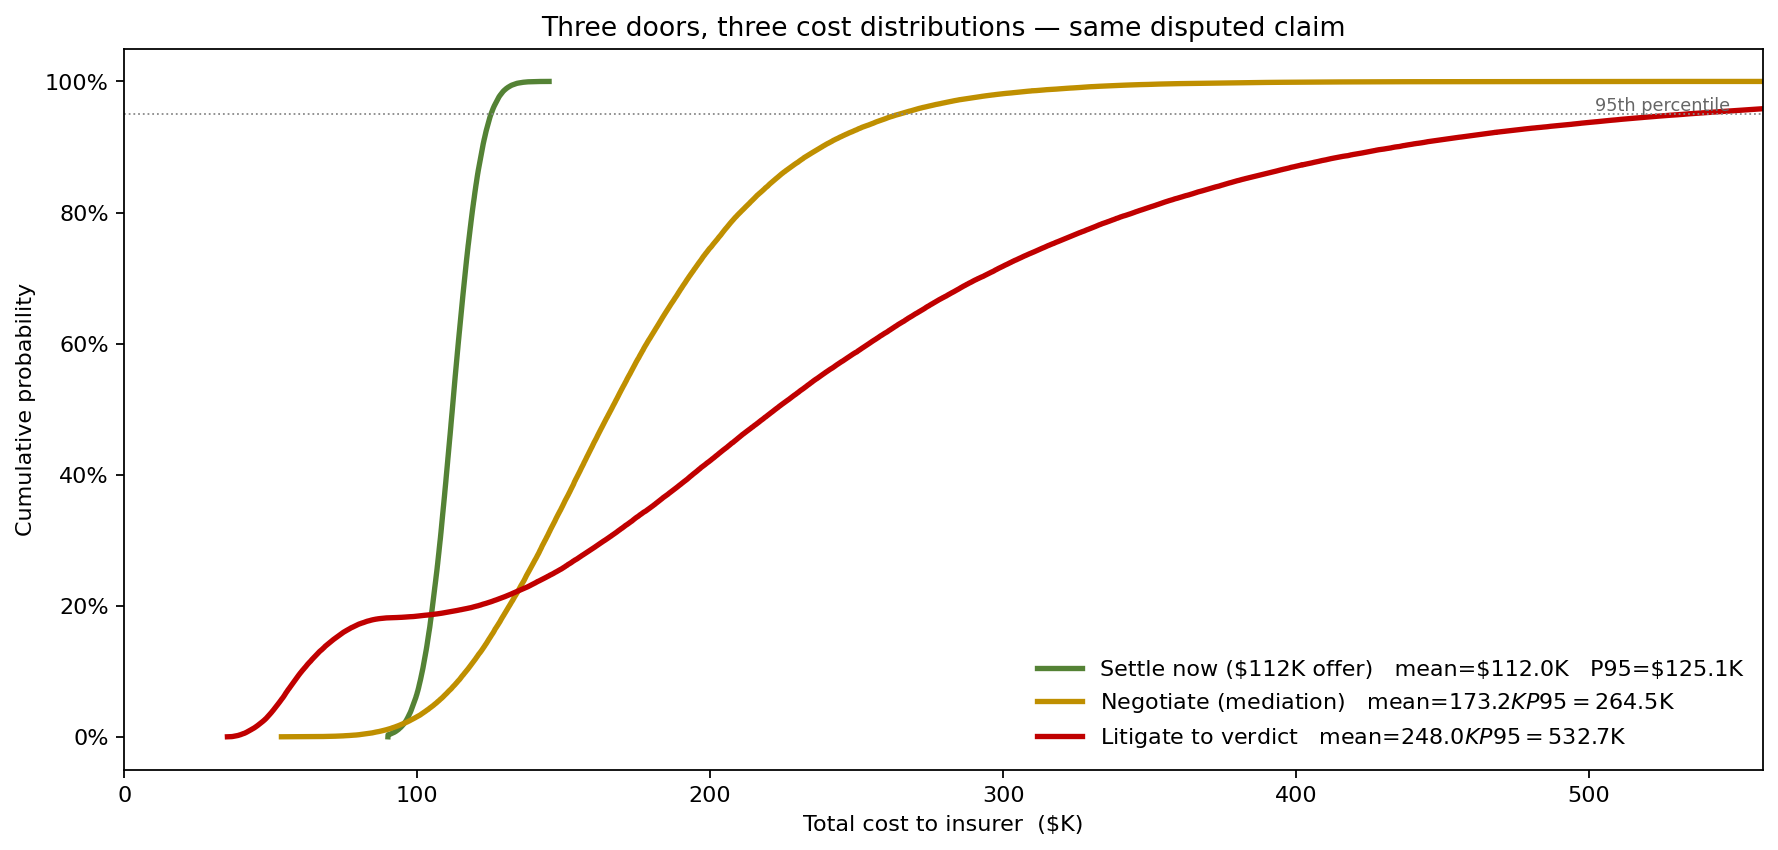
Three actions, three completely different shapes of cost. The rest of this article is how each curve was built and what the adjuster does with them.
Pricing the three doors
For the canonical file above, the model treats each available action as a separate composite distribution:
Settle now. A near-deterministic outcome: the $112K offer plus a few thousand dollars of last-mile bargaining. Total cost clusters tightly around the offer — a mean of $112K and a 95th percentile of just $125K, with no right tail. That absence of a tail is the point of settling.
Negotiate (mediation). Indemnity payout was fit to a LogNormal with median around $155K and a coefficient of variation of roughly 0.30, plus a small Triangular(6, 10, 18) legal/mediation cost in $K. LogNormal is the right family here because liability indemnity values are bounded below by zero, right-skewed, and never normal — fitting them as Normal lets the simulator draw negative payouts, which historically has been the first error in-house adjudication models make.
Litigate to verdict. Indemnity is a mixture: a LogNormal body with ln-mean of $180K and σ = 0.55, plus a 12% probability of a runaway-verdict event drawn from a Pareto tail (shape 2.3, scale $220K). An 18% chance of a defense verdict zeroes the indemnity but keeps the legal spend, modeled as Triangular(35, 55, 90) in $K. The Pareto tail is the same peaks-over-threshold construction extreme-value theory uses for catastrophe loss — using a single LogNormal here would systematically understate the long, fat right side of jury outcomes, which is exactly where the catastrophic adverse verdicts live.
The three-door CDF at the top of this article tells the actual story: negotiation has the lowest expected cost (~$173K) and a 95th percentile of $265K, while litigation's mean is $248K and its 95th percentile reaches $533K — with its tail running well past $800K because the runaway-verdict mixture component dominates. The settle option is dominated in expectation by negotiation, but it is the only door without a fat right tail. The right action is rarely the lowest-mean action.
The tail nobody priced
Treating litigation as a single-distribution outcome is what gets carriers in trouble. The litigate-cost histogram makes the danger explicit:
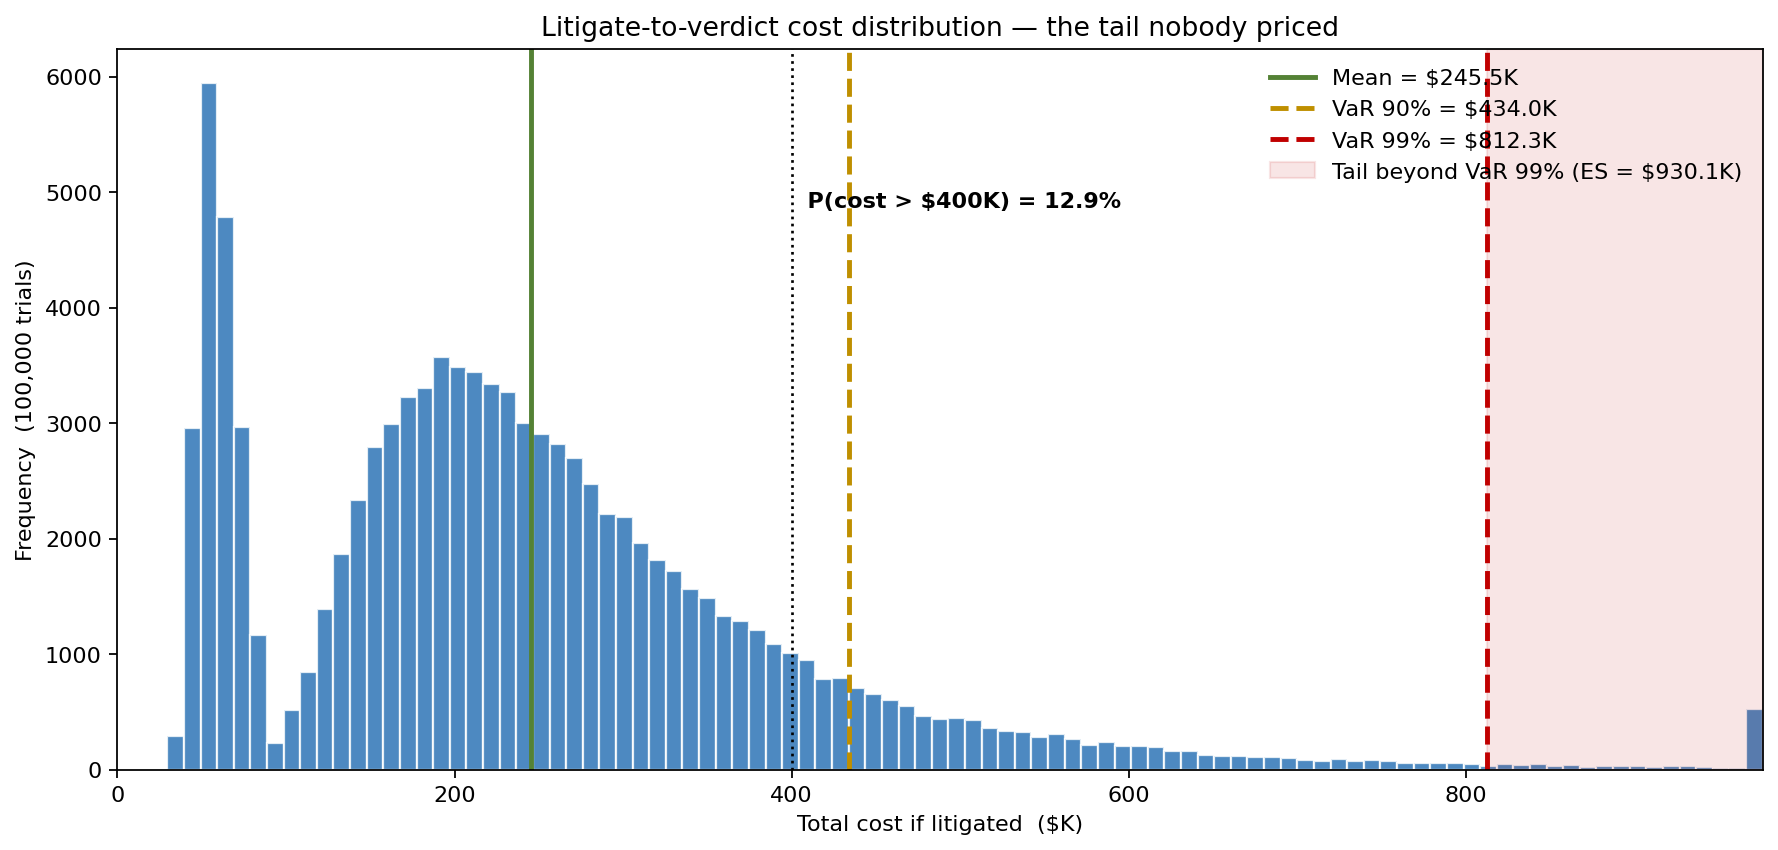
The deterministic spreadsheet that backed the prior adjudication template reported an "expected litigation cost" of $215K — a number that sits comfortably below reserve. The Monte Carlo simulation showed that the 90th percentile is $434K, the 99th percentile is $812K, and the probability of total cost exceeding $400K is roughly 13%. The single-number expected cost did not see the tail at all, and that was the source of the unit's reserve adequacy problem on litigated files.
What actually moves the litigated outcome
Sensitivity ranking on the litigated cost identifies where modelling effort and data investment should go next.
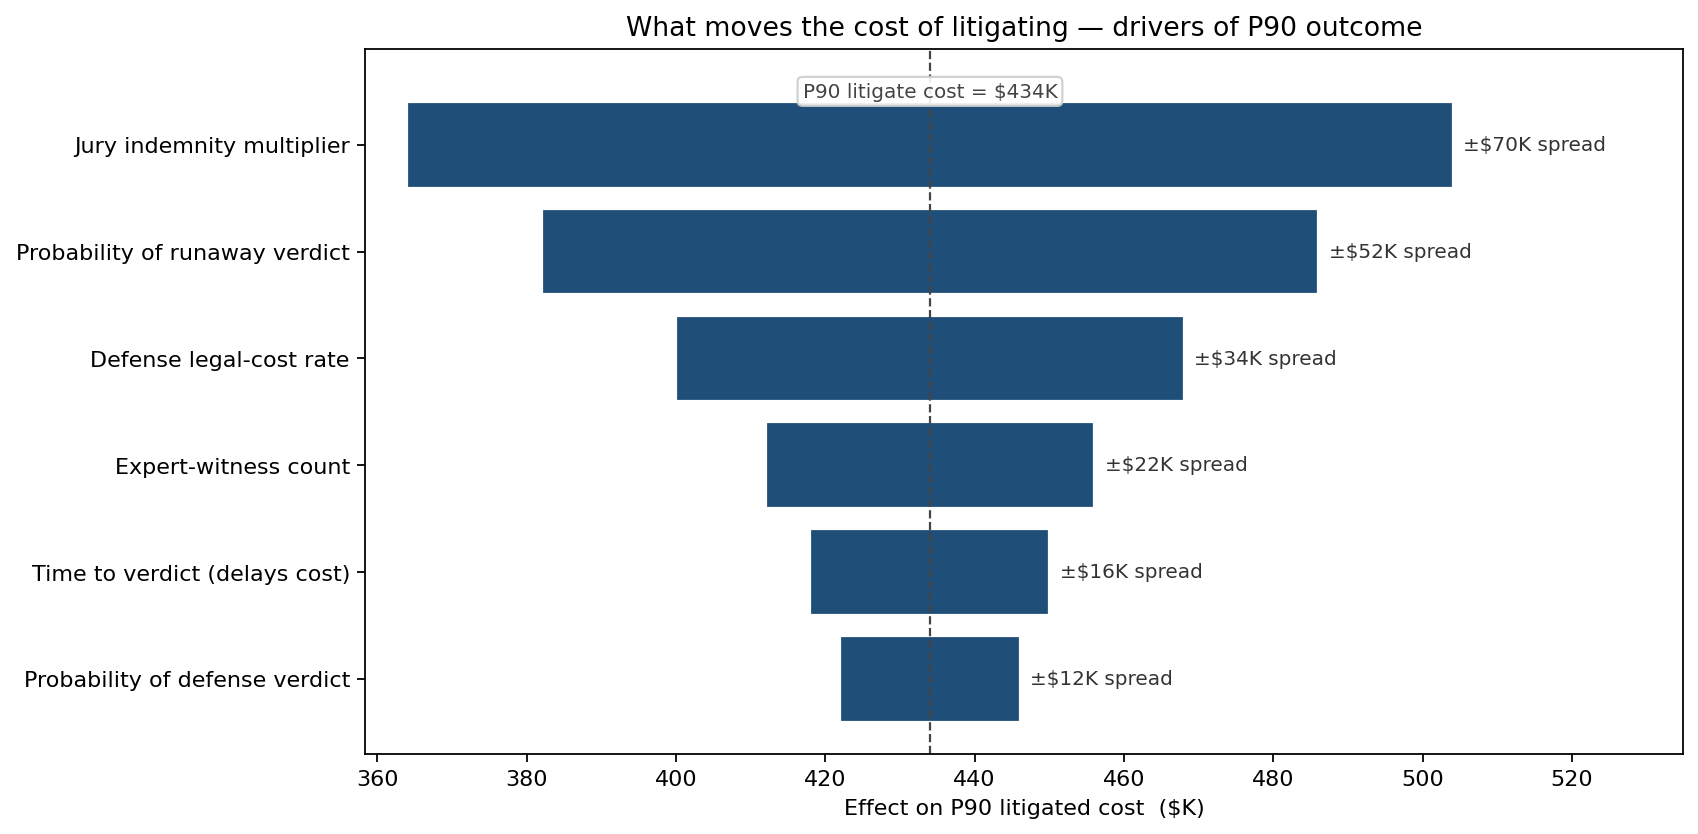
Jury indemnity multiplier and probability of a runaway verdict dominate — together they account for the bulk of P90 spread. That tells the legal-defense team the highest-value data project is jury-research and venue-specific verdict history, not yet another stage in the workflow. Defense-cost rate ranks third, which is mostly a vendor-management variable, not a litigation-strategy variable.
Which files to investigate further
The same engine answers the prior-stage question: which files justify spending more on investigation before settling? That is a value-of-information problem — the expected value of investigation equals the reduction in adjudication cost it produces, minus its own cost. Running it across the unit's intake mix produced a clear Pareto:
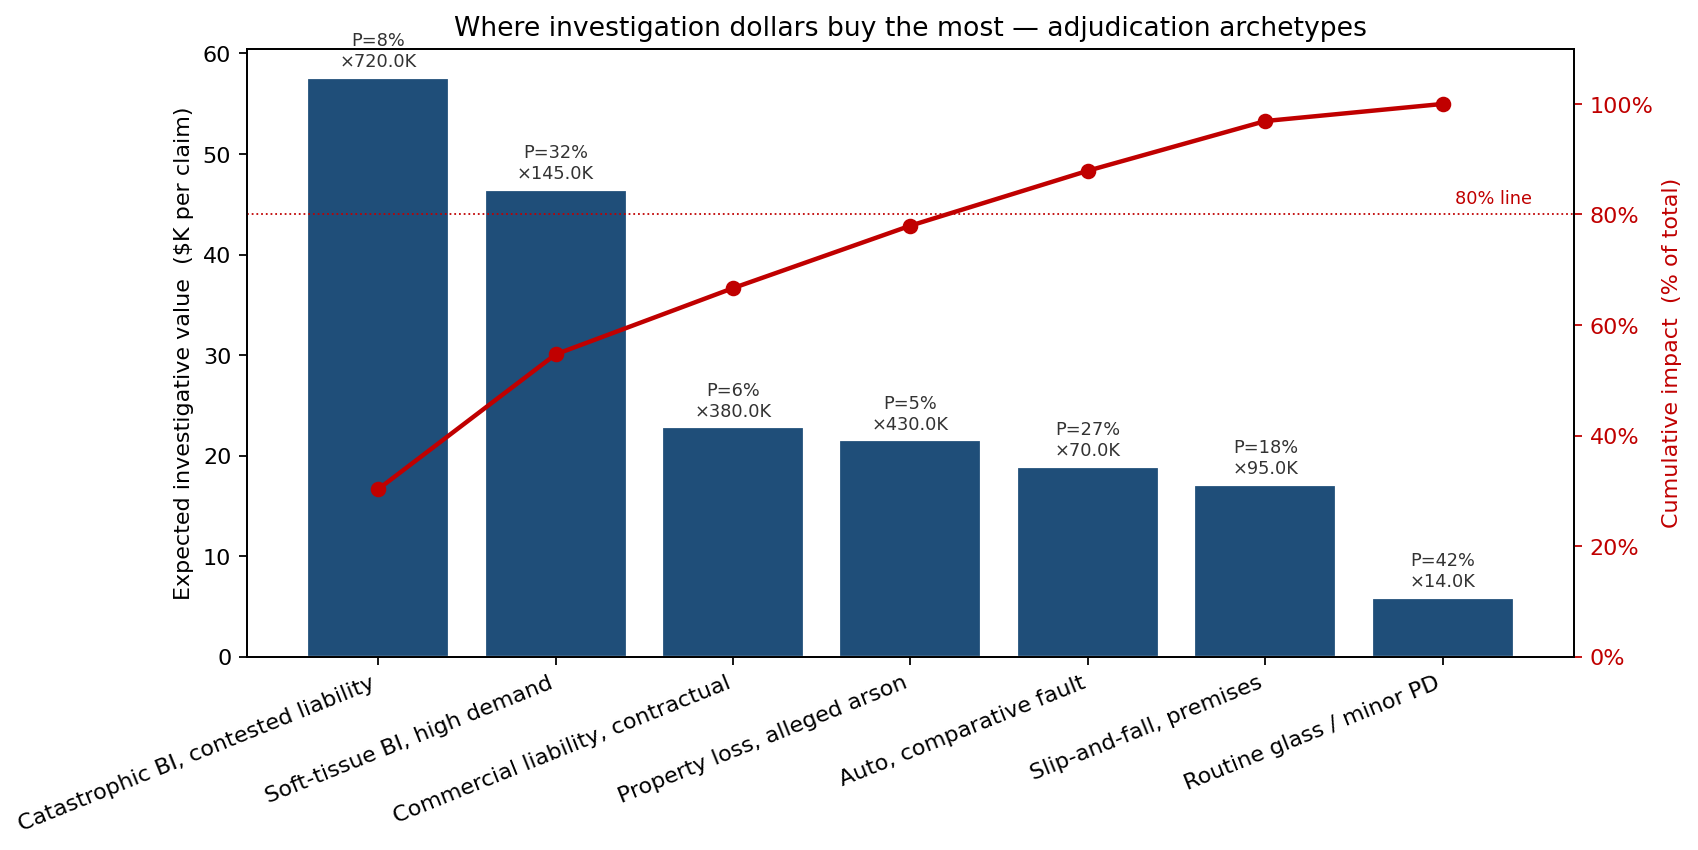
Catastrophic bodily-injury files with contested liability deliver the highest expected investigative value per claim — not because they happen often, but because the cost distribution is so wide that even modest reductions in uncertainty are worth a lot of investigation budget. Routine glass and minor property damage files sit far down the chart: a probabilistic argument for never sending an investigator to them, even though some fraction will turn out to be over-claimed.
What changed in practice
- Tail-reserving discipline. Reserves on litigated files were re-tagged with their P90, not their mean. Aggregate reserve uplift on the litigated book was about 8% — and incurred-but-not-enough surprises on closed files fell sharply.
- Settlement authority bands were rewritten as P50–P90 ranges from each file's simulation rather than fixed dollar caps, giving senior adjusters explicit licence to settle above the mean when the tail justified it.
- Investigative spend was reallocated away from low-severity files and toward the contested-liability and arson archetypes — total investigative budget unchanged, fraud and over-claim recoveries up double-digits.
- The negotiate-vs-litigate decision became defensible. Each file carries a one-page output showing the three cost CDFs and the conditional means; defence counsel and claims committee see the same picture and stop arguing about which point estimate to use.
ModelRisk Functionality Used
- Mixture modelling for the litigation indemnity — a LogNormal body plus a Bernoulli-gated Pareto tail for runaway verdicts, capturing fat-right behaviour the single-distribution approach hides.
- Distribution fitting on closed-file data per venue and injury class, with the fit diagnostics retained on the file as part of the adjudication record.
- Scenario CDFs as the primary visual artefact — every contested file produces the three-door CDF chart automatically and it travels with the claim.
- Sensitivity ranking that prioritised jury-research and venue verdict-history investments over workflow tweaks.
- Value-of-information analysis on investigation spend, producing the archetype Pareto that reshaped the unit's investigative budget.
- Excel-native formulas for the indemnity-plus-legal cost composition, so adjusters work in the spreadsheet they already use instead of being routed through a separate analytics tool.
Adjudication is not a workflow optimisation problem. It is a sequence of decisions made under fat-tailed uncertainty, where the cheapest mean is rarely the safest tail — and Monte Carlo is what turns that distinction from intuition into a number the adjuster, the committee, and the reserve actuary can all read off the same chart.