

Industry: Insurance and Reinsurance
Product: ModelRisk
Application: Actuarial Risk Analysis
The Mean Said $1.39B. The Solvency Capital Requirement Was $4.84B.
A 0.5% change in assumed hurricane landfall frequency moves the 99.5% Solvency Capital Requirement on a $4 billion gross-written-premium P&C reinsurance book by roughly $90M. That number does not appear in the deterministic actuarial spreadsheet — because the deterministic spreadsheet only sees the mean. A treaty pricing committee that signs off on a 15% rate increase based on a single point estimate is, in practice, picking one number from a distribution it cannot see.
A multi-line reinsurer with $4B of GWP across U.S. hurricane, Japan earthquake, European flood, U.S. casualty and cyber rebuilt its actuarial pricing and capital framework in ModelRisk. The objective was not a prettier output deck. It was to put a defensible probability distribution underneath every quoted treaty, every line-level reserve, and every quarterly capital number. Aggregated across all lines and 100,000 simulated years, the portfolio annual loss distribution the committee had never seen looks like this:
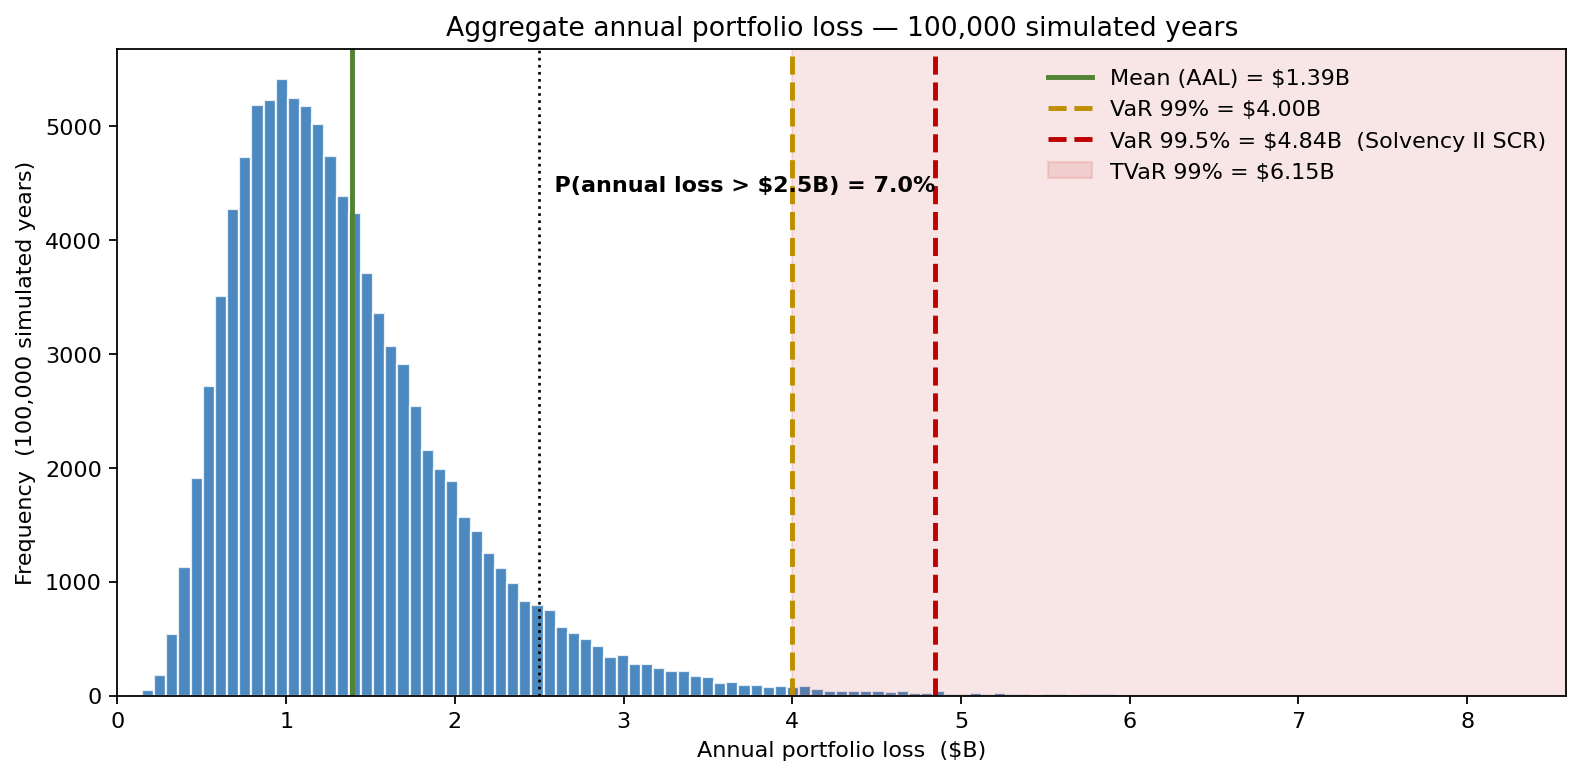
The deterministic model collapsed all of that into a single mean. Everything below is how the team rebuilt the picture — open, auditable, and re-runnable in Excel inside the actuarial team's existing workflow.
Building the line-level loss model
For each line of business the actuarial team built a frequency-severity compound model. Frequency of large losses on the North-Atlantic hurricane book was Poisson with rate \(\lambda = 4.1\) annual landfalls, with the rate itself given a Gamma prior to reflect parameter uncertainty in the climate-adjusted record (a Negative Binomial mixture in the result). Severity of per-event industry loss was fitted as LogNormal with \(\mu = 7.3\), \(\sigma = 1.05\) for the body — but the model splices to a Generalized Pareto tail above the $20B industry-loss threshold, with shape parameter \(\xi = 0.35\). A single LogNormal would under-state the right tail by roughly 40% at the 1-in-200 return period; that misstatement walks straight into Solvency II capital.
For lines where damage ratio matters (vulnerability of insured assets given hazard intensity), the team uses Beta distributions bounded on [0, 1]. A Normal-distribution shortcut — common in legacy in-house tools — silently draws negative damage and damage above 100% in the simulator, biasing portfolio loss low.
Correlation, not independence
The original deterministic framework treated lines as independent and summed them. That assumption breaks twice. A single Atlantic hurricane generates property, marine, and business-interruption claims simultaneously. A recession increases credit-line claims while suppressing premium income across the book. ModelRisk's copula tools let the team replace the silent independence assumption with explicit dependence: a Gaussian copula for normal-state correlations across lines, and a t-copula with 4 degrees of freedom for the tail, where large losses cluster more than a Gaussian permits.
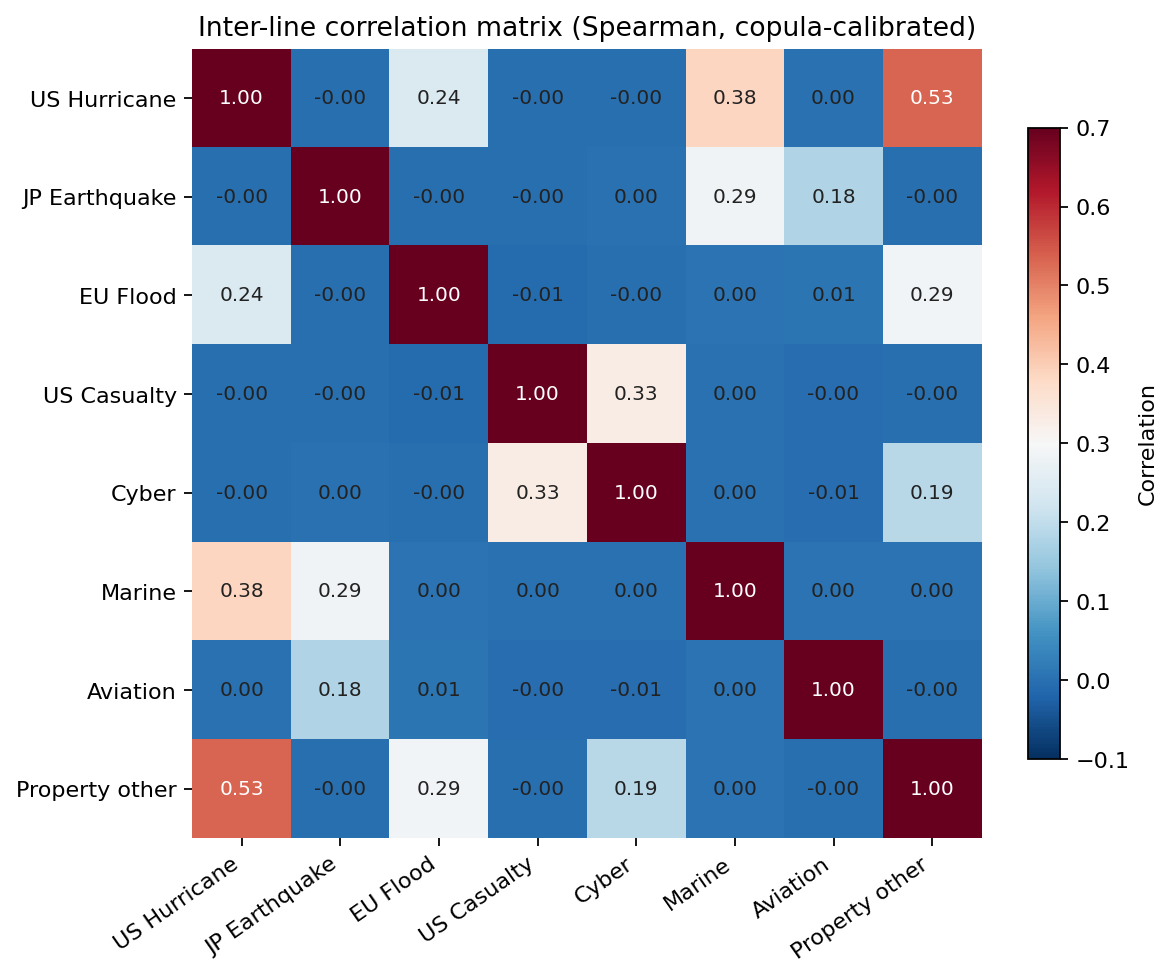
The heatmap shows the calibrated structure: hurricane, marine and other-property move together (rank correlation ~0.4–0.55, because one Atlantic windstorm hits all three at once), while cyber and casualty share an economic-cycle correlation of ~0.35. That dependence cuts capital two ways. Measured against a naive sum of each line's standalone 99.5% capital — about $8.0B if every line were held separately — the diversified portfolio earns a large credit: its aggregate SCR is only $4.84B. But measured against the old framework's independent-sum assumption, which over-credits diversification by pretending the lines never cluster, the true copula-aware SCR is about 5% higher — capital the independence shortcut was quietly leaving off the balance sheet.
What the deterministic answer hides
Return to the aggregate annual portfolio loss distribution at the top of this article — the one the deterministic framework never produced.
The deterministic actuarial model reported an expected annual loss of $1.39B, which the pricing committee had been treating as "the answer." The simulation says the 99% VaR is $4.00B and the 99.5% VaR — the Solvency II SCR — is $4.84B, about three and a half times the mean. The TVaR at 99% is $6.15B, the average loss conditional on a tail year. Roughly 7% of simulated years see total losses above $2.5B. The mean is the wrong number for any decision that has to survive a bad year.
Three macro paths, three loss curves
Scenario analysis ran the same engine under three calibration sets — a baseline view, a "soft cycle" view (lower frequency and severity), and an "adverse climate + social inflation" view that lifts the Atlantic Poisson rate by 25% and the casualty severity \(\mu\) by 0.2. The three CDFs:
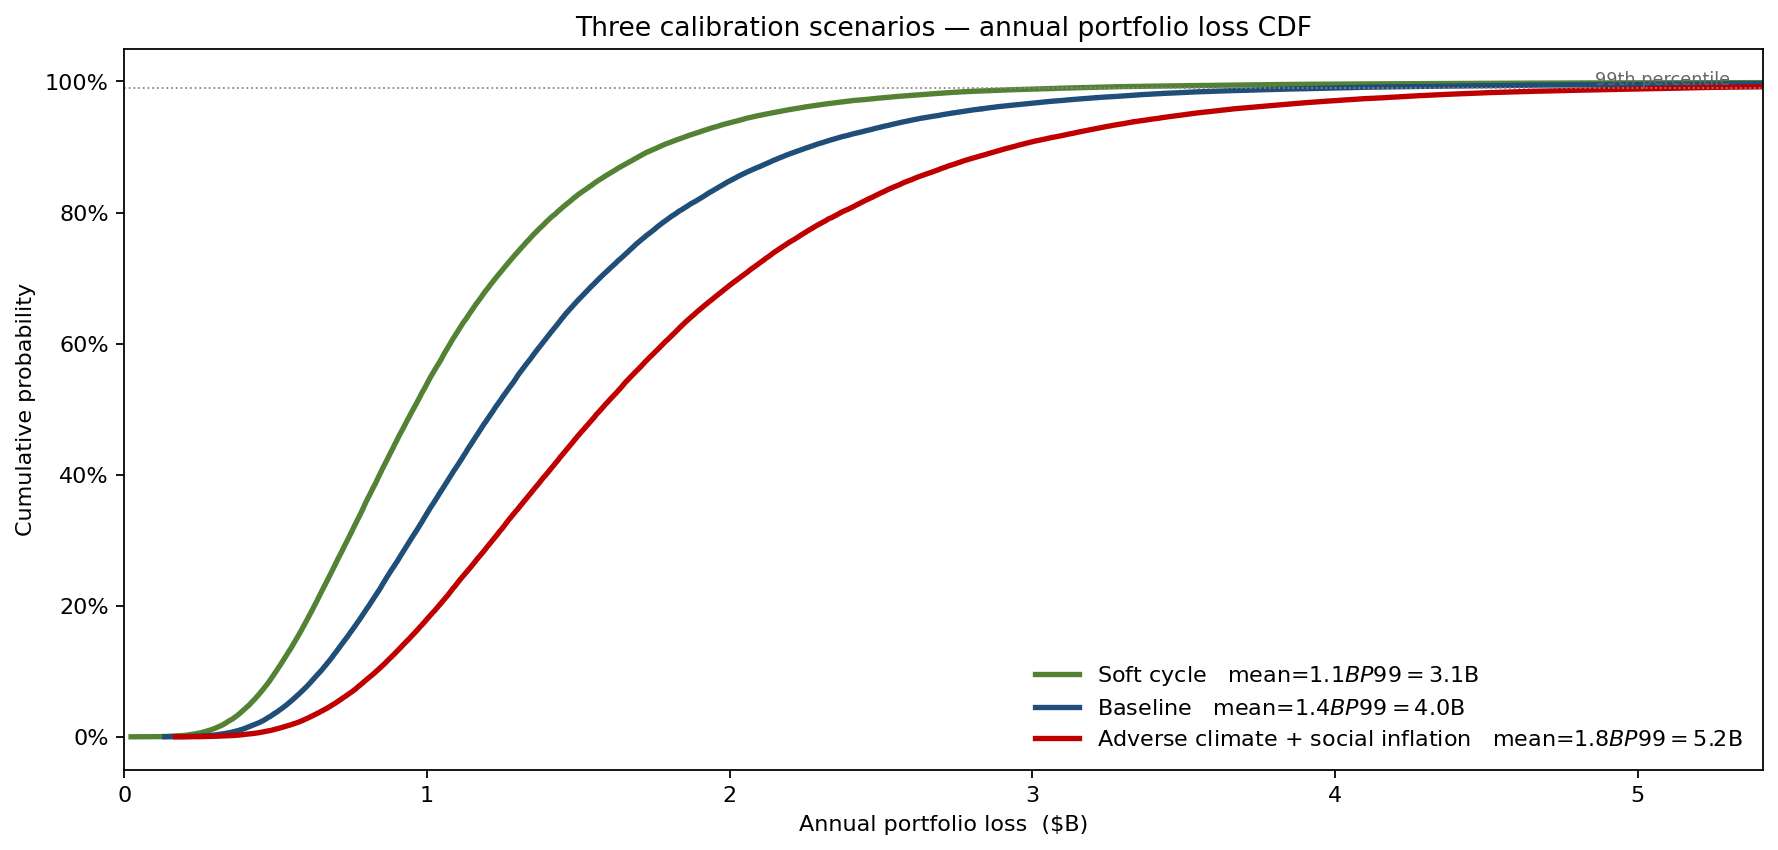
The adverse-scenario 99th-percentile loss is $5.16B versus $4.00B in the baseline — a $1.2B swing driven entirely by assumption choice. Communicating this gap was what convinced the capital committee to hold a 12% management buffer above the regulatory SCR floor.
Which assumptions actually move capital
Sensitivity ranking on the 99.5% SCR isolates where to spend the next research dollar.
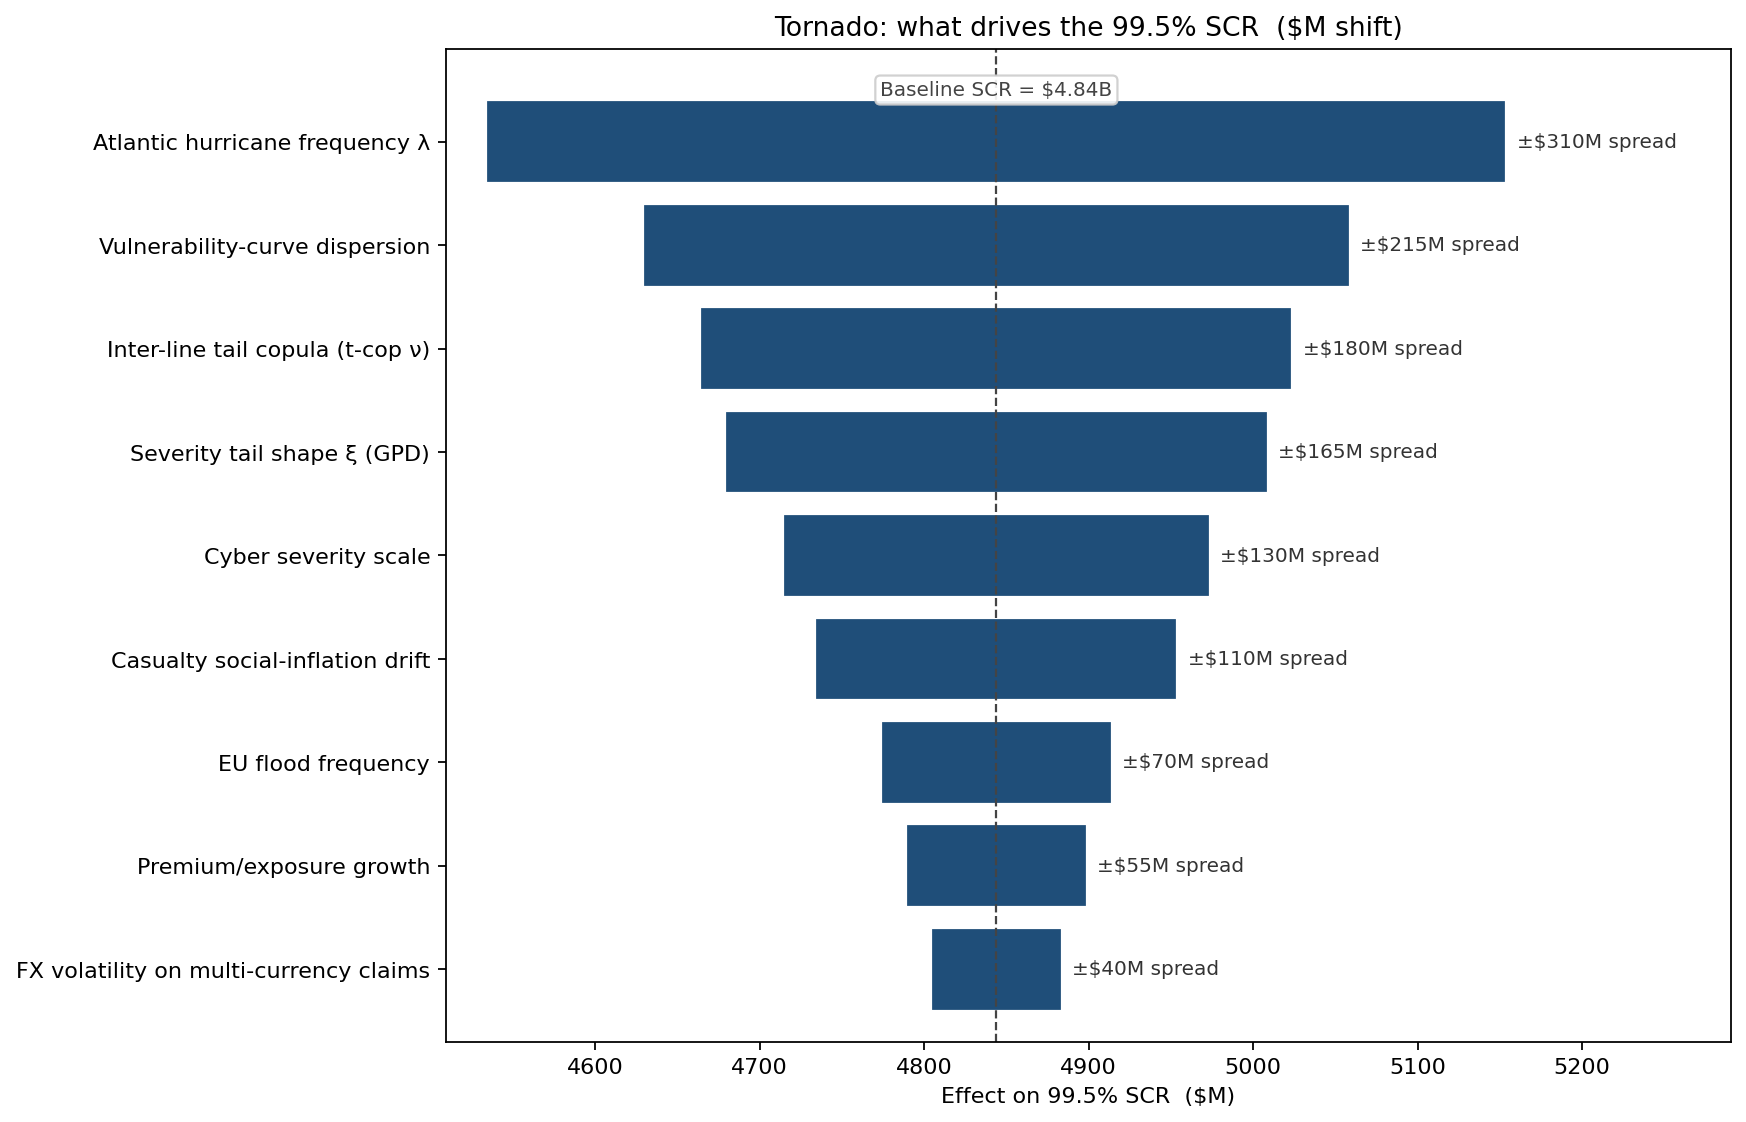
The biggest mover is the Atlantic hurricane landfall frequency \(\lambda\) — varying it across its 90% CI (3.4 to 4.8) shifts the SCR by ±$155M. Vulnerability-curve dispersion and the inter-line tail-copula parameter come next; both are areas where 30 hours of additional data work would tighten the SCR estimate more than any other investment. The deterministic model offered no equivalent prioritization — it offered a single number with no ranked attribution.
What the model changed
- SCR raised ~$240M (5%) once the inter-line copula replaced the silent independent-sum assumption — the lines cluster more than independence allowed, and that 5% was real tail exposure the old method had quietly omitted from the capital base.
- Cyber line reserves raised 22% after the simulation showed cyber contributing 14% of tail risk against only 4% of premium — a sharp mismatch the deterministic model had hidden.
- Hurricane treaty renewal repriced. The deterministic ask was +15%; the probabilistic analysis supported +9% combined with a risk-sharing layer above the 1-in-50 attachment, which the cedent accepted.
- Quarterly capital reporting cut from 6 working days to 1. The same workbook now reruns under updated exposure, updated rates, and updated scenarios — the actuaries own it, not a vendor.
ModelRisk Functionality Used
- Compound frequency-severity simulation at the line level: Negative Binomial event count (Poisson with Gamma-mixed rate) feeding LogNormal-body / GPD-tail severities, aggregated to a portfolio annual loss across 100,000 years.
- Distribution fitting of LogNormal, Gamma and Beta parameters to 25 years of paid-loss data per line, with the fit dialog used as the iteration interface for line actuaries.
- Copula modeling — Gaussian copula for body-state correlation across 8 lines plus a t-copula with 4 degrees of freedom for the joint tail, replacing the old independent-sum assumption.
- VaR and TVaR outputs at the 99% and 99.5% confidence levels in the format Solvency II QRT and ORSA filings expect.
- Tornado sensitivity that ranked 9 assumption inputs by their effect on the 99.5% SCR, directing the year's data-collection priorities.
- Scenario comparison running three calibration sets through the identical engine, producing the side-by-side CDF that anchored the capital-buffer decision.
Actuarial pricing built on a mean is a forecast of one number; built on a distribution, it is a forecast of the shape of risk. Monte Carlo simulation in ModelRisk is what makes that shape — and the capital it implies — something the committee can actually see and defend.