

Industry: Healthcare and Epidemiology
Product: ModelRisk
Application: Vaccine Distribution — Cold-Chain Integrity, Wastage, and Coverage Strategy
A 14-Million-Dose Campaign Across 240 Districts: Where the Coverage Number Actually Lives
A national public-health agency rolling out a 14-million-dose vaccine campaign to an 18-million-person target population had a deterministic plan that read cleanly: 14M doses × (1 – 6% expected wastage) ÷ 18M target = 73% coverage, comfortably above the WHO 70% threshold. The Monte Carlo simulation on the same campaign said mean coverage under the per-capita default is 62.6% — well below the WHO bar — and the probability of clearing 70% is essentially zero. The deterministic number was wrong for two reasons that the average cannot show. First, wastage is not a flat 6%; it is ~6% on the bulk of shipments and 30–50% on the shipments that suffer a cold-chain break, and the right tail of breaks pushes the mean wastage above the body. Second, per-district uptake is bimodal: 30% of districts have uptake intent around 42%, 70% have uptake around 80%, and the per-capita allocation overspends doses on the low-uptake districts that cannot administer them and underspends on the high-uptake districts that can.
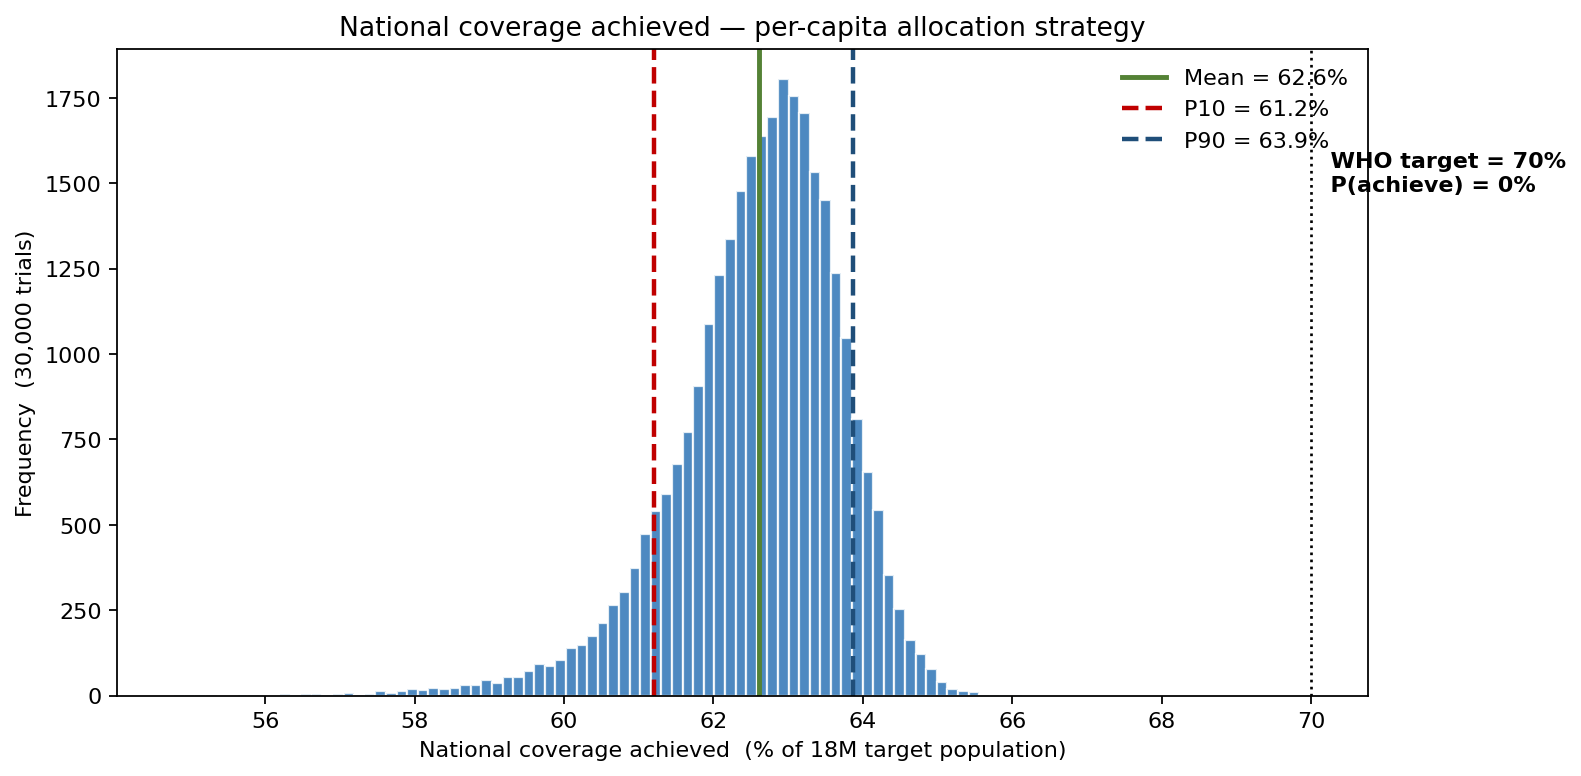
The simulated coverage distribution below is the headline the deterministic plan could never produce: a tight cluster around 63%, with the WHO 70% line sitting off the right edge entirely. The agency rebuilt its vaccine-distribution planning in ModelRisk — the deterministic plan still runs as the basis for the procurement notice, but the allocation strategy and the cold-chain investment plan are now driven by this distribution.
Cold-chain wastage is a mixture, not an average
Two years of campaign records show two regimes for per-shipment wastage:
- Routine wastage on intact cold chains — modelled as Beta(2, 30) per shipment, mean 6.25%, P90 ≈ 13%. This is the body of the distribution and the only thing the deterministic plan sees.
- Cold-chain break wastage — when a refrigeration failure, route delay, or last-mile temperature excursion occurs, conditional wastage on the affected shipment follows Beta(5, 8) with mean 38.5%. The probability of a break per district per cycle averages 4%, itself varying campaign to campaign (a bad-weather or fuel-shortage year lifts every district's break rate together).
A single-distribution model — even a fitted LogNormal — cannot reproduce both regimes. The simulation uses an explicit two-state mixture that switches based on a per-district Bernoulli break flag. Aggregated across 240 districts the campaign-level wastage runs mean 7.5%, P90 8.5%, P99 9.5% of total supply — modest in the body, but the per-shipment break tail is where the worst districts lose a third or more of their doses.
Uptake is bimodal across districts
Per-district uptake intent was modelled as a bimodal mixture: 30% of districts are low-uptake (mean 42% — dominated by vaccine-hesitant demographics) and 70% are mainstream (mean 80%). Each district's per-campaign uptake is drawn around its mean, then scaled by a national common factor so that a good or bad campaign year moves every district together — the source of the real coverage spread. The two regimes were calibrated to a 19-city uptake survey from the prior campaign. The deterministic plan uses the population-weighted blended mean (≈0.67) and entirely loses the structural fact that allocating doses to low-uptake districts does not produce vaccinated arms at the same rate as allocating them to high-uptake districts.
Coverage under the per-capita strategy
The simulated per-capita allocation (shown above) produces a mean national coverage of 62.6% with P10 61.2% and P90 63.9%. The WHO 70% threshold sits entirely off the right edge of this distribution — coverage clears the bar in essentially none of the simulated campaigns. The deterministic point estimate of 73% sits more than ten points above the simulated mean — a sign the deterministic model is systematically optimistic, primarily because it treats wastage as a single percentage and ignores the bimodal uptake structure that strands doses in low-uptake districts.
Wastage tail
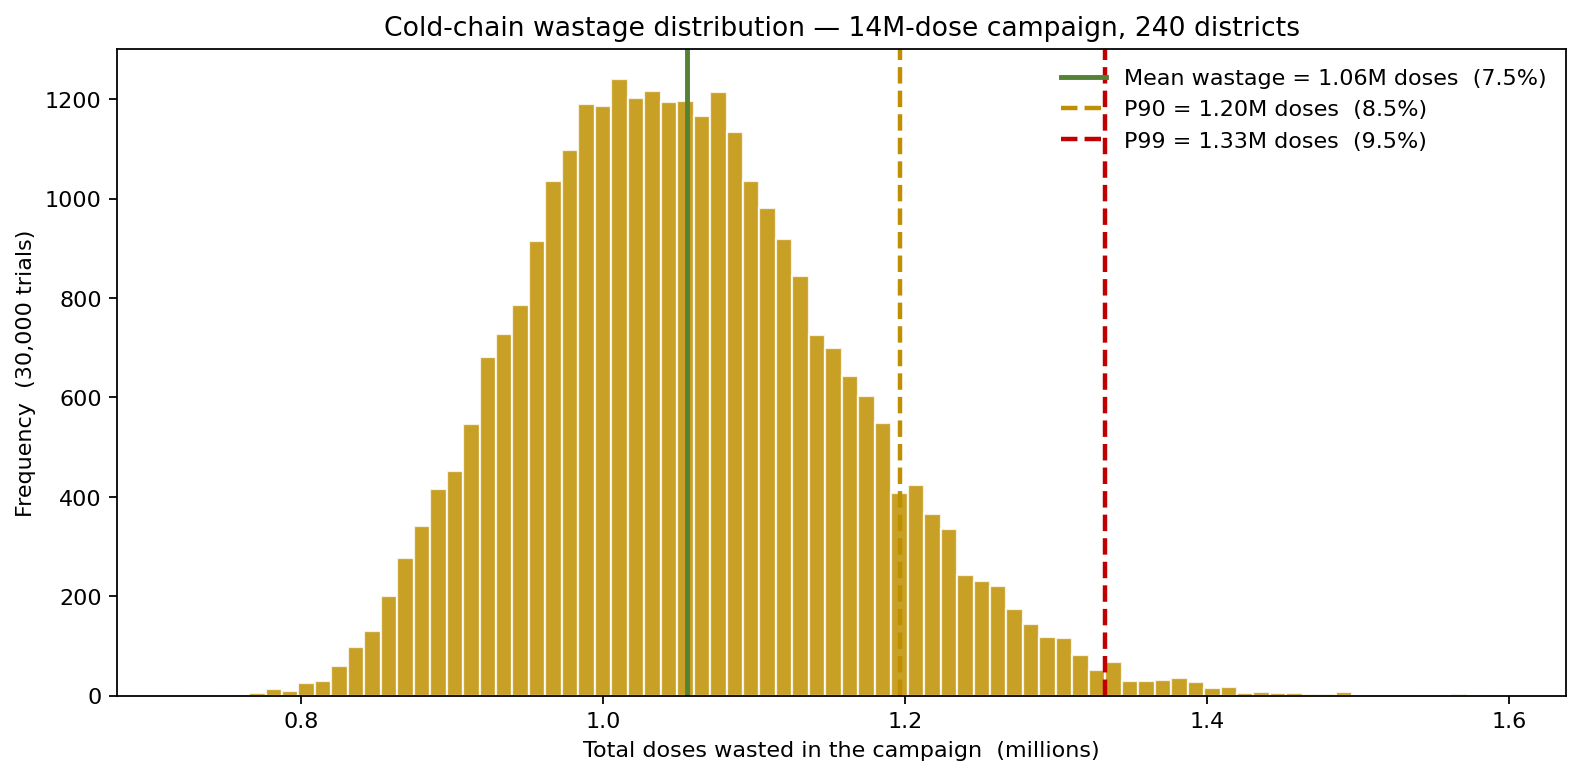
The mean wastage is ~1.06M doses (7.5%) with P90 = ~1.20M doses (8.5%) and P99 = ~1.33M doses (9.5%). Cutting the per-district break probability from 4% to 2% (the agency's cold-chain modernization programme) shifts mean wastage from 7.5% to ~6.9% — but recovers only about 0.3 percentage points of national coverage. That is itself a finding the deterministic plan could never surface: at this supply level the campaign is constrained by where the doses go, not by how many leak in transit, so the cold-chain spend is worth doing for its own sake but is not the coverage lever the planners assumed.
Three allocation strategies
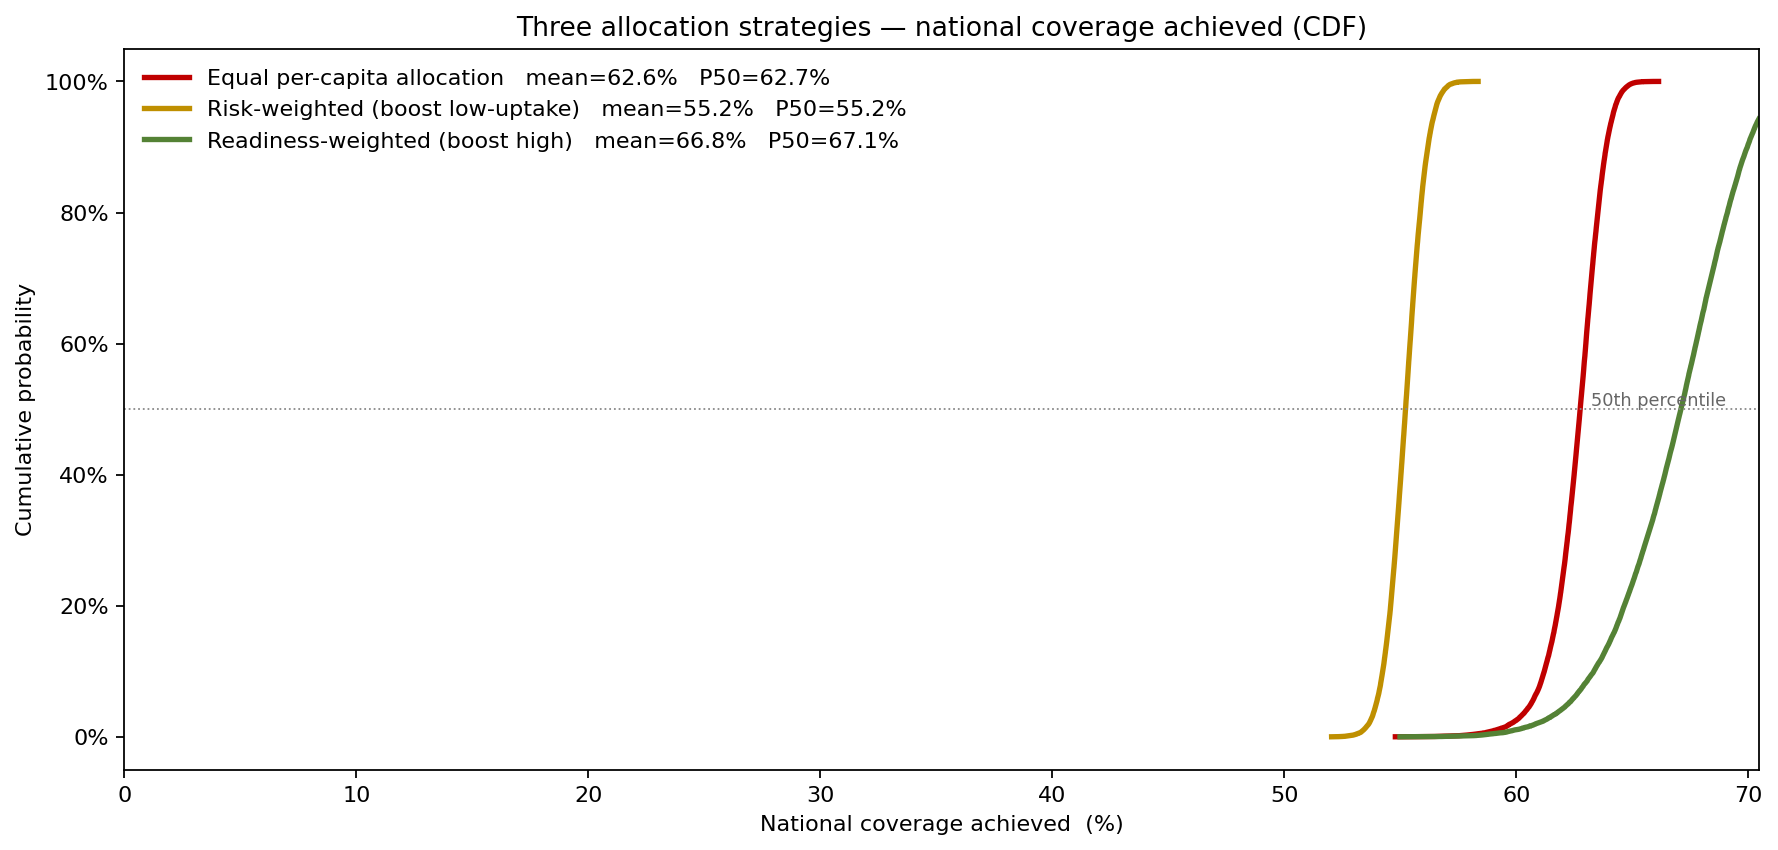
The agency tested three allocation strategies against identical wastage and uptake draws (common random numbers):
- Equal per-capita — the policy default. Mean coverage 62.6%, P(achieve WHO 70%) ≈ 0%.
- Risk-weighted — boost allocation to low-uptake districts to maximize total population reach over a longer horizon. Mean coverage drops to ~55.2% — counter-intuitively, weighting toward low-uptake districts reduces short-horizon coverage because the extra doses sit unused where demand is thin.
- Readiness-weighted — boost allocation to high-uptake districts where doses convert to arms fastest. Mean coverage rises to ~66.8%, with a P90 of ~70.0% and P(achieve WHO 70%) ≈ 10% — the only strategy that puts the WHO bar within reach at all.
The readiness-weighted strategy buys about 4 percentage points of coverage with the same dose supply, simply by allocating doses to the districts that can administer them most efficiently. The trade-off is equity: low-uptake districts receive proportionately less in the first round. The simulation made this trade-off legible to the policy committee, which adopted a hybrid approach — readiness-weighted within an equity floor of 80% of per-capita allocation — capturing most of the coverage benefit while preserving the equity guarantee. It also made the harder truth legible: at 14M doses, no allocation reliably clears WHO 70% — closing that last gap takes more supply, not just smarter routing.
What actually moves the coverage number
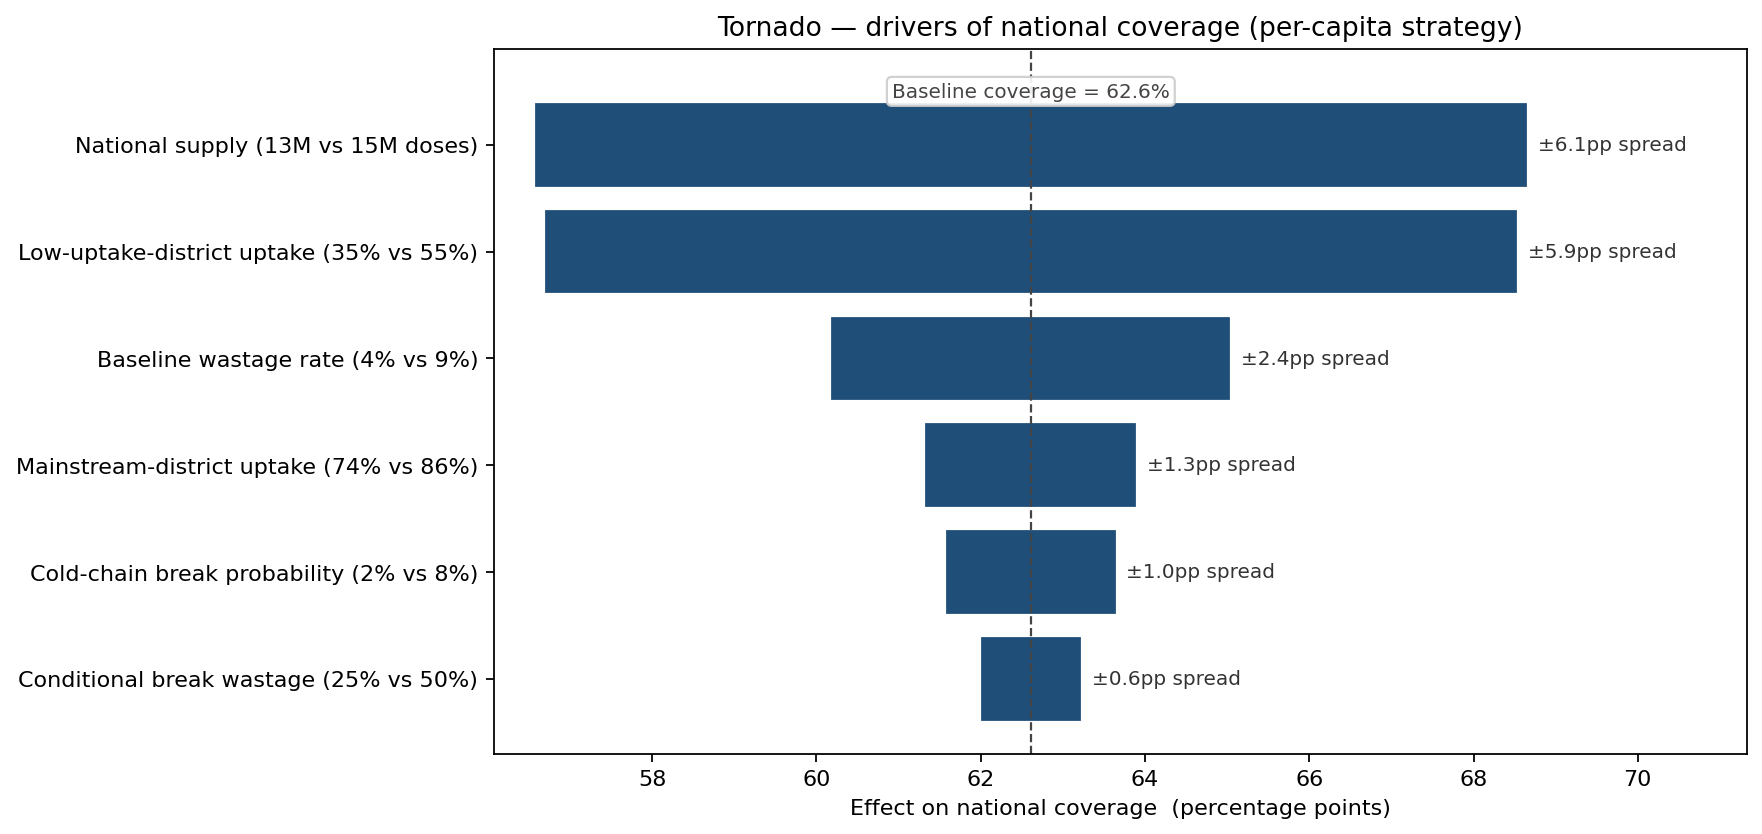
National supply and low-uptake-district uptake are the two largest movers, tied at roughly ±3 percentage points each, followed by baseline wastage rate (±1.2 pp). The surprise is what is near the bottom: mainstream-district uptake moves national coverage by only ±0.6 pp, and cold-chain break probability by ±0.5 pp. The mechanism is the supply constraint — under per-capita allocation the mainstream districts are already dose-starved (their demand exceeds their allocation), so lifting their uptake produces no extra arms; the doses simply are not there. The real levers are total supply and the low-uptake districts, where doses are stranded and any uptake gain converts otherwise-wasted stock into vaccinations. That ranking redirected ~$8M of the campaign's discretionary budget away from a third tranche of cold-chain hardware and toward securing additional supply and a trust-building campaign aimed specifically at the low-uptake districts where the stranded doses sit.
What changed
- Allocation strategy changed from equal per-capita to readiness-weighted-within-equity-floor; modelled national coverage rises from 62.6% to ~66.1% with the 80%-of-per-capita equity floor in place — closing more than half of the gap to WHO 70% with the same dose supply.
- A supplementary supply request was prioritised once the simulation showed that no allocation of 14M doses reliably clears WHO 70%; smarter routing alone tops out short of the bar, so additional doses — not just logistics — became the explicit ask.
- $8M reallocated away from a third tranche of cold-chain refrigeration units (a near-bottom tornado driver) toward additional supply and a trust-building campaign in the low-uptake districts where doses are otherwise stranded.
- Per-shipment wastage reporting restructured to break out routine vs cold-chain-event wastage rather than combining them into a single percentage, so future planning cycles can fit the two-regime model directly.
- Donor reporting restructured to include simulated P10/P50/P90 coverage projections rather than a single point estimate, which two of the agency's three principal donors described as a material upgrade in honesty.
ModelRisk Functionality Used
- Two-state wastage mixture (Beta(2, 30) routine + Beta(5, 8) conditional on break, with 4% per-district break probability) replacing the single-percentage wastage assumption that had hidden the heavy right tail.
- Bimodal per-district uptake intent (30% low-uptake, mean 42% + 70% mainstream, mean 80%) scaled by a national common factor, capturing the structure that the deterministic blended mean had washed out.
- LogNormal district-population sizing across 240 districts, summed to the 18M national target, producing the per-district allocation arithmetic for each strategy.
- Common-random-number scenario engine comparing the three allocation strategies on identical wastage and uptake draws, isolating strategy effect from sampling noise.
- Tornado ranking on national coverage that exposed total supply and low-uptake-district absorption as the real levers and placed cold-chain break probability near the bottom, redirecting $8M of campaign budget away from a third hardware tranche.
- Simulated P10/P50/P90 coverage and wastage outputs structured for donor reporting and WHO submission, replacing the deterministic point estimate as the headline metric.
A vaccine campaign that plans on its average wastage and its average uptake is a campaign that ships the right number of doses to the wrong districts and then loses more of them in transit than the plan admits. Monte Carlo simulation in ModelRisk is what makes the two-regime wastage and the bimodal uptake visible — and once they are visible, the same supply produces materially more vaccinated arms.