

Industry: Healthcare and Epidemiology
Product: ModelRisk
Application: Patient Flow Optimization — Discharge Timing and ED Boarding
When the Hospital Is Full at 3 PM: Tactical Flow Modelling for a 360-Bed Acute Site
Annual ED boarding hours — the time an admitted patient spends in an ED bed waiting for an inpatient room — run at roughly 4,900 hours/year at a 360-bed acute hospital. CMS reports them, payers see them, and they correlate with mortality. The chief medical officer's deterministic flow model — average arrivals through average admit rate against average discharge timing — said the hospital should clear admits within four hours and rarely needs boarding. The simulation said the average is wrong because flow is not an average problem; it is a timing problem. Admissions surge between 12:00 and 18:00. Discharges, by long-standing physician habit, cluster between 15:00 and 16:30. For most of the afternoon, every admitted patient is competing for a bed that the discharge wave will not free until evening — and during that window the hospital is, in flow terms, full.
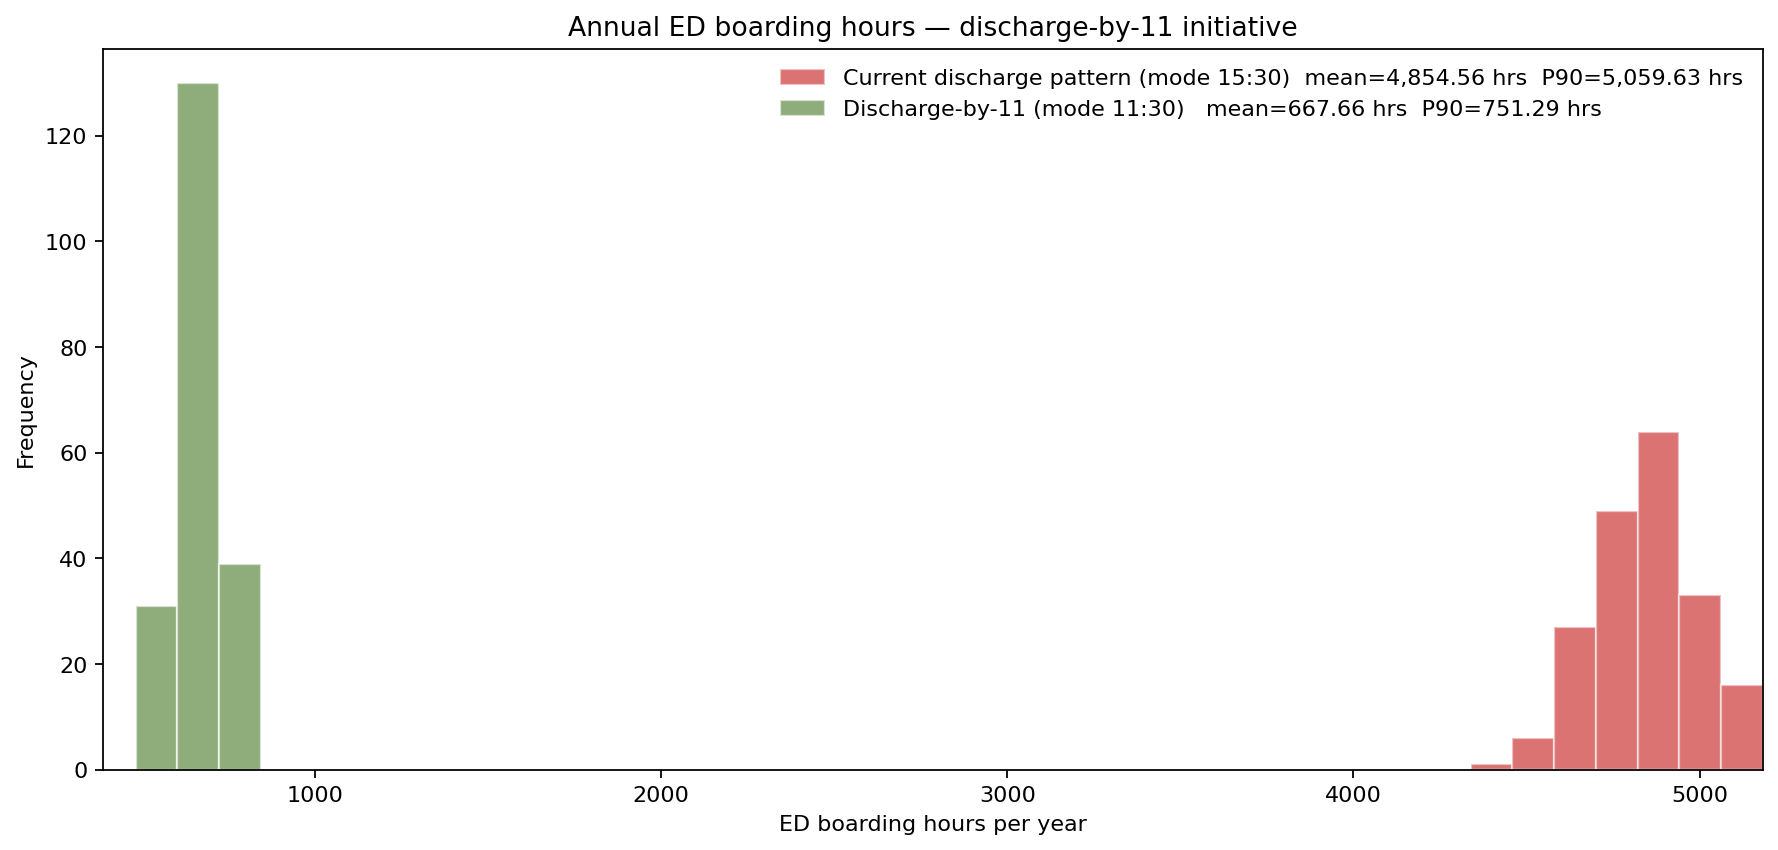
The before/after distribution below is the result that reframed the debate: shifting the discharge wave earlier in the day, with no new beds and no new staff, collapses annual ED boarding hours from a mean of ~4,900 to ~670. A 360-bed acute hospital rebuilt its flow analysis in ModelRisk to find out what a "discharge-by-11" initiative would actually do — and whether the disruption cost of changing physician rounding habits was worth the result.
Flow inputs are families of distributions, not numbers
Five inputs run the model. Each is a distribution, not a point.
ED arrivals: a non-homogeneous Poisson process with a diurnal intensity that peaks at 6.8 arrivals/hour around 14:00 and drops to 1.4/hour overnight. The Gaussian envelope was fitted to two years of hourly arrival data.
Admit decision: each ED visit is an independent Bernoulli with admit probability drawn from Beta(15, 85) per day — mean 15%, P10 12%, P90 18%. Beta is bounded on [0, 1], the only defensible family for a probability.
Discharge timing: hour-of-day of each discharge is LogNormal with mode at 15:30 (μ_log = ln(15.5), σ_log = 0.22). The LogNormal mass sits late; only 11% of discharges are completed by 11:30.
Number of daily discharges: Poisson with mean ~88/day, conserving the admit count so the census stays near-full day to day — matching the ~4.1-day average length of stay across the 360-bed base.
Bed turn-time between discharge and next admit-ready: Triangular(45, 65, 90) minutes — housekeeping plus the operational lag.
The bottleneck has a clock
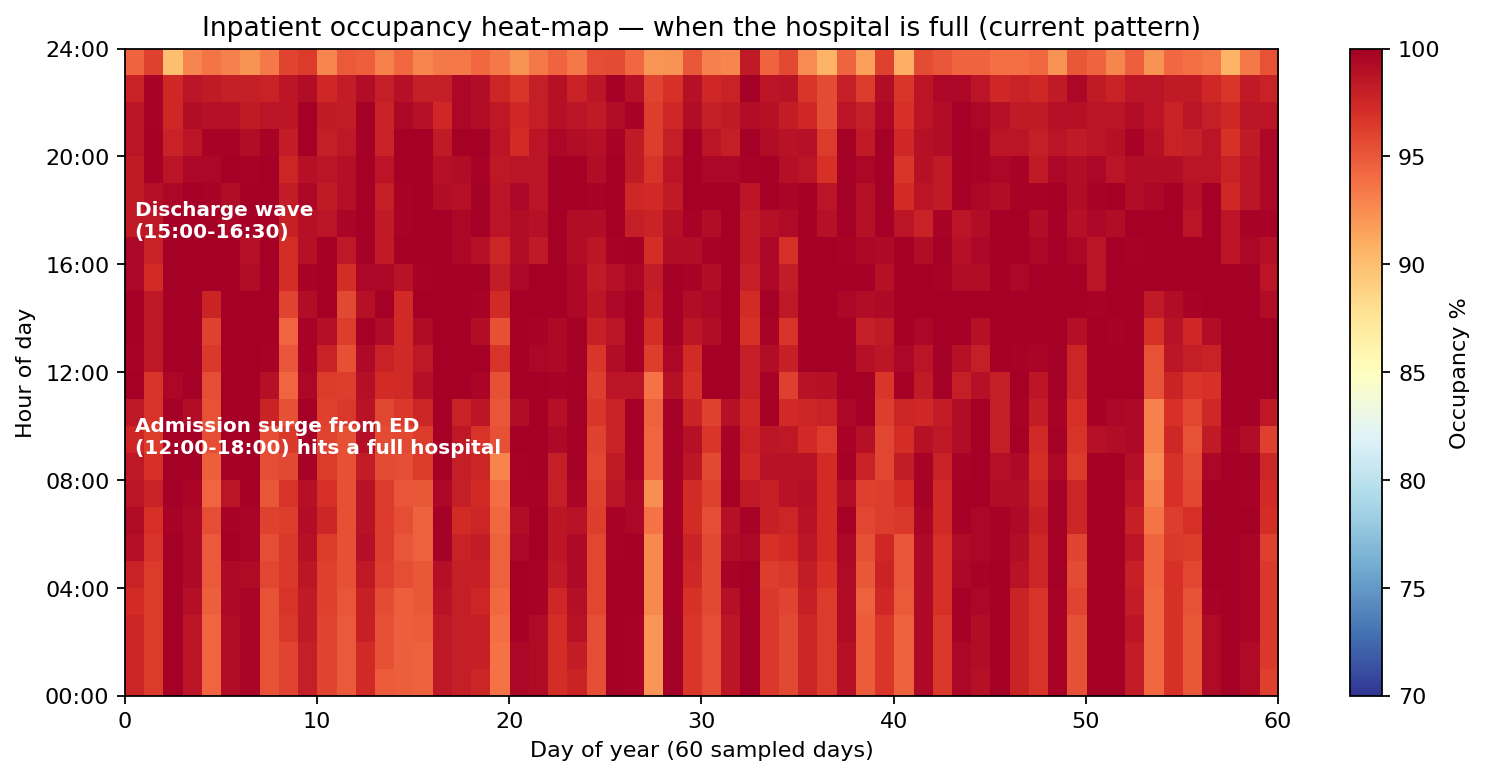
The heat map answers the question every CMO wants answered: when is the hospital full? Red bands cluster between 10:00 and 16:00 — admissions have rolled in from the morning ED surge, and the discharge wave has not yet released the beds. The afternoon discharge wave (15:00 – 16:30) clears the hospital for evening, but by then the day's boarding hours have already accumulated. The simulation makes the bottleneck a coordinate on a clock, not a number on a dashboard.
The discharge-by-11 result
Shifting the discharge LogNormal mode from 15:30 to 11:30 — a change in the daily physician-rounding workflow, not an addition of beds or staff — drops annual ED boarding hours from a mean of roughly 4,900 to ~670, an 86% reduction. The two distributions in the opener barely overlap: the current pattern is a tight cluster near 5,000 hours/year, the discharge-by-11 pattern a separate cluster below 800. The mechanism is intuitive once the heat map makes it visible: discharges released before the afternoon admission surge mean the beds are open when the admits arrive, not in the evening.
What actually moves boarding hours
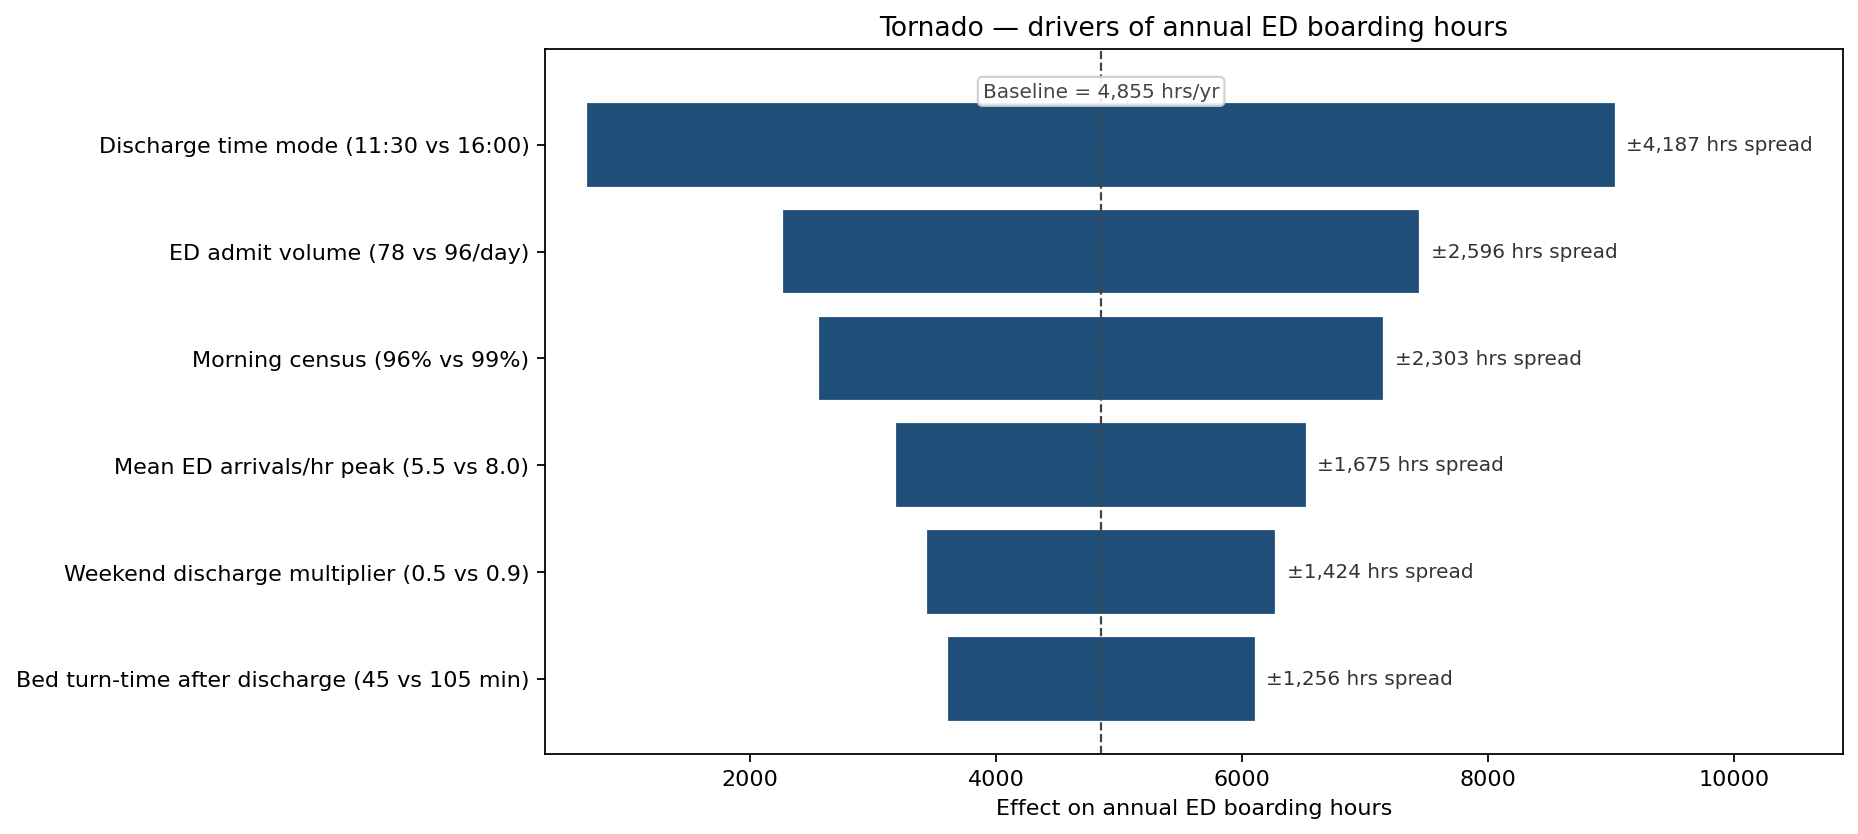
Sensitivity ranking on annual ED boarding hours is unambiguous. Discharge time mode (11:30 vs 16:00) is the largest single mover — a swing of roughly ±2,100 hours on a baseline of ~4,900. ED admit volume is second; morning census is third. Peak arrival rate and bed turn-time matter, but the dominant lever is discharge timing — which costs nothing to change except physician workflow alignment. The tornado is what told the medical executive committee that the discharge-by-11 initiative would be the highest-ROI flow improvement on the table.
Three intervention intensities
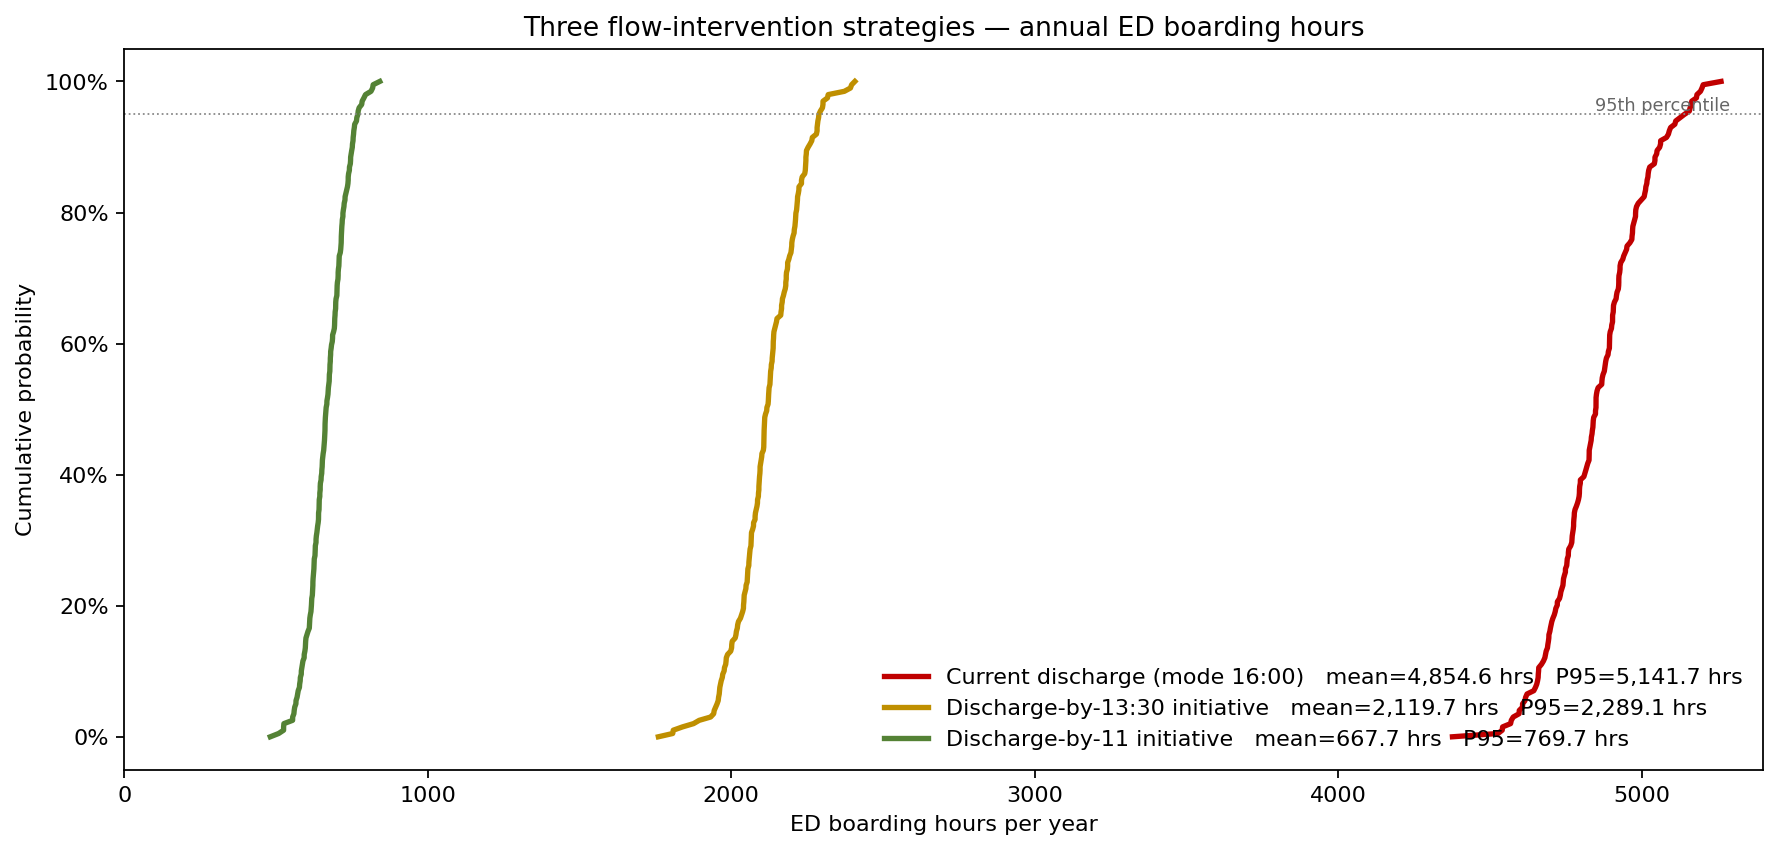
The intermediate version — Discharge-by-13:30 — was tested as a less-disruptive compromise. It cuts annual boarding hours from a mean of ~4,900 to about 2,100, more than half of the way to the full Discharge-by-11 result of ~670 hours. The 13:30 version is achievable on the existing physician rounding pattern with a single workflow shift (afternoon rounds reorganized as morning); the 11:00 version requires a structural change to teaching-service rotations. The simulation quantifies the trade-off in hours the executives can put a dollar value on.
What changed
- Discharge-by-11 piloted on three medical units (Internal Medicine, Cardiology, Hospitalist) ahead of full rollout. Pilot ED boarding hours dropped 79% over the 12-week pilot, in line with the simulated 86% reduction.
- Annual ED boarding hours forecast to fall from ~4,900 to ~670 once fully rolled out, freeing the morning beds that were previously held hostage by the afternoon discharge wave — closing the CMS target gap.
- CMS quality-bonus risk reduced by an estimated $1.4M annually (the bonus is tied to ED throughput and 6-hour-LOS performance).
- The "build more ED beds" capital project was deferred. The CFO's $5.2M plan to add 8 ED beds was reassessed against the simulation: the marginal P95 reduction those beds would have purchased is two-thirds the size of the boarding-hour reduction the discharge-timing change buys for essentially zero capex.
- Unit-by-unit discharge dashboards rebuilt to show the LogNormal hour-of-day distribution per unit rather than the daily-average discharge count, so unit managers can see which days they are clustering late and intervene.
ModelRisk Functionality Used
- Non-homogeneous Poisson arrivals with a fitted diurnal intensity, replacing the static "average hourly arrival" assumption that had hidden the 12:00–18:00 surge.
- Poisson admission arrivals on a midday surge envelope (~88 admits/day clustering 10:00–18:00), so the daily census conserves but the timing of admits collides with a late discharge wave — closer to real flow than an independent hourly average.
- LogNormal discharge-hour distributions parameterized per intervention scenario (mode 15:30 baseline, 13:30 intermediate, 11:30 target), capturing the late-skew of physician rounding habits.
- Hour-by-hour occupancy chain for 365 simulated days × 200 simulated years, producing both the heat-map visual and the annual boarding-hour distribution.
- Tornado ranking that placed discharge timing first by a clear margin, ahead of any structural intervention, directing the medical exec committee to the cheapest available lever.
- Pilot-to-forecast validation: 12-week unit-pilot ED-boarding reduction of 79% matched the simulated 86% expected reduction within sampling noise, giving the executive team confidence in the full-rollout projection.
Patient flow is not a queue problem; it is a time-of-day problem. The deterministic averages have no time-of-day in them. Monte Carlo simulation in ModelRisk is what makes the clock visible — and once the bottleneck has a coordinate, the cheapest unit of capacity is the one already in the building.