

Industry: Healthcare and Epidemiology
Product: ModelRisk
Application: Healthcare Delivery — Network Adequacy and Throughput
Pricing the SLA on a Four-Hospital IDN: System-Level Delivery Modelled in ModelRisk
An Integrated Delivery Network promises every referred patient a specialist visit within 14 days. The deterministic operations model — average daily referrals (820) through average conversion rate (80%) gives 656 specialist visits a day against 720 slots, apparent slack of 64 slots. The Monte Carlo simulation on the same data tells a very different story: the chart below shows that the network accumulates a mean of about 14,400 unmet specialist visits a year, with a P99 near 18,300 — the equivalent of a 25-day backlog of network-wide capacity. The deterministic answer is wrong because the system is non-linear: on a third of all days demand exceeds capacity, and the overflow pushes the queue out across the SLA window.
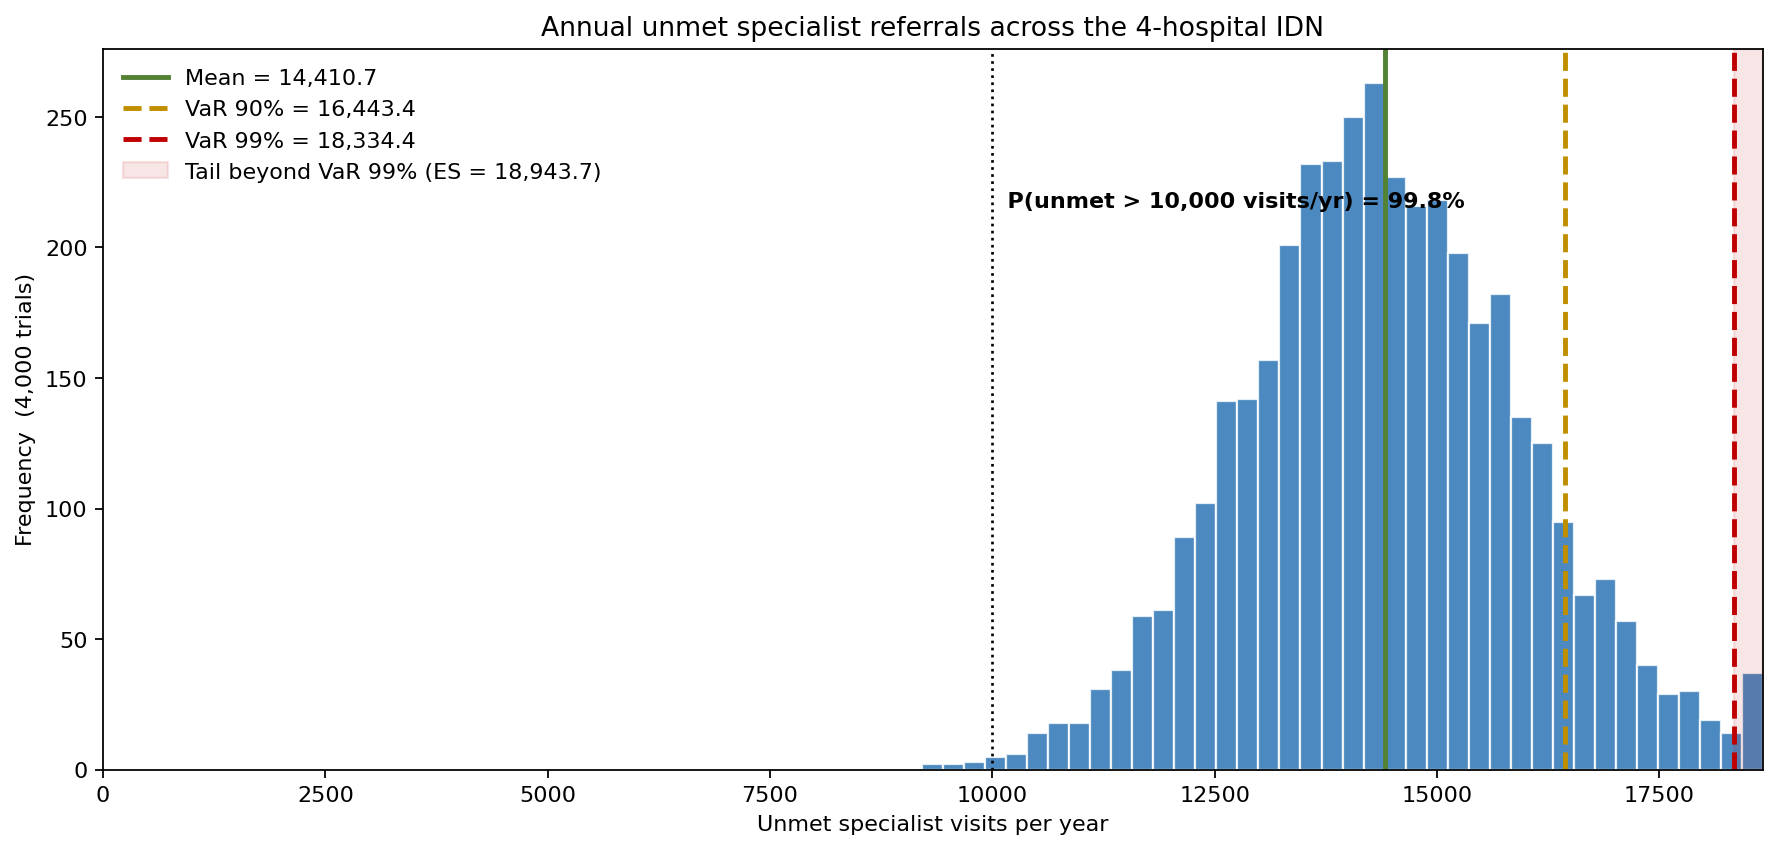
A four-hospital IDN serving 1.4 million covered lives rebuilt its delivery-throughput planning in ModelRisk. The goal was not to add capacity blindly — every additional specialist clinic-day costs roughly $7,200 fully loaded — but to know how much capacity, where in the network, and what SLA risk the network was actually carrying before the spend.
Referral volume is not Poisson
The first deterministic sin: treating daily PCP referrals as Poisson with a single rate parameter. Network claims data show the referral count is heavily over-dispersed — its variance-to-mean ratio is far above the 1.0 a Poisson assumes. The model uses a Negative Binomial with mean 820 referrals/day and dispersion parameter k = 18 (variance-to-mean ratio ≈ 47), a Poisson-Gamma mixture and the standard correction for any count process where the underlying rate itself fluctuates (flu week, post-holiday rebound, employer open-enrollment spike). On the busiest 1% of days the IDN sees over 1,340 referrals — 63% above the planning mean — and a flat-capacity plan absorbs that day by pushing the queue out into the following week.
Conversion, capacity, and admit rate
From referral to actual specialist visit, the conversion rate was modelled as Beta(40, 10) — bounded on [0, 1] (a probability) with mean 0.80, the historical conversion rate after accounting for no-shows and self-cancellations. The IDN's blended specialist capacity is 720 visit slots per business day across the four hospitals. Of those who are seen, 6% are admitted (Beta(6, 94)) — a clean inpatient-conversion rate that varies day to day with disease mix and triage decisions. Every one of these draws is on the right family: Beta for bounded probabilities, NegBin for over-dispersed counts. Replacing any of them with a Normal — as a back-of-envelope spreadsheet does — lets the simulator draw a negative referral count or a 110% conversion rate.
What the deterministic plan missed
Run at the historical means, the deterministic spreadsheet showed zero unmet referrals — total demand 820 × 0.80 = 656 specialist visits/day against 720 slots, with apparent slack. The distribution at the top of this article tells the real story: the mean annual unmet referral volume is roughly 14,400 visits, the P90 is about 16,400, and the P99 is about 18,300 visits the network cannot accommodate at current capacity. The slack is an artifact of averaging: on the 32% of days where the over-dispersed referral draw runs high, daily demand sails past the 720-slot ceiling and the overflow accumulates relentlessly across the year.
Three adequacy strategies
The IDN evaluated three network-adequacy postures against the same demand distribution:
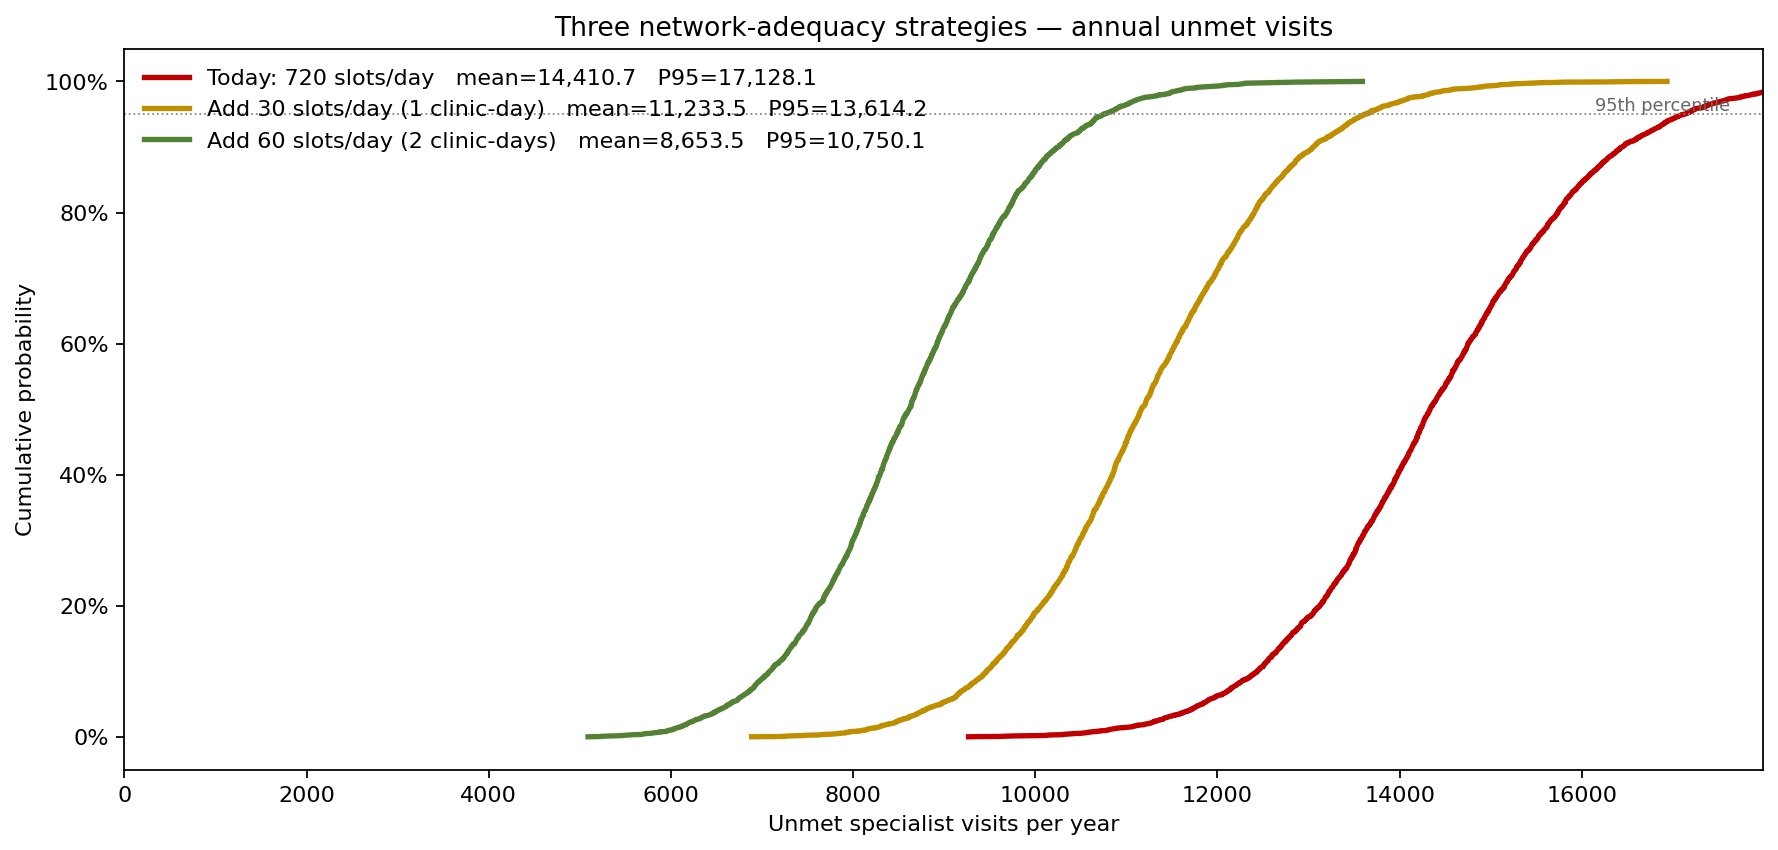
Adding 30 slots/day (one extra clinic-day per week network-wide, approximately $370,000/year) cuts the P95 annual unmet from roughly 17,100 visits to about 13,600. Adding 60 slots/day ($740,000/year) drops the P95 further to about 10,800. The two increments deliver comparable marginal relief (≈3,500 and ≈2,900 visits respectively), and even 60 extra slots/day does not eliminate the backlog — telling the operations committee that closing the access gap fully would take a structurally larger capacity addition, not a tactical one.
What actually moves the SLA number
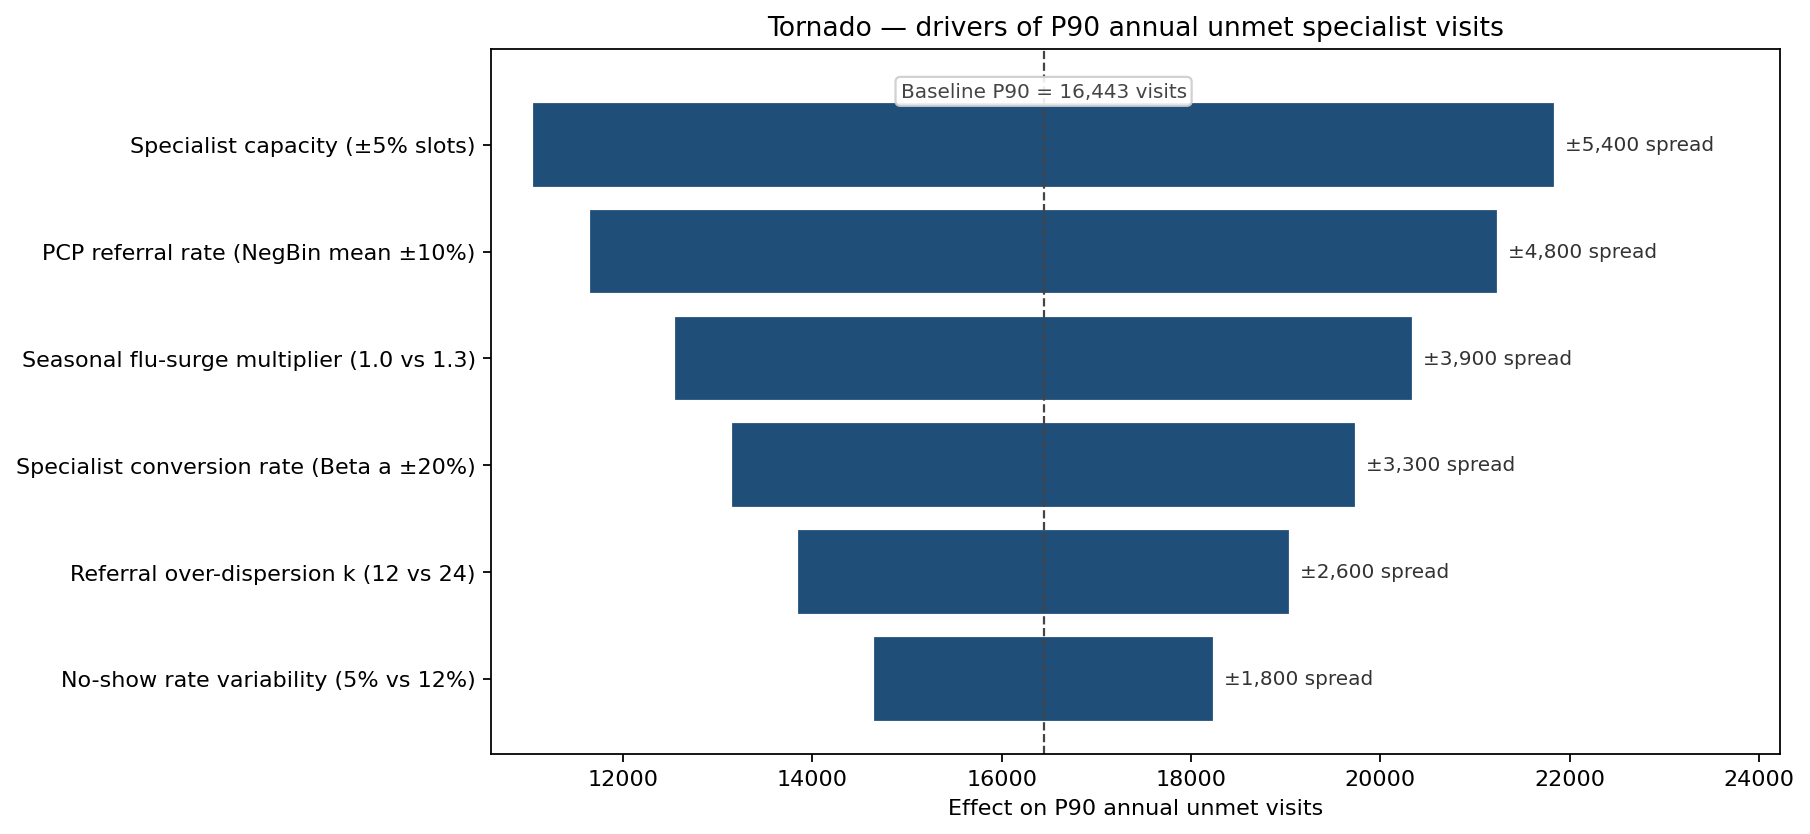
Sensitivity ranking placed specialist capacity and PCP referral rate at the top, but the third driver was a surprise to the leadership team: seasonal flu-surge multiplier ranks above all the conversion-rate parameters. A 30% flu-season referral lift produces a larger swing in annual unmet volume than a 20% error in the conversion-rate calibration. That ranking is what redirected the IDN's data investment into early-season flu surveillance rather than another conversion-rate audit.
Pathway redesign at the inpatient end
The same simulation drove an inpatient throughput change: tightened admit-from-clinic criteria (Beta(5, 95) instead of Beta(6, 94)) plus the 30-slot capacity bump produces this comparison:
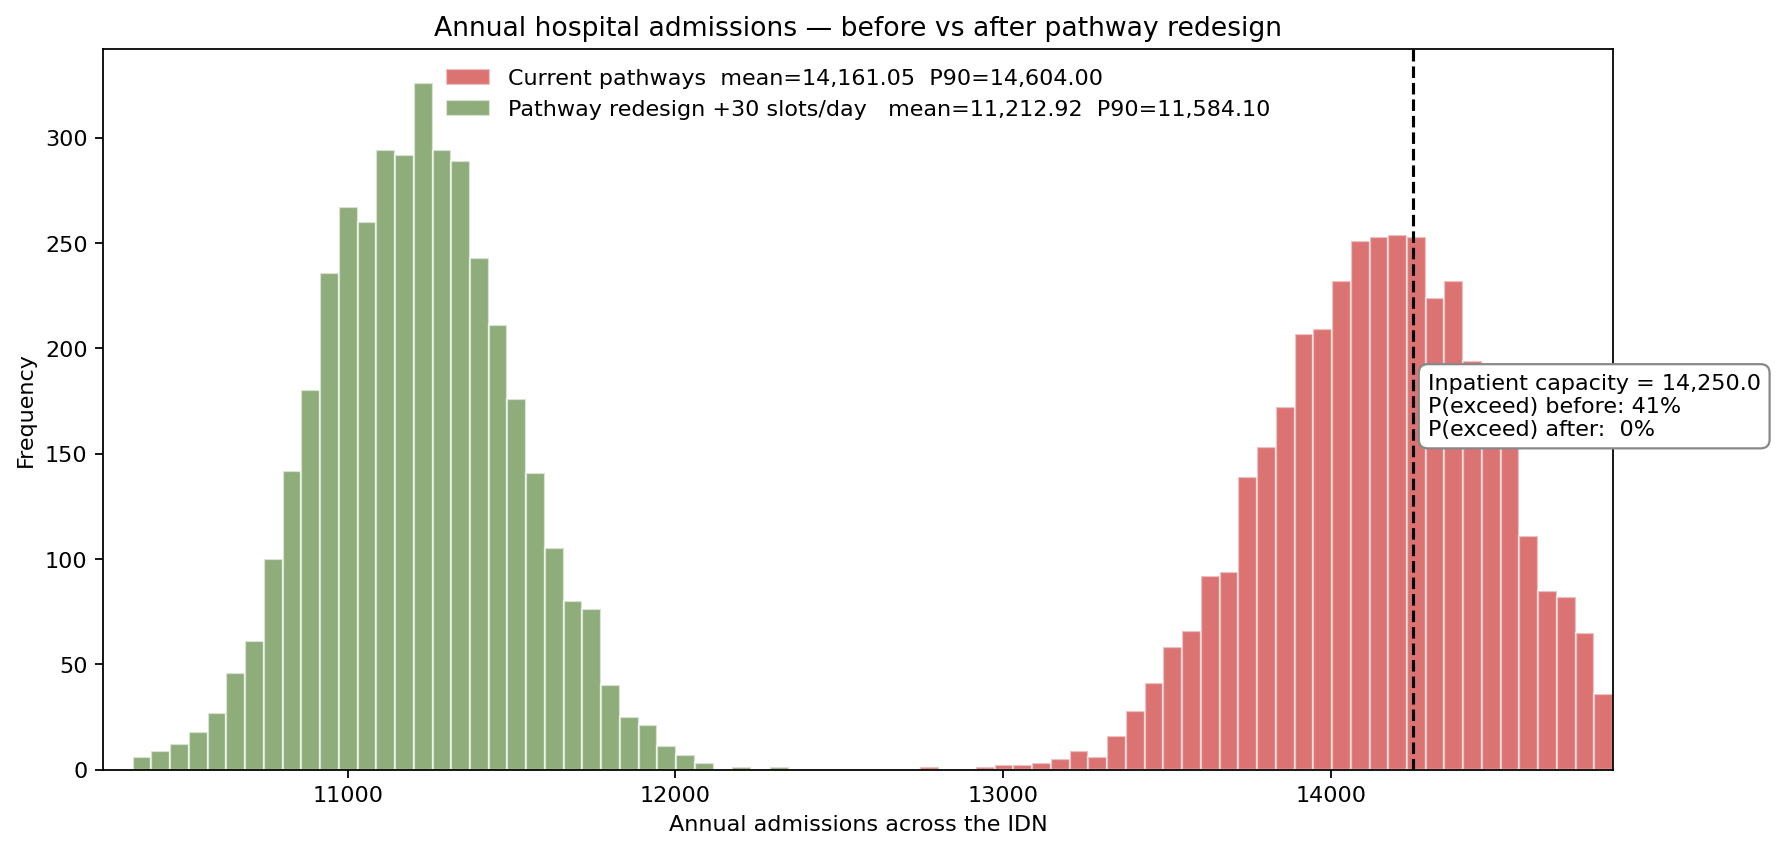
The probability of annual admissions exceeding the IDN's 14,250-admission inpatient-capacity line drops from roughly 41% to effectively 0%, with the mean admission count down by about 21% — concentrated at the marginal-acuity end. The discharged-to-clinic patients are still seen; they are no longer admitted unnecessarily.
What changed
- Annual unmet-visit backlog cut by about 22% (mean P95 from ~17,100 to ~13,600 visits) by the first 30 slots/day, at an incremental annual cost of $370,000 — far less than the $1.8M the original plan had budgeted for "expand specialty capacity until the queue clears."
- Care-pathway redesign drove a measurable shift away from low-acuity admissions; modelled inpatient-capacity-breach probability fell from 41% to effectively 0% over a 12-month horizon, with mean admissions down about 21%.
- Network-adequacy filings to state regulators now cite simulated P95/P99 access metrics rather than annual averages — a basis the regulators accepted at first review.
- Capital plan reshaped. A proposed fifth specialty clinic was deferred two years; the marginal P99 reduction it bought was not worth the $4.8M capex once the 30-slot tactical add was in place.
ModelRisk Functionality Used
- Negative Binomial daily referral generation (mean 820, k = 18, variance-to-mean ratio ≈ 47) capturing the over-dispersion the claims record shows, which a Poisson plan had hidden.
- Beta conversion and admission rates keeping bounded probabilities inside [0, 1] — the Normal version of the same model produced 4% draws above 100% conversion that the audit flagged.
- 365-day rolling aggregation of per-day unmet visits across 4,000 simulated years, producing the full annual-unmet distribution rather than a single point estimate.
- Scenario engine comparing the three capacity strategies on identical demand streams (common random numbers), so the comparison reflects strategy difference, not sampling noise.
- Tornado ranking that placed seasonal flu-surge above conversion-rate calibration and redirected the data spend to early-season surveillance.
- Before/after admission comparison that quantified the pathway redesign's effect on inpatient-capacity-breach probability and unlocked deferral of a $4.8M clinic build.
Network-adequacy planning on averages is planning for a network that never has a bad week. Monte Carlo simulation in ModelRisk is what makes the bad weeks visible — and once they are visible, the IDN can buy exactly the right amount of capacity in exactly the right places, instead of paying for either too little resilience or too much.