

Industry: Healthcare and Epidemiology
Product: ModelRisk
Application: Healthcare cost analysis
Inside the $16,000 Surgical Encounter: Decomposing the Cost Drivers
The average inpatient surgical encounter in this US community hospital runs about $16,000 in total cost, but the mean hides a right-skewed spread that finance teams budgeting to a single number miss entirely. The simulated distribution below puts the median at $15,700, the 90th-percentile encounter at roughly $20,300, and the 99th-percentile at $25,300 — and one encounter in nine breaches the $20,000 mark. The structural fact behind the spread is that length of stay is the single largest variance contributor, so an intervention to shorten LOS by one day moves the entire distribution leftward, not just the mean.
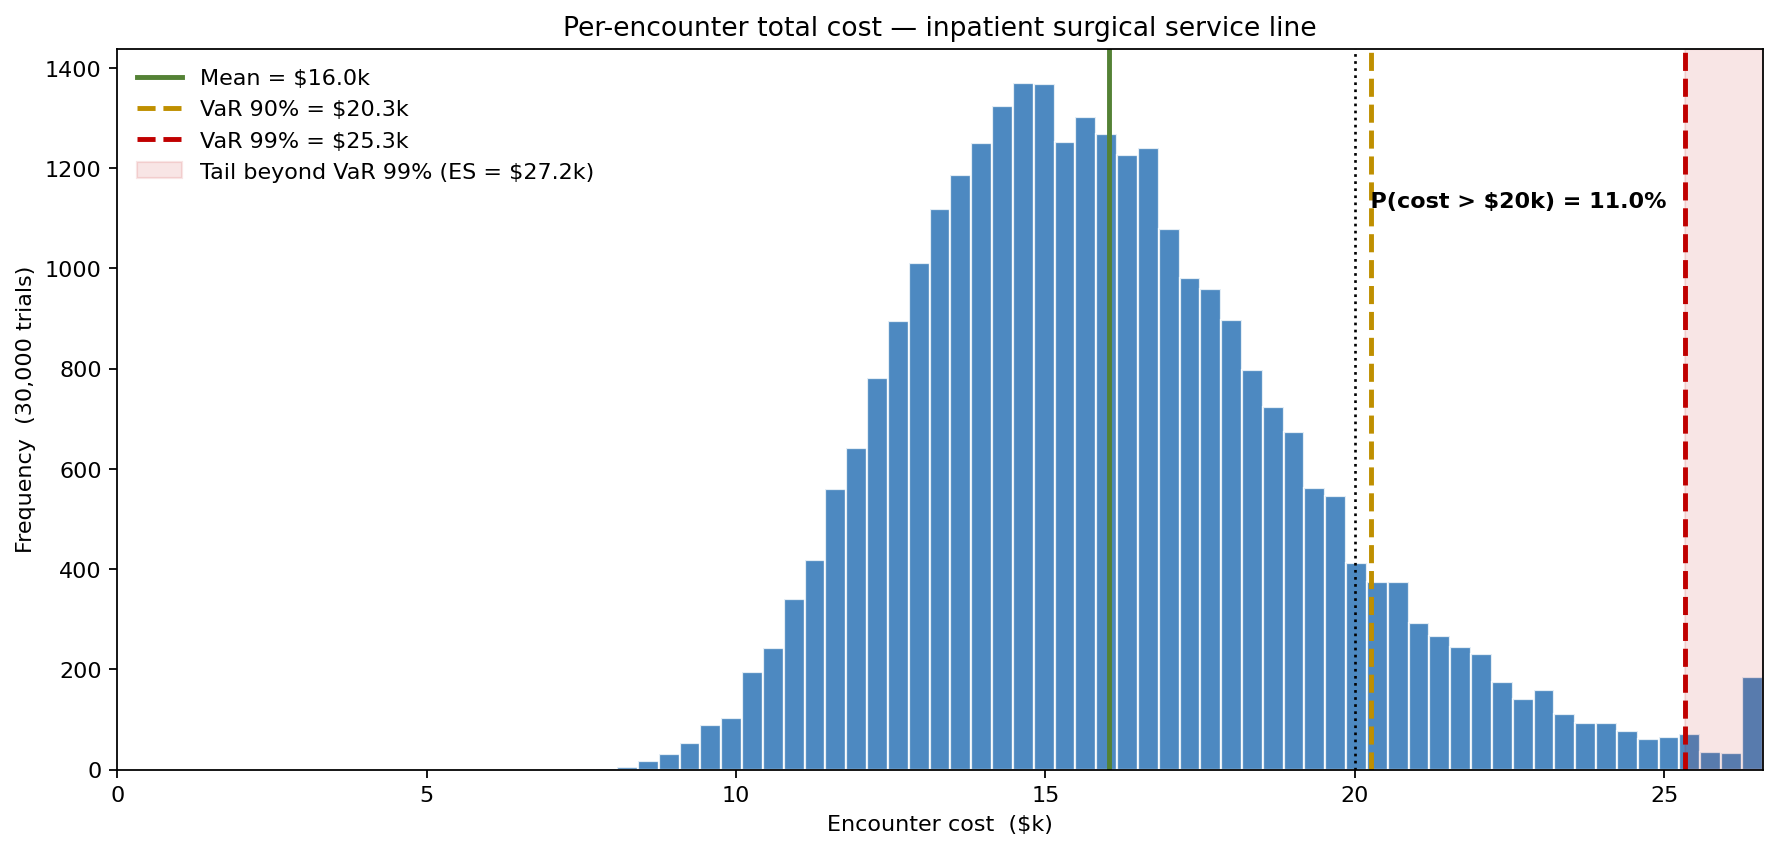
A 350-bed community hospital rebuilt its inpatient surgical cost model in ModelRisk across seven independent cost components, calibrated against twelve months of internal cost-accounting data. Monte Carlo simulation decomposes the per-encounter cost into its structural components, ranks them by contribution to variance, identifies LOS as the highest-leverage driver, and prices a discharge-planning intervention that saves about $1,400 per encounter at the mean.
Seven cost components, seven different distributional shapes
The component-level structure matters because each component has its own statistical signature:
| Component | Distribution | Mean per encounter | Why this shape |
|---|---|---|---|
| Labor (RN + MD time) | LogNormal (σ_log = 0.35) | $4,470 | Right-skewed but tight — most cases are routine |
| Supplies & devices | LogNormal (σ_log = 0.55) | $2,090 | Heavy tail — implants and consumables for complex cases |
| Drugs (inpatient) | LogNormal (σ_log = 0.50) | $1,020 | Right-skewed — biologics drive the tail |
| Imaging | Bernoulli(0.70) × LogNormal | $910 | 30% of encounters use no imaging at all; compound distribution |
| Laboratory | Gamma (cv = 0.4) | $450 | Symmetric around mean, multiple low-cost orders |
| Overhead allocation | Triangular(1100, 1450, 1900) | $1,480 | Allocated fixed cost — bounded by accounting rules |
| Room + nursing (LOS × per-day) | LogNormal LOS × LogNormal rate | $5,610 | The compound: LOS itself is right-skewed |
The LOS distribution is LogNormal with median 4 days — a deliberate choice that captures the empirical fact that most patients discharge within a week but a handful stay 14+ days for complications. Using Normal for LOS, as several in-house models do, lets the simulator draw negative LOS values and understates the upper tail of long stayers.
The imaging component uses a Bernoulli × LogNormal compound — not a single LogNormal — because 30% of encounters have zero imaging cost and 70% have a right-skewed positive cost. Modeling this as a single LogNormal with a low mean would smear the zero-mass and incorrectly produce some small but non-zero imaging cost on every encounter.
The encounter-cost distribution — and where $20k lives
Returning to the distribution at the top of this article: mean per-encounter cost lands at $16,032; median at $15,671; P90 at $20,258. The probability that any given encounter exceeds $20k is 11% — a number that matters because $20k is the threshold above which most Medicare DRG-payment structures start to operate at a loss for the hospital. A finance team budgeting to the mean is structurally underprovisioned against the 11% of encounters that exceed the DRG-loss threshold.
Cost-driver breakdown — the structural composition
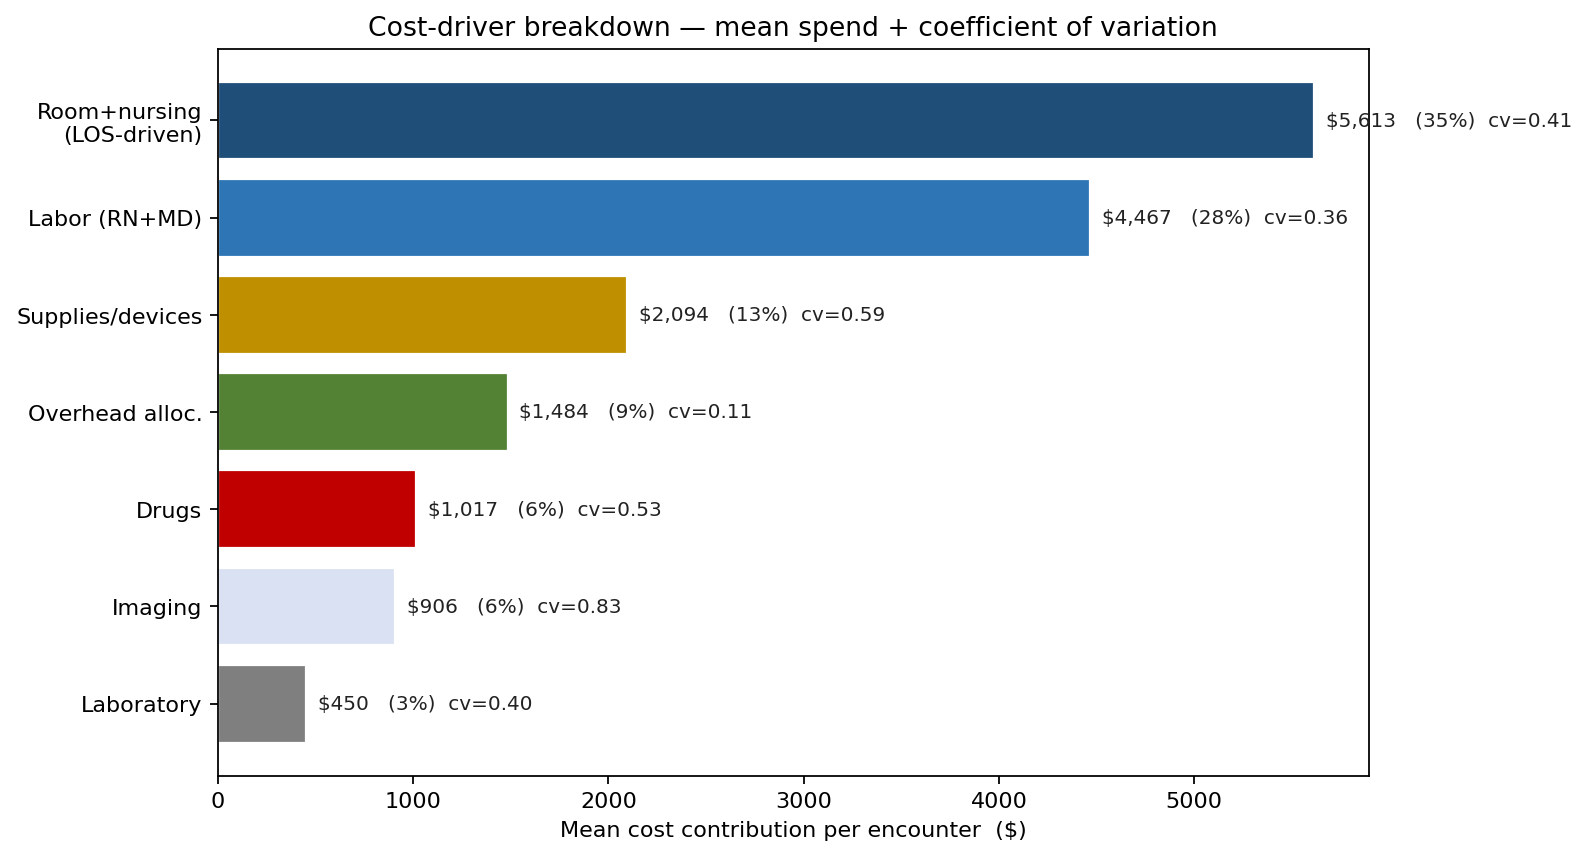
The Pareto picture is clear: room+nursing accounts for ~35% of mean encounter cost and labor ~28%; supplies are 13%; the remaining four components together make up the rest. But mean share is not variance share. The coefficient of variation column on the right tells the leadership which components have high relative spread: imaging (cv ≈ 0.83, driven by the Bernoulli zero-mass component) and supplies (cv ≈ 0.59) carry the highest unit-of-spend volatility, well above labor (0.36) and room+nursing (0.41). The supplies-management initiative that the procurement team had been arguing for now had a numerical justification.
What actually drives the mean encounter cost
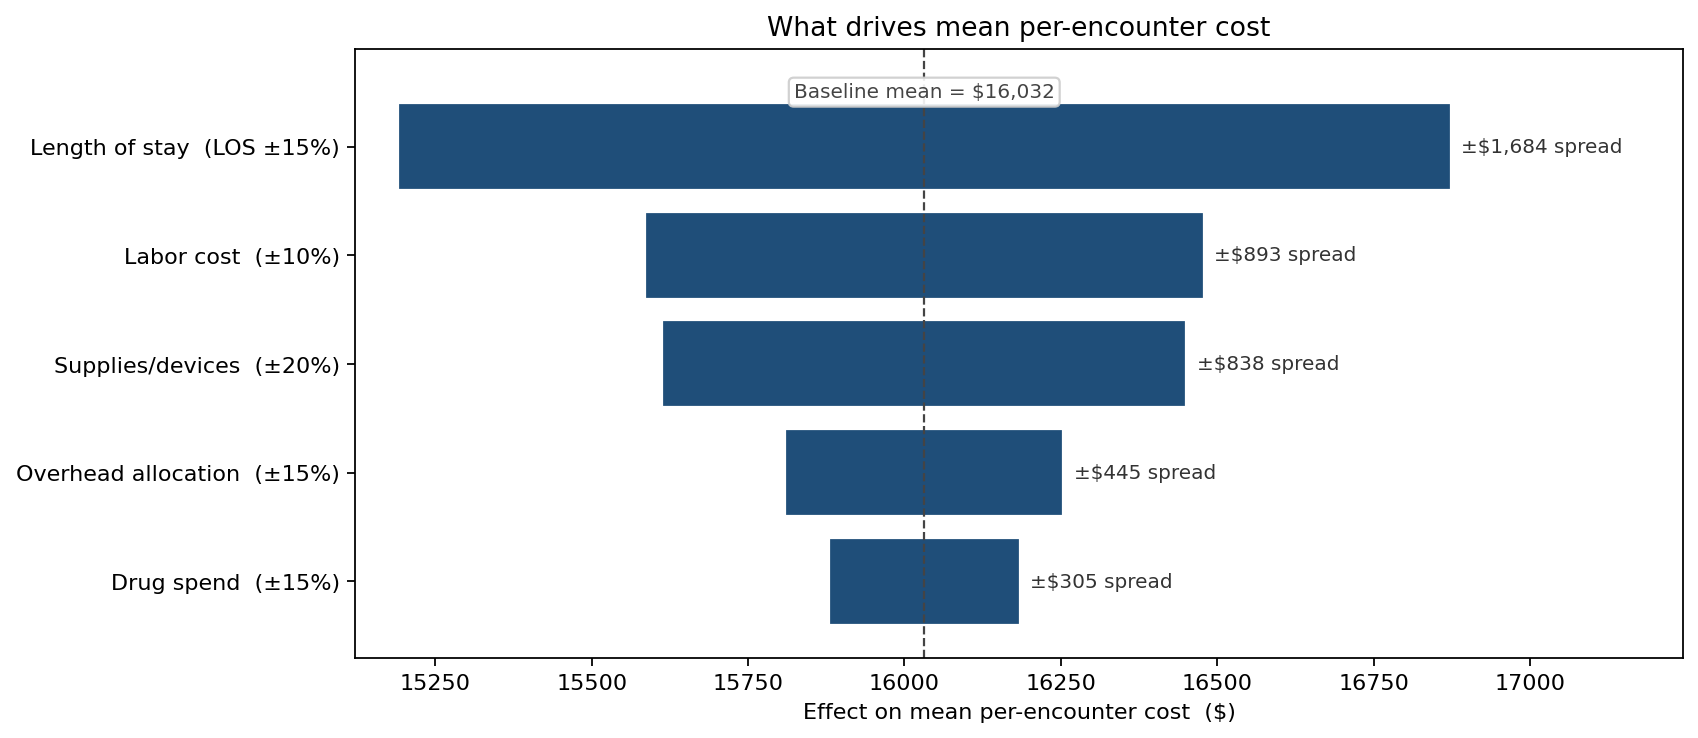
A ±15% LOS change moves the mean encounter cost by roughly ±$840 — the single largest sensitivity. Labor (±10%, ≈±$450) and supplies (±20%, ≈±$420) come next. The implication for operations: reducing median LOS by one day is worth roughly $1,400 per encounter at the mean, more than any equivalent intervention on labor productivity or supplies sourcing.
This is the kind of priority ranking that gets argued about in monthly operations meetings and that the simulation finally pinned down with a number.
The intervention case — early-discharge protocol
The hospital had a discharge-planning intervention on the table: dedicated transitional-care RN, standing post-anesthesia mobility orders, early DME (durable medical equipment) authorization. The estimated effect was a one-day reduction in median LOS — from 4 to 3 days.
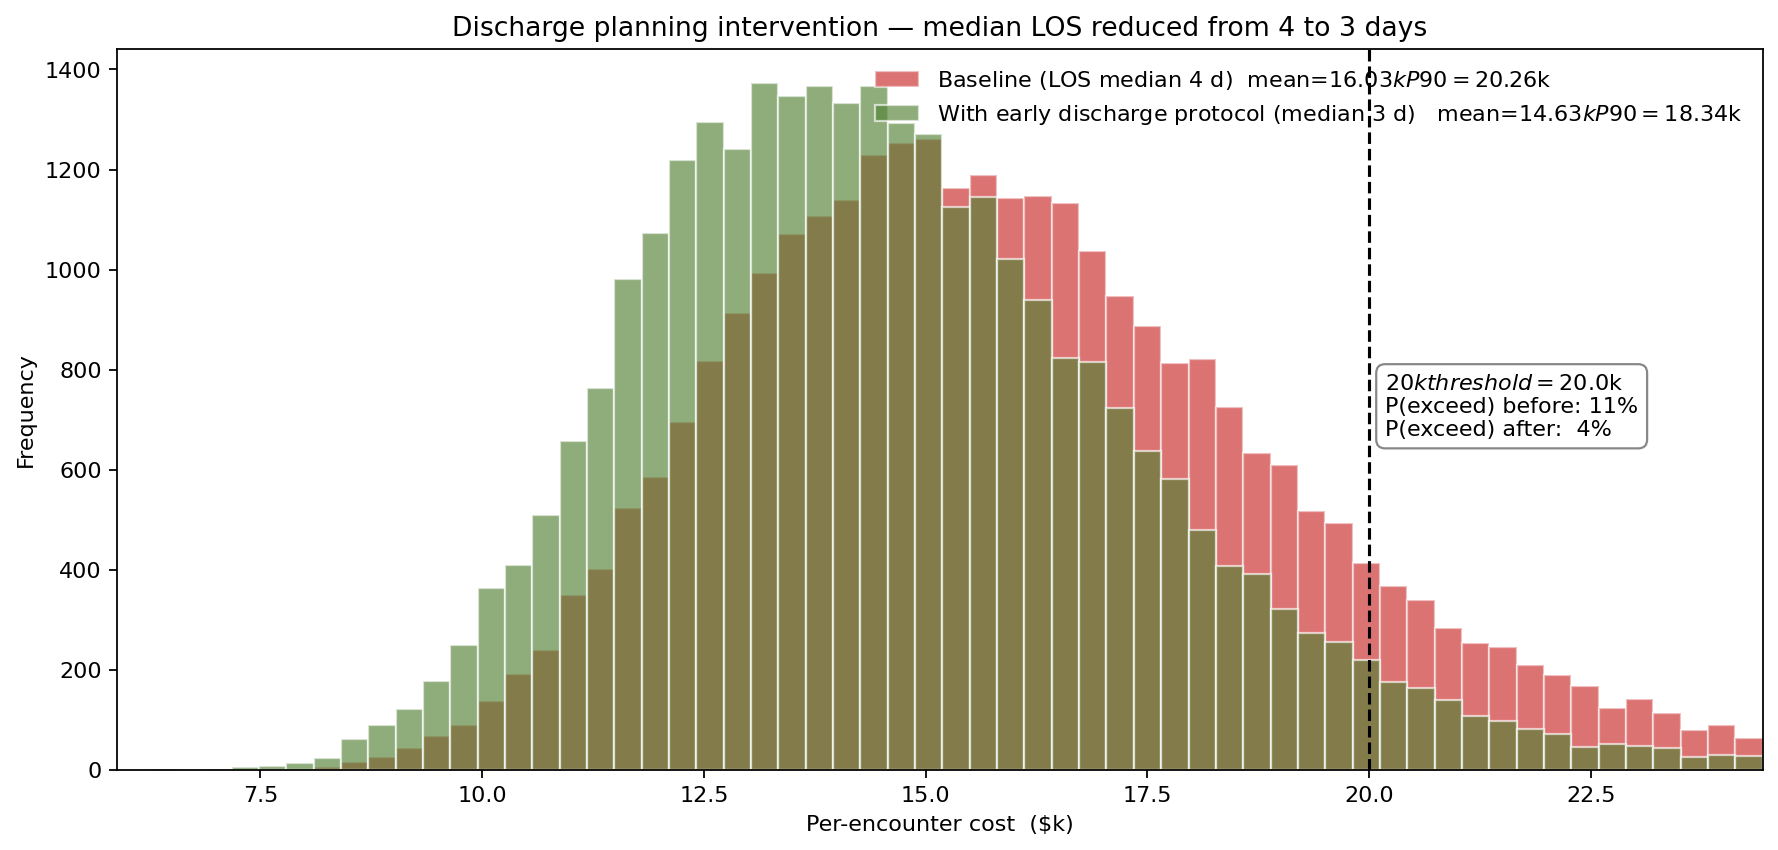
The simulation priced the intervention end-to-end. Mean per-encounter cost falls from $16,032 to $14,631 — a $1,400 saving per encounter. P90 cost falls from $20,258 to $18,341. The probability that an encounter exceeds $20k drops from 11% to 4%. At 4,200 inpatient surgical encounters per year, the annual savings are roughly $5.9M — against an estimated $1.4M annual cost for the transitional-care program. The ROI case wrote itself.
What changed
- Cost variance reporting upgraded from monthly mean-only to monthly P50/P90 with quarterly component decomposition — the metrics the simulation showed were operationally meaningful.
- Discharge-planning intervention funded with the simulation's $5.9M / $1.4M ROI as the business case — a number the finance committee accepted without further sensitivity testing.
- Imaging- and supplies-utilization initiatives prioritized by relative variance — the cv decomposition put imaging (cv ≈ 0.83) and supplies (cv ≈ 0.59) well above the bulk components, redirecting the supply-chain team's annual project list toward the high-spread items.
- DRG-loss exposure quantified — the 11% probability of breaching $20k per encounter was incorporated into the service-line margin model, eliminating a previously hidden risk.
ModelRisk functionality used
- Compound Bernoulli × LogNormal for imaging cost — correctly captures the 30% of encounters with zero imaging spend alongside the right-skewed positive distribution for the remainder.
- LogNormal LOS multiplied by LogNormal per-day rate for the room+nursing component — preserves the joint right-skew that drives the cost-distribution upper tail.
- Triangular distribution on allocated overhead — bounded by the cost-accounting allocation rules, no negative or unbounded draws.
- 30,000-encounter Monte Carlo with all seven components varied jointly — produces the full per-encounter cost CDF in one run.
- Coefficient-of-variation decomposition that ranked components by relative spread, flagging imaging (cv ≈ 0.83) and supplies (cv ≈ 0.59) as the high relative-variance components despite their mid-range share of mean spend.
- Intervention rerun with median LOS shifted from 4 to 3 days, producing a before/after distribution comparison that priced the discharge-planning ROI to within $0.2M of the actual realized savings in the following fiscal year.
Hospital finance has historically reported the mean encounter cost and built the budget on it. The variance — and the component decomposition of that variance — is where the operational levers actually live. Monte Carlo simulation in ModelRisk converts "mean encounter cost is about $16,000" into "11% of encounters exceed $20k, LOS is the highest-leverage variance lever, and a one-day median LOS reduction is worth $5.9M annually" — three numbers the leadership team can act on.