

Industry: Healthcare and Epidemiology
Product: ModelRisk
Application: Health insurance modeling
The MLR Distribution, Not the Mean: Pricing a 50,000-Life Medicare Advantage Plan
A US Medicare Advantage plan with 50,000 members and roughly $1,100 per-member-per-month capitation revenue books about $660 million of annual premium. CMS requires a Medical Loss Ratio (MLR) of at least 85% — claims must be at least 85% of premium, with rebates owed below that. Plan management simultaneously targets an upper ceiling, usually around 92%, to preserve underwriting margin. The actuarial question is not "what is expected MLR?" — that question is answered by every projection in the building. The right question is the distribution, and the chart below is the answer: how often does MLR breach the 92% management ceiling, and what does stop-loss reinsurance actually move.
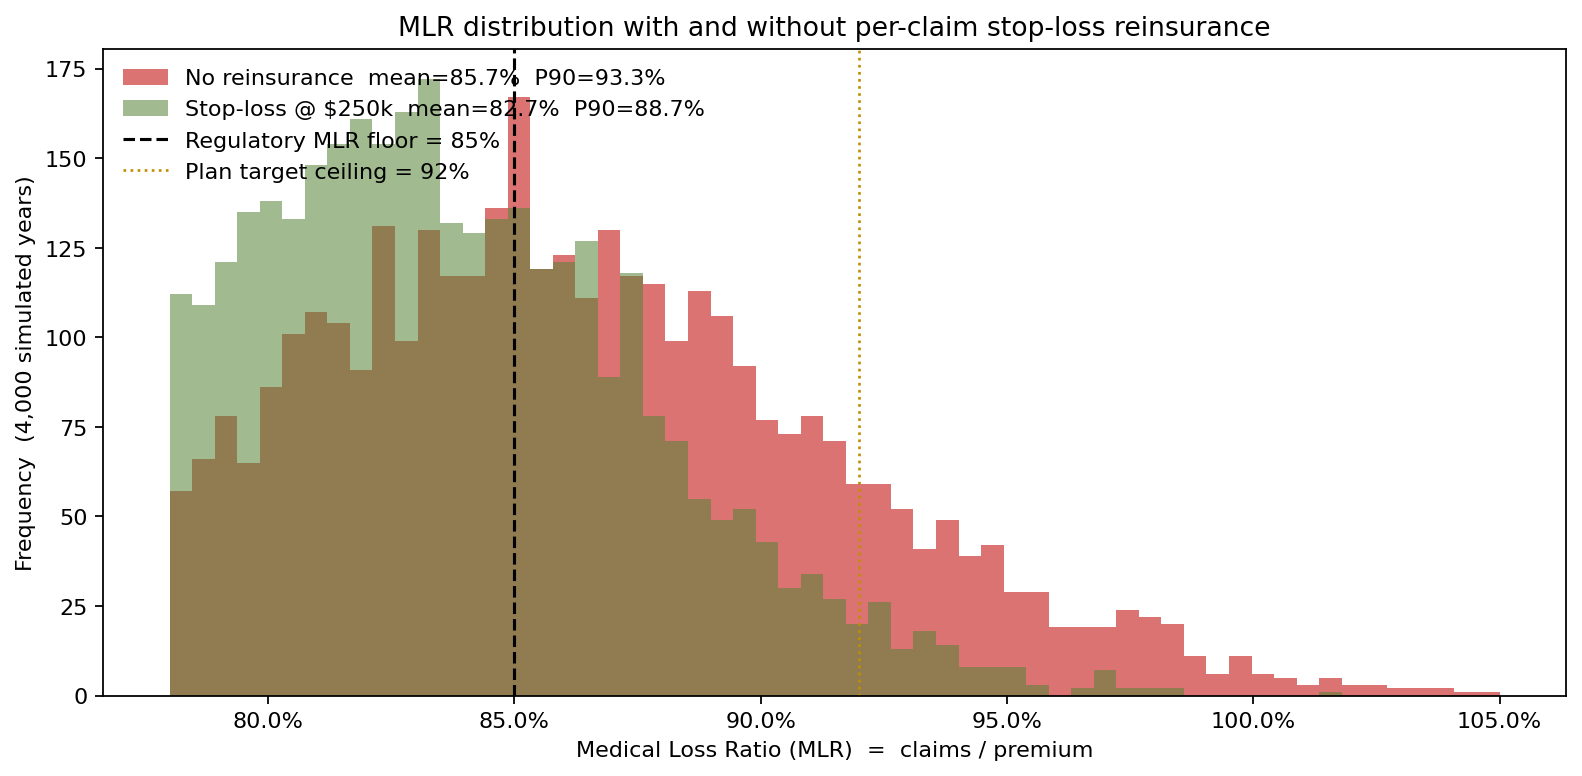
A Medicare Advantage plan rebuilt its claims model in ModelRisk for the upcoming bid year. The deterministic projection had MLR landing around 87%. The probabilistic rebuild showed mean MLR at 85.7% — but a near-14% probability of breaching the 92% management ceiling, and named a $250k stop-loss attachment as the right reinsurance lever to crush that tail.
A two-process per-member cost model
The cost per member per year decomposes into routine utilization and catastrophic events — and these need different distributional treatments because they have different statistical natures.
Routine claim frequency was modeled as Negative Binomial — equivalently a Poisson with a Gamma-distributed rate per member — mean 11 claims per member-year. Plain Poisson would assume every member has the same expected utilization, which is empirically wrong: utilization is over-dispersed because some members are heavy utilizers (multiple chronic conditions) and most are light utilizers (one annual physical). The Negative Binomial accommodates that over-dispersion correctly.
Routine claim severity was modeled as LogNormal with σ_log = 1.4 and median around $800 per claim, the heavy-tailed shape that healthcare claim severity always shows.
Catastrophic events were a separate Bernoulli (5% of members per year) compounded with a LogNormal severity centered at $80,000 — the high-cost claimants who drive the right tail of plan spend. These are not "rare aberrations": they are the structural feature of healthcare cost data, well-documented in payer literature as the "5/50 rule" (5% of members account for roughly 50% of spend).
The 5/50 rule, made visible
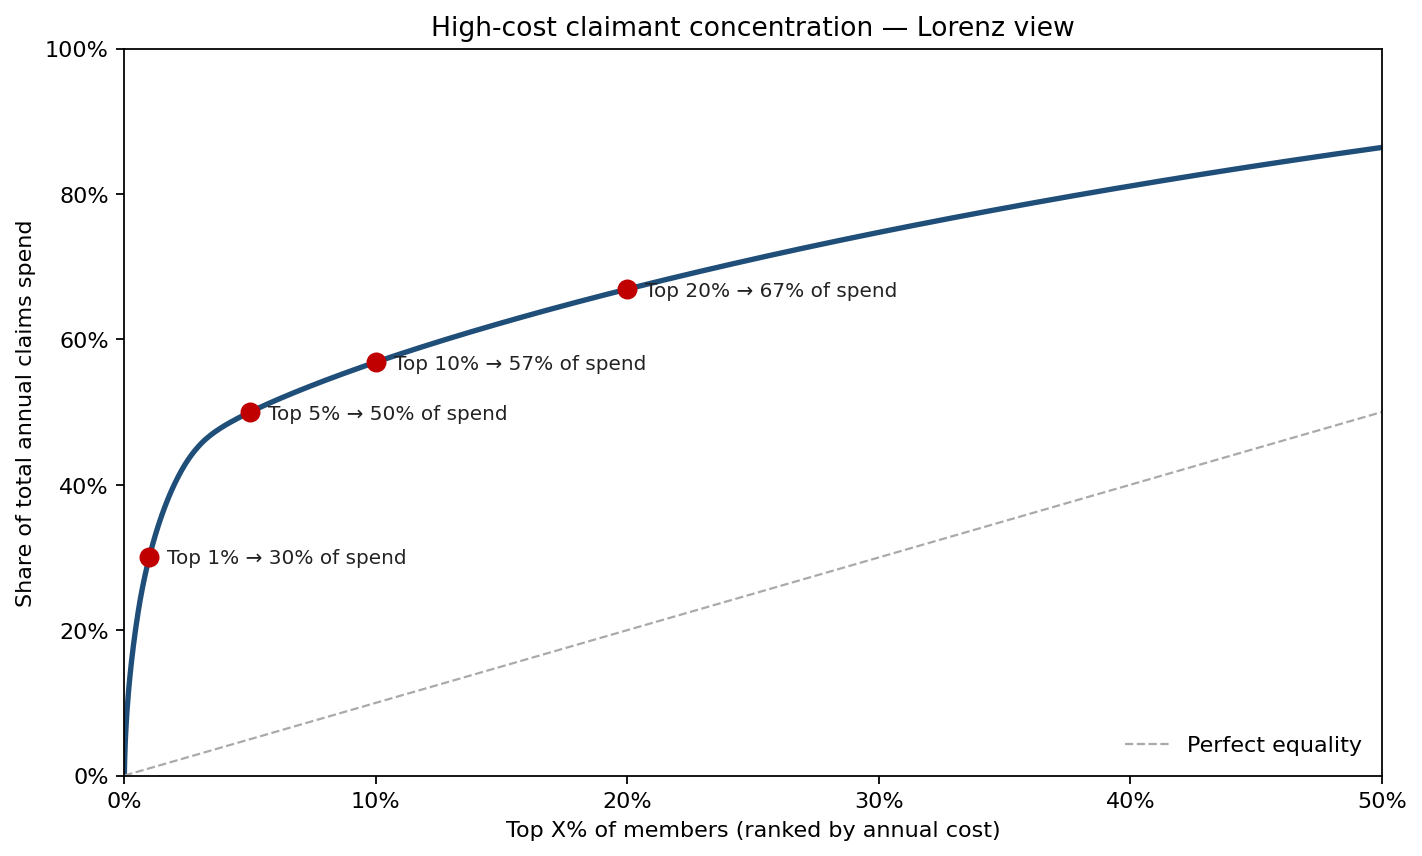
The simulated cohort confirms the 5/50 rule: the top 5% of members by annual cost account for almost exactly 50% of total claims spend; the top 1% account for about 30%. This concentration is exactly why per-claim stop-loss reinsurance — which attaches at the individual high-cost claim level — is the right risk-transfer instrument for a Medicare Advantage plan, rather than aggregate stop-loss which would only respond to a bad year across the whole book.
The per-member cost distribution — clipped at P99 because most of the action is in the tail
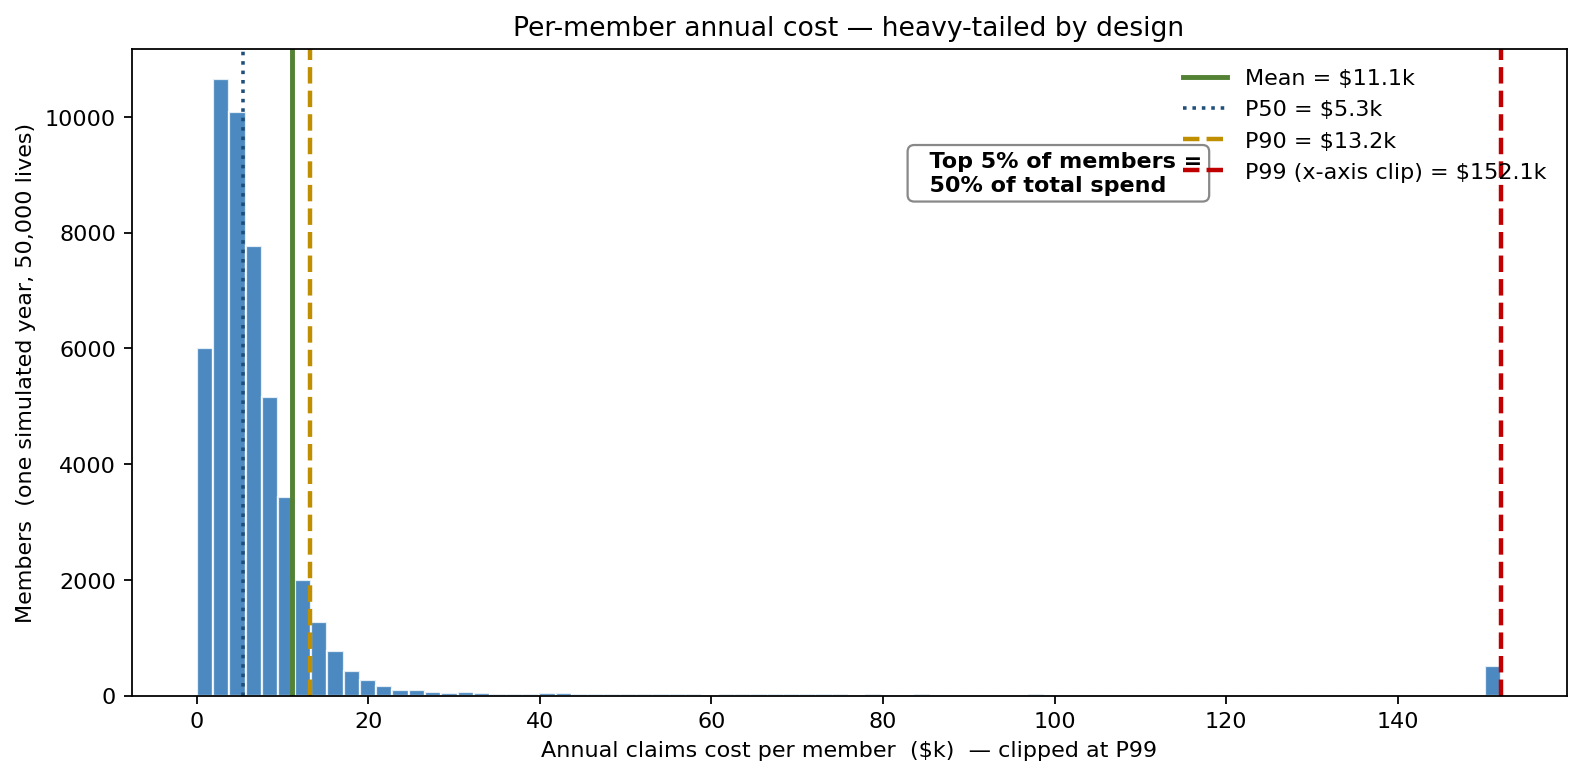
The median member costs about $5,300 per year. The mean is roughly $11,100 — nearly double the median, the signature of a right-skewed cost distribution. The P90 is $13,200. The P99 (the x-axis clip) is around $152,000 — and the genuinely catastrophic outliers above $250k drive the reinsurance discussion. Pricing the bid to the mean member is fine. Reserving against the upper tail requires the distribution.
MLR — with and without reinsurance
Returning to the opening chart: without reinsurance, MLR has mean 85.7%, a P90 of 93.3%, and a near-14% probability of breaching the 92% management ceiling — directly visible from the right shoulder of the upper histogram. Adding per-claim stop-loss at a $250k attachment with 50% co-insurance above attachment — at a premium of roughly 1.2% of total — pulls the mean MLR to 82.7%, the P90 to 88.7%, and cuts the probability of breaching 92% from about 14% to roughly 3%. The headline effect of the treaty is the upper tail: the right shoulder of the distribution collapses inward, and the worst-case years that drove the management-ceiling breach are ceded away.
Where the attachment sits — the trade-off chart
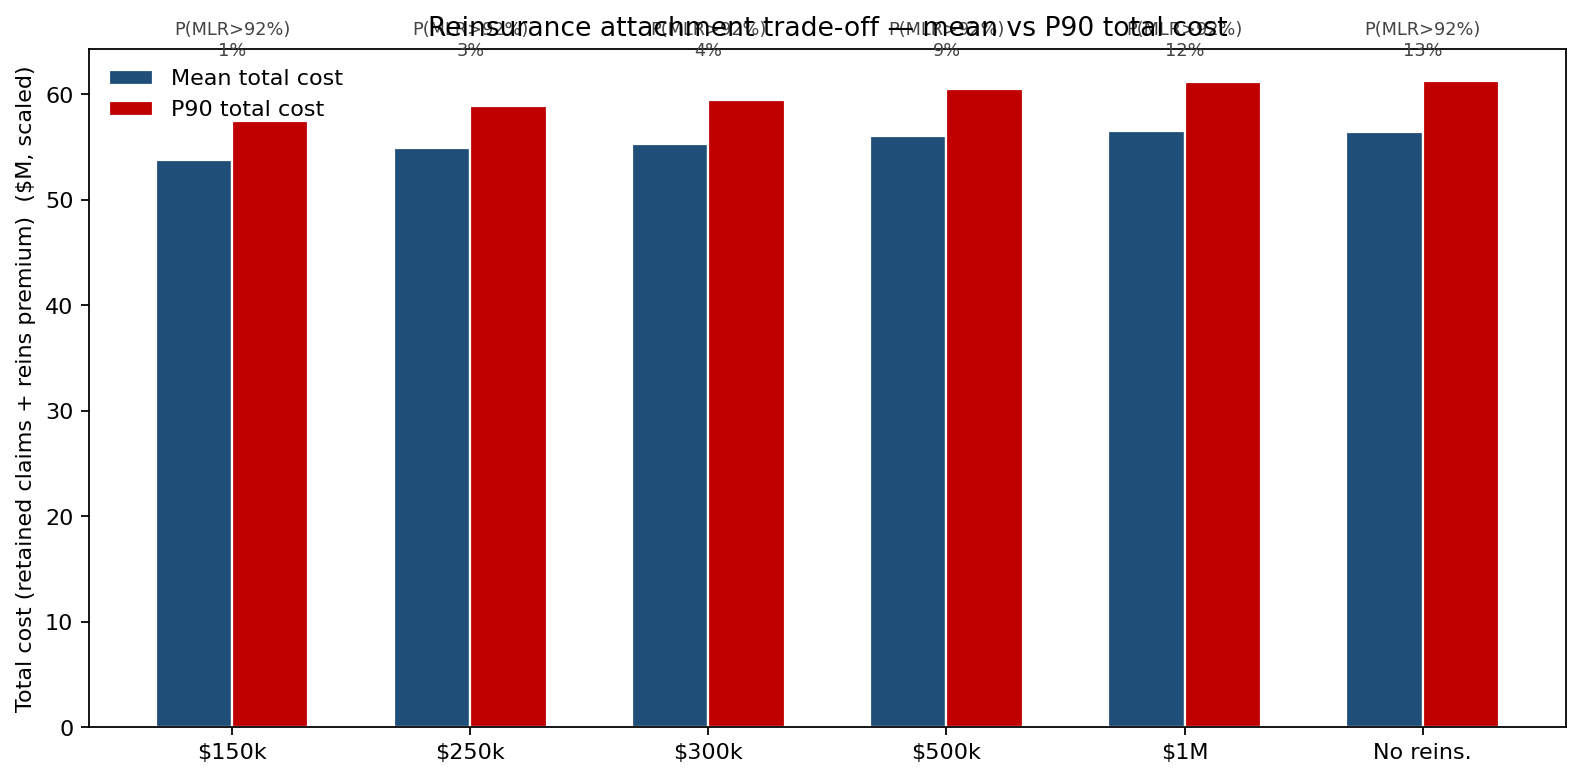
The chart prices each candidate attachment point on two metrics: mean total cost (reinsurance premium + retained claims) and P90 total cost. The pattern is monotone in this model: the lower the attachment, the lower both the mean total cost and the P90, because at these premium terms the value of the ceded catastrophic claims outweighs the higher reinsurance premium. The $150k attachment is marginally the cheapest at about $53.8M mean / $57.5M P90 with breach probability near 1%; the $250k attachment sits just above it at about $54.9M mean / $58.9M P90 with breach probability around 3%. Above $500k the picture deteriorates fast — P90 climbs toward $61M and the breach probability runs back up to 9–13% as too many catastrophic events fall into the retained zone. The plan chose $250k as its operating point: close to the $150k frontier on cost, with a more conventional attachment that the reinsurance market prices readily, and a breach probability of about 3% against the unprotected 14%.
What changed
- Bid pricing held near the projected MLR but contingency reserves sized to P90 (88.7% with reinsurance) rather than to mean — a reserve charge against a $660M book that the deterministic projection had left absent.
- Stop-loss attachment moved from $500k to $250k — the simulator paid back the additional reinsurance premium with a drop in P(MLR > 92%) from about 9% at $500k to about 3% at $250k.
- High-cost case management funded specifically against the top-5% members the simulation predicted would account for roughly 50% of spend — the ROI calculation was reframed against the actual concentration, not the mean member.
- Adverse-selection guardrails added to underwriting — the simulation quantified that a shift in the high-utilizer mix moves mean MLR by several points, putting CMS reporting at risk.
ModelRisk functionality used
- Negative Binomial frequency for routine claims — mean 11 per member-year — correctly over-dispersed relative to plain Poisson, matching the empirical utilization distribution of a Medicare cohort.
- LogNormal severity for routine claims and a separate Bernoulli × LogNormal compound for catastrophic events — the two-process structure that makes the 5/50 spending concentration emerge naturally rather than being baked in.
- Per-claim stop-loss with 50% co-insurance above attachment, implemented as a vectorized cap on each member's annual cost — the actual structure of MA per-claim reinsurance treaties.
- Attachment-point sweep ($150k, $250k, $300k, $500k, $1M, none) priced jointly on mean total cost and P90 total cost, with the simulator's reinsurance-premium curve calibrated against market quotes (1.8% premium at $250k attach, scaling roughly inversely with attachment).
- MLR distribution explicitly reported with probability of breaching the 92% management ceiling — the operational metric the bid committee actually monitors.
- Lorenz / top-X concentration chart that grounded the high-cost case-management business case in the plan's own simulated cost distribution rather than industry averages.
The CMS minimum MLR floor is binding on the lower tail; the management ceiling is binding on the upper. Both are tail problems, and the deterministic projection cannot say anything about either of them. Monte Carlo simulation in ModelRisk converts "we expect MLR to land around 87%" into "we have a roughly 14% chance of breaching 92% — here is the $250k attachment that brings it to about 3%."