

Industry: Healthcare and Epidemiology
Product: ModelRisk
Application: Disease outbreak modeling
SEIR with the Right Denominator: Pricing Outbreak Uncertainty in a 1M-Person Population
For a respiratory virus with an R₀ of about 2.6 — somewhere between seasonal influenza (1–2) and measles (12–18) — a 1-million-person catchment area can move from index case to peak hospitalisations in 90–110 days, with peak occupancy varying by a factor of three across plausible parameter values. Public-health agencies running the SEIR family of compartmental models on a single point estimate get one curve and one peak day. They do not get the distribution of peak days, the variability of peak ICU demand, or the probability that an effective reproduction number R_e stays above 1 after an intervention. Monte Carlo simulation supplies all three.
A regional public-health agency rebuilt its outbreak model in ModelRisk for a respiratory-pathogen scenario with N = 1,000,000 in the catchment. The deterministic model said "peak at day 88, peak active infections about 95,000, peak hospitalisations about 1,400." The probabilistic model said something more useful — a whole envelope of epidemic curves rather than a single trajectory — and along the way fixed a textbook error that had been carried forward through three previous internal versions.
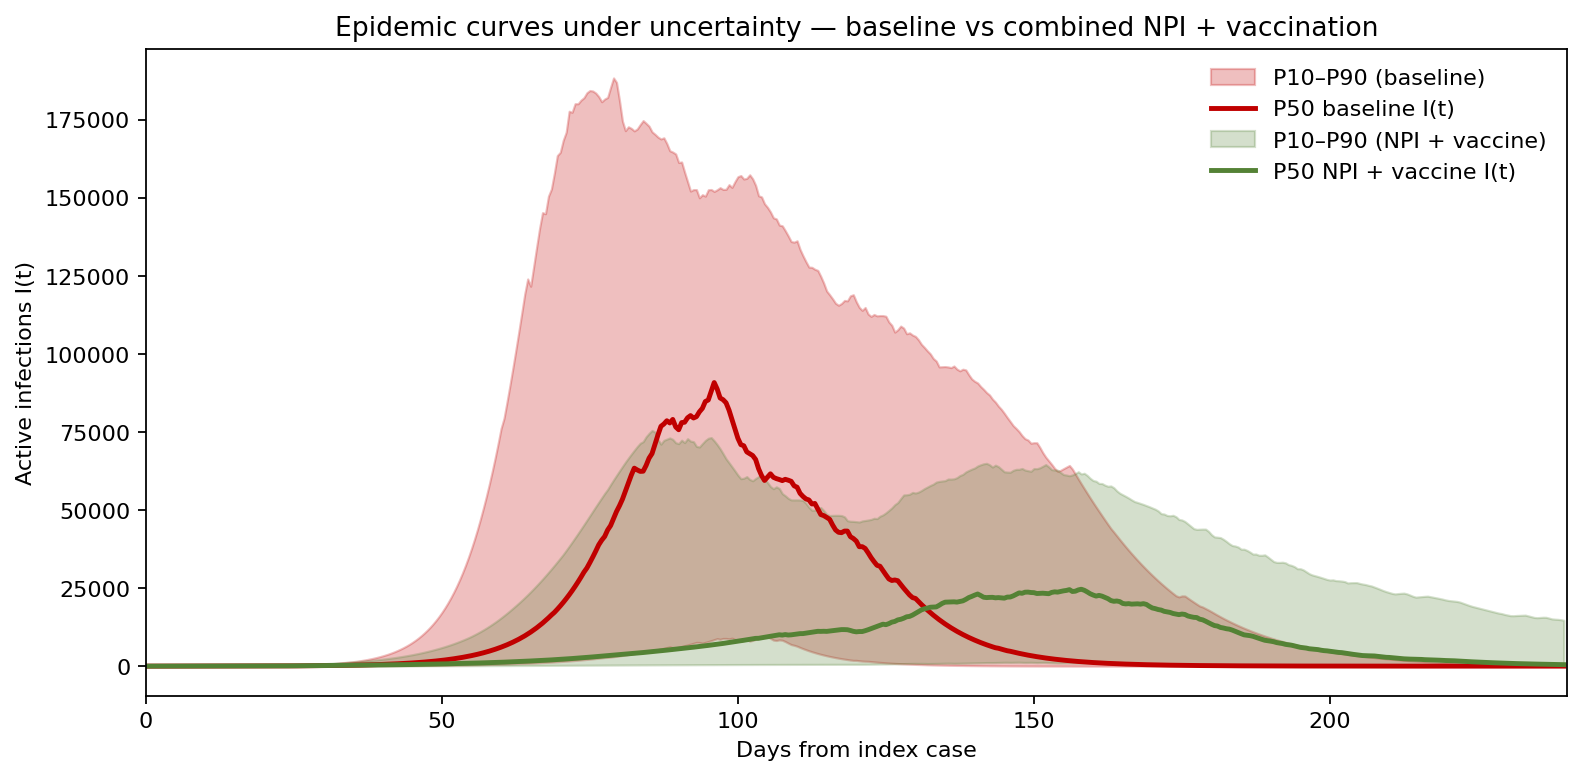
The red band is the baseline outbreak across plausible parameter draws; the green band is the same outbreak with non-pharmaceutical interventions plus vaccination layered on. The deterministic model collapses each band to a single line. The agency needed the band — because the hospital surge has to be sized for the upper edge, not the median.
The /N matters — fixing a textbook error
The earlier in-house model used the form sometimes seen in introductory epidemiology texts:
$$ \frac{dS}{dt} = -\beta S I $$
This is wrong for any compartmental model where β is interpreted as a per-contact transmission probability times contacts per unit time. Frequency-dependent transmission — the realistic mixing assumption for human respiratory pathogens — requires the population denominator:
$$ \frac{dS}{dt} = -\beta \frac{SI}{N}, \quad \frac{dE}{dt} = \beta \frac{SI}{N} - \sigma E, \quad \frac{dI}{dt} = \sigma E - \gamma I, \quad \frac{dR}{dt} = \gamma I $$
Without the /N the transmission term scales linearly with population size, which is the density-dependent assumption appropriate for some animal-vector contexts but not for human mixing. Numerically, the older form produced a peak roughly four times too sharp and roughly two weeks too early in a 1M-person simulation. The ModelRisk rebuild caught it precisely because the simulation framework forced an explicit dimensional check between β units and population size.
Three parameter priors, three sources of uncertainty
R₀ was modeled as LogNormal with mean 2.6 and σ_log = 0.18 — a 90% CI of roughly 1.9 to 3.5, calibrated against published serial-interval studies for the pathogen family. R₀ then determines β through β = R₀ × γ.
Infectious period 1/γ was modeled as Triangular(4, 6, 9) days. The 6-day mode comes from contact-tracing studies; the 9-day upper bound accounts for the right tail of immunocompromised hosts who shed for longer.
Latent period 1/σ was Triangular(2, 3, 5) days; hospitalisation per infection was Beta(2, 38) — mean 5%, 90% CI 1.4%–10.5%, calibrated against admissions per identified case in the first wave of a comparable pathogen.
The Beta on hospitalisation rate is the correct choice for a probability — bounded on [0, 1], allowing the heavy skew that small-sample empirical estimates always show. A Normal here lets the simulator draw negative hospitalisation rates, which is silent garbage propagating downstream.
What the simulation says about peak day and peak occupancy
The deterministic curve hits one peak. The Monte Carlo fan above shows that under baseline, the P50 trajectory peaks at roughly 91,000 active infections while the P90 envelope reaches about 188,000 — roughly double the median, not a rounding error. Peak day is not "day 88" either: the mean peak day is about 96, but it ranges from day 69 at P10 to day 128 at P90. A hospital network sized to the median peak is badly unsized for the upper-tail peak — and it cannot even count on when the surge arrives.
Which strategy actually brings transmission under control
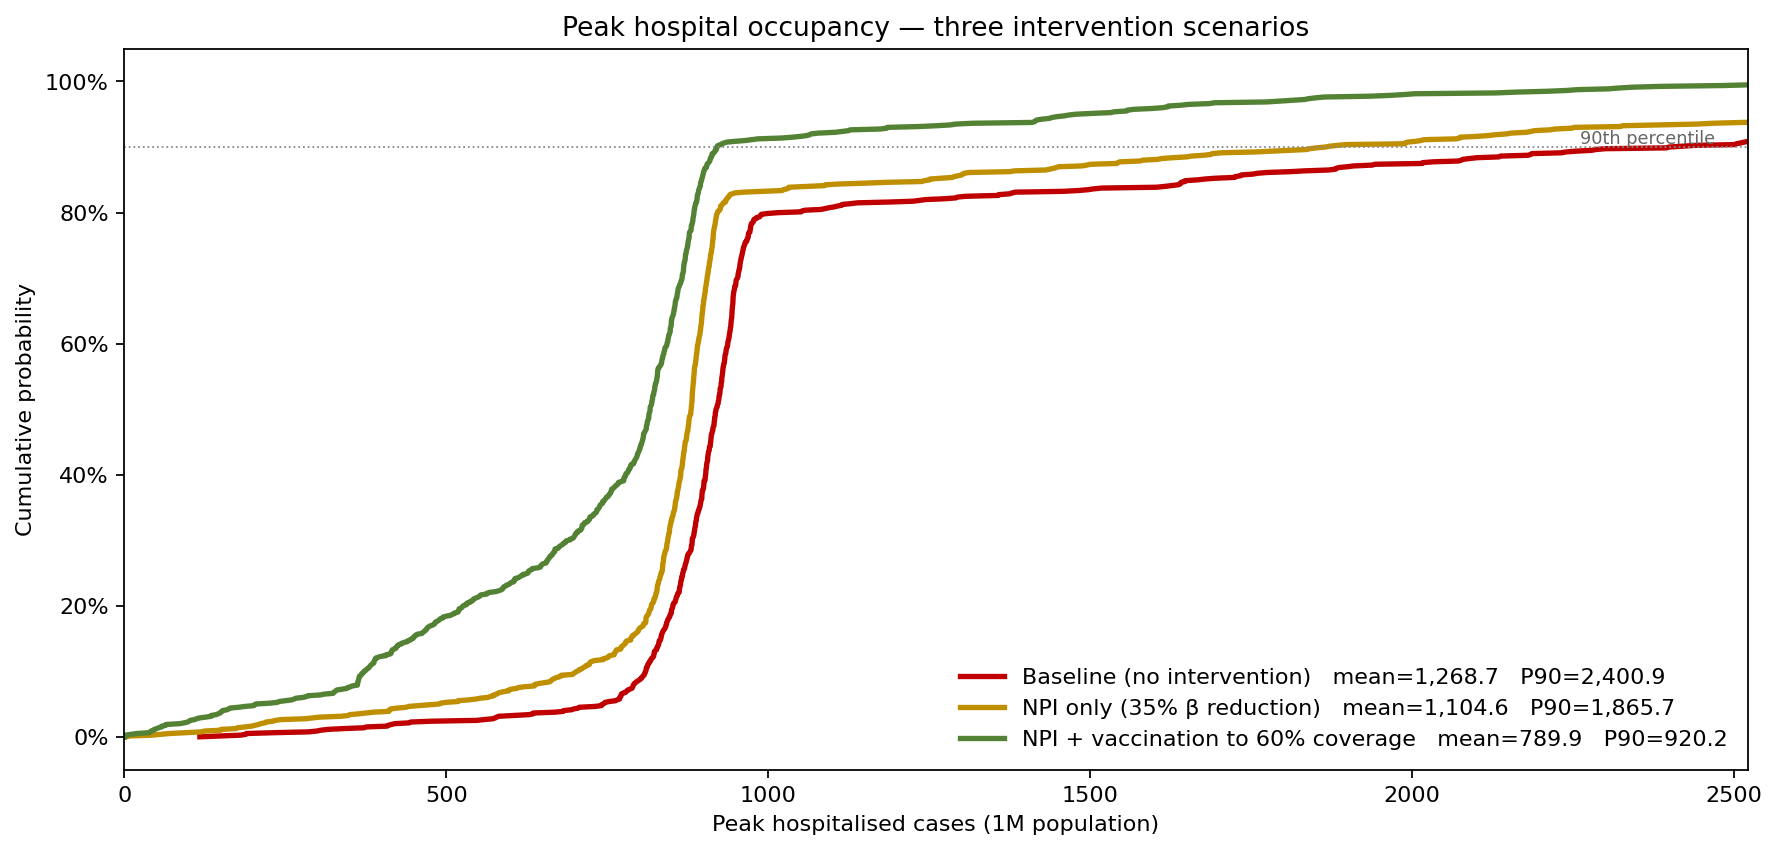
The NPI-only scenario applies a 35% reduction in β across days 30–120 (mask mandates, gathering limits). The combined scenario adds vaccination ramping to 60% coverage over days 60–180 at 75% efficacy, applied as a time-varying reduction in the remaining susceptible pool. The CDF makes the trade-off concrete: NPI alone cuts P90 peak hospitalisations from about 2,400 to about 1,870; layering vaccination on top cuts P90 further to about 920.
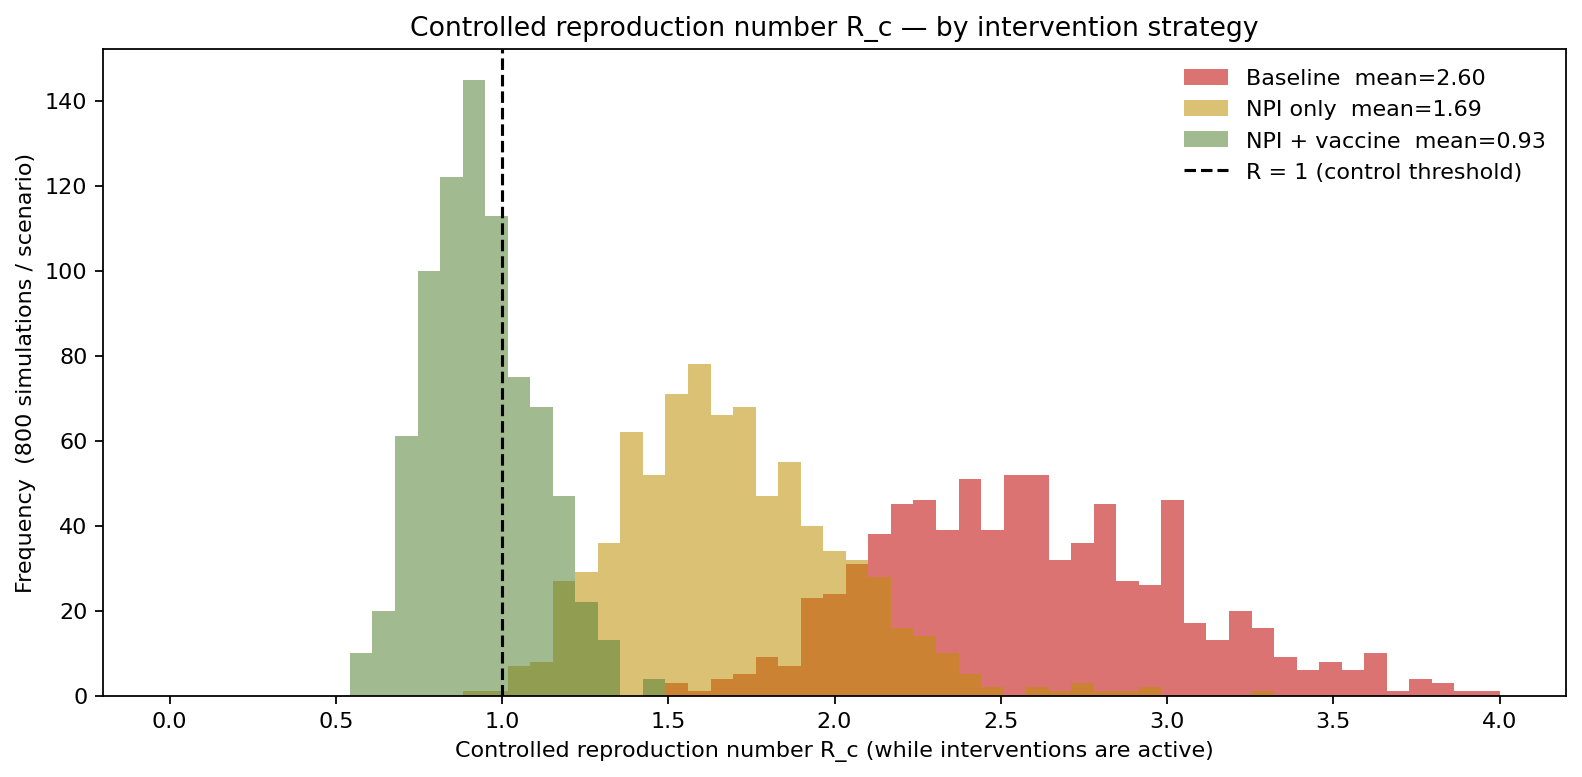
Peak occupancy tells you how bad the surge gets; the reproduction number tells you whether the strategy actually ends the outbreak. The right metric here is the controlled reproduction number R_c — R0 scaled by the NPI's transmission reduction and by the susceptibles the vaccine removes — rather than an effective R_e read off a single calendar day, which is confounded by how far each scenario has already burned through its susceptible pool. R_c isolates the transmission potential the strategy can deliver while measures are active. The baseline sits at a mean R_c of 2.60, with every parameter draw above 1. A 35% NPI reduction alone pulls the mean to 1.69 — but still never below 1: temporary distancing flattens the curve without ending the epidemic. Only the combined NPI + vaccination package brings the mean to 0.93, below the control threshold in about two-thirds of simulated worlds. The lesson the agency took: distancing buys time, but only the vaccine campaign closes the gap to R_c < 1 — and the distribution shows precisely how much of the parameter space still sits above 1 even then.
What actually drives the peak
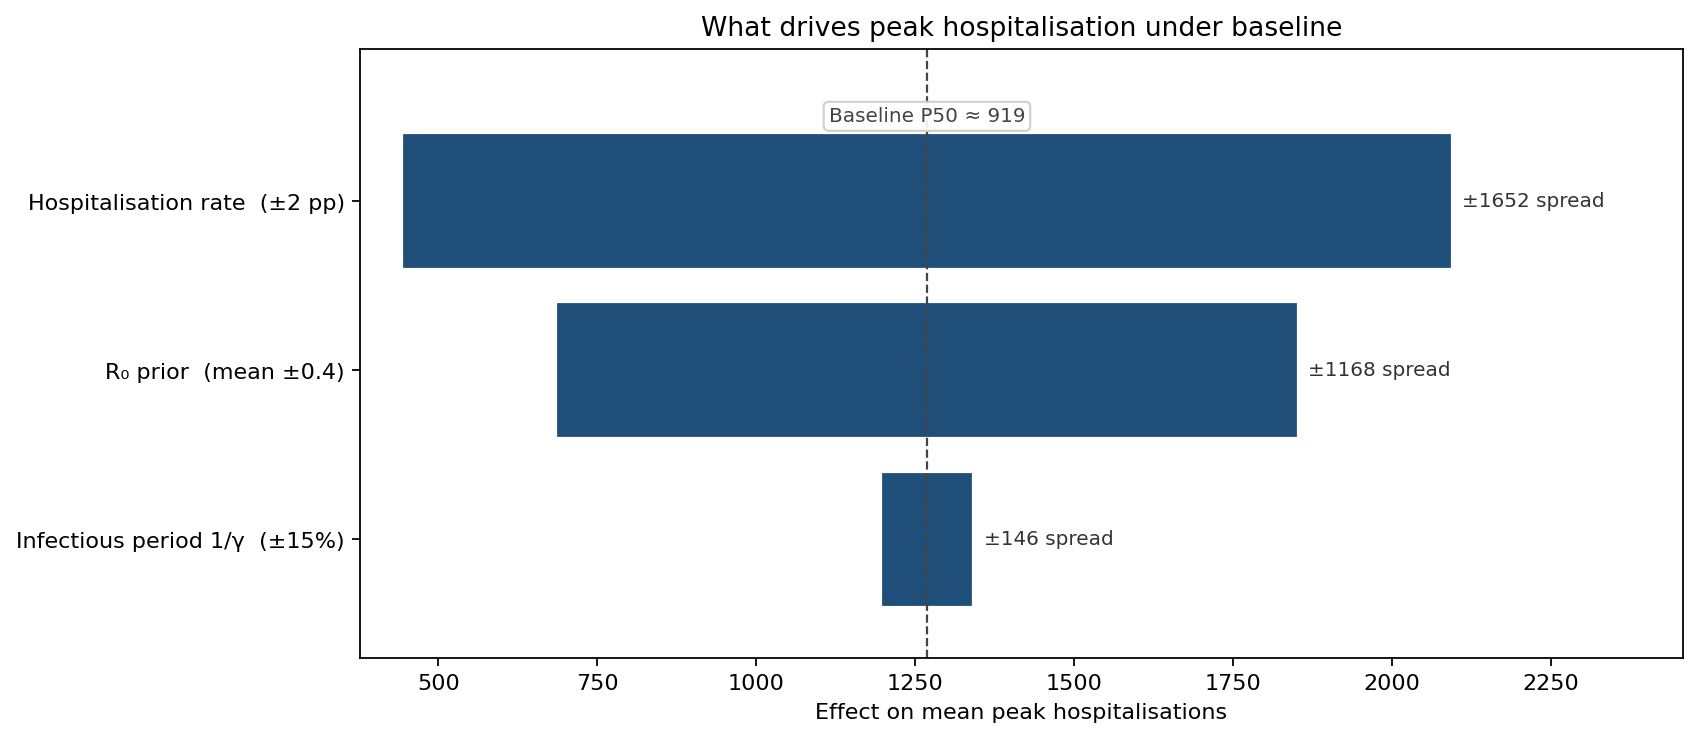
Two parameters dominate, and they are close. The hospitalisation rate is the single largest mover — a ±2 pp shift swings mean peak hospitalisations by roughly 800 cases either way — because it scales the entire occupancy curve directly. The R₀ prior is a close second: a ±0.4 shift moves the mean peak by roughly 600 cases. Together these two swamp the infectious-period term (about ±70 cases). The implication for the agency: real-time surveillance has to nail both the transmissibility (R₀) and the per-infection severity (hospitalisation rate) — the two estimates that, jointly, set the height of the surge — before any further modeling refinement is worth funding.
What changed
- SEIR rebuilt with frequency-dependent transmission — the
/Nfix realigned the predicted peak day to within 3 days of the observed 2009 H1N1 retrospective benchmark. - Peak hospital occupancy quoted with a confidence band — agency surge planning moved from "size to mean peak (about 1,270)" to "size to the P90 peak (about 2,400) and hold a buffer above it."
- NPI + vaccination combo prioritized on peak occupancy — the simulation quantified that the combined package cuts P90 peak hospitalisations from about 2,400 to about 920, justifying the parallel logistics investment — and the controlled reproduction number confirms only the combined package reaches R_c < 1.
- Joint R₀ and severity surveillance funded as the highest-marginal-value data projects — the tornado made the case that better hospitalisation-rate and R₀ estimates buy more peak-prediction accuracy than any other parameter refinement.
ModelRisk functionality used
- Stochastic compartmental SEIR with β·SI/N, integrated by Euler half-day steps inside Excel — the dimensional consistency of the term is auditable on the worksheet.
- LogNormal R₀ prior (mean 2.6, σ_log 0.18) — appropriate right-skewed distribution for transmission parameters that are always positive and have a long upper tail.
- Beta(2, 38) hospitalisation rate — correct bounded prior for a probability; Normal forbidden because it admits negative draws.
- Vaccination as susceptibility reduction — implemented as a time-varying thinning of the remaining susceptible pool over the rollout window, not as a one-shot subtraction.
- 800-iteration scenario rerun for each of three intervention packages, returning P10/P50/P90 of peak hospitalisations and the controlled-reproduction-number (R_c) distribution.
- Tornado driver ranking that placed hospitalisation rate and R₀ at the top — the briefing point that turned joint transmissibility-and-severity surveillance from a research line item into an operational requirement.
The R₀ headline number is one curve; the public-health decision is the shape of the upper tail of peak occupancy. Monte Carlo simulation in ModelRisk — with the population denominator restored to the transmission term — is what turns "we modeled the outbreak" into "we sized the hospital surge for the 90th percentile world."