

Industry: Healthcare and Epidemiology
Product: ModelRisk
Application: Clinical trial outcomes
Phase III Probability of Success: Why 30% on Paper Is Not 30% in Practice
A Phase III oncology or immunology readout costs the sponsor roughly $200–300 million by the time it finishes, and industry-wide only about one in two pivotal trials reads out positive on the primary endpoint. Probability of success (PoS) — the chance the trial demonstrates p < 0.05 on the agreed responder definition — is the single number that drives go/no-go committees, NPV calculations and licensing terms. Deterministic power calculators hand back one PoS based on point estimates for control rate, treatment effect and sample size. Monte Carlo simulation in ModelRisk hands back the distribution of those four ingredients, then asks how the trial behaves when all four move at once.
A clinical-development team for a novel immunology asset rebuilt their Phase III readout model end-to-end in ModelRisk. The trial: 320 patients per arm, 1:1 randomization against standard of care, primary endpoint a responder proportion at week 24. The deterministic plan reported 86% power. The probabilistic rebuild told a different story — the chart below is the whole argument in one frame.
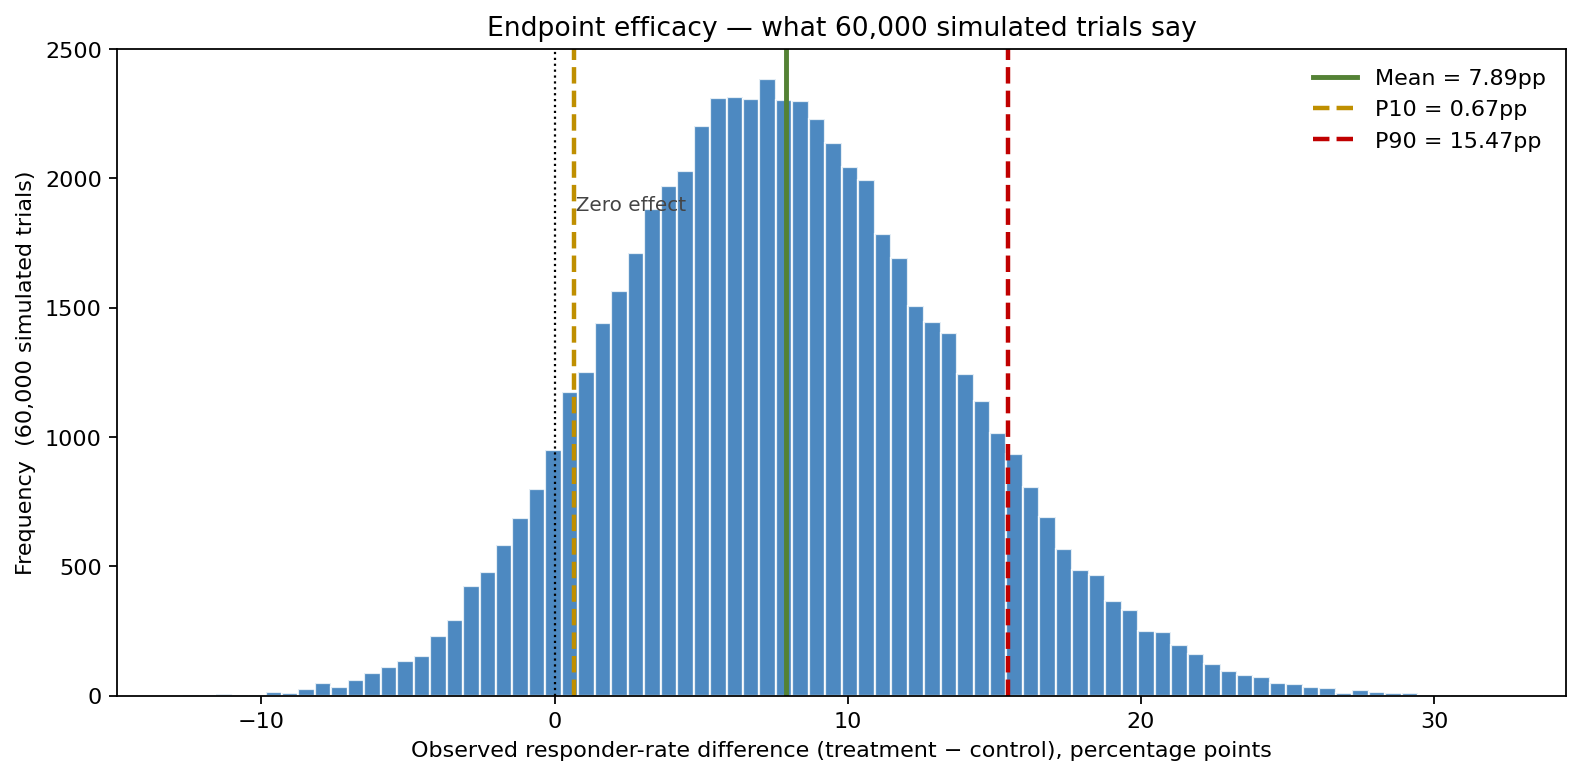
The power calculator hands back a single point on this axis. ModelRisk hands back the whole histogram: 60,000 trials drawn from realistic uncertainty on every input, with the mean observed effect at 7.89 pp but a left tail that reaches all the way back to zero. The spread — not the point estimate — is what determines whether the trial reads out positive.
Four uncertainties the power calculator hides
Power calculators take pc (control responder rate), TE (true treatment effect) and n (per-arm sample size) as fixed inputs. Real trials don't get fixed inputs.
Control responder rate was modeled as Beta(18, 42) — mean 30%, 90% CI 19%–42% — calibrated from a meta-analysis of seven prior trials in the indication. Using Normal here, as many in-house models do, lets the simulator draw negative response rates.
Treatment effect (absolute risk difference) was modeled as a scaled Beta(2.5, 7) × 0.30, giving a mean absolute effect of 8.3 percentage points with a mode at 5 pp and a long upper tail. Phase II read out at 12 pp, but Phase II responder rates regress toward the mean in confirmatory studies — the right-skewed prior reflects that.
Realized enrolment was modeled as truncated Normal around the planned 640 patients with σ = 40, plus an arm-imbalance term Normal(0, 14) per arm. Trials almost never randomize exactly 1:1 once you condition on actual stratified enrolment.
Dropout per arm was Beta(2.5, 13), mean 16% with a 90% CI of 5%–32% — wide because immunology trials have material differential dropout between active and placebo.
The Phase III statistic is the two-sample proportion Z-test on observed responders, using the retained arm sizes after dropout:
$$ Z = \frac{\hat{p}_t - \hat{p}_c}{\sqrt{\hat{p}(1-\hat{p}) \left( 1/n_t^{eff} + 1/n_c^{eff} \right)}} $$
ModelRisk simulated 60,000 trials. Each draw: pc, TE, dropout per arm, realized N per arm, then a Binomial draw for responders in each arm conditional on the true rates, then the Z-test.
What the simulation said vs what the power calc said
The deterministic calculator promised 86% power at TE = 12 pp, pc = 30%, n = 320 per arm. The Monte Carlo PoS came in at 48% — the gap is what enrolment uncertainty, dropout and the right-skewed TE prior together do to the headline number. The observed responder-rate difference has mean 7.89 pp, P10 = 0.67 pp and P90 = 15.47 pp; in roughly 20% of simulated trials the observed effect is below 3 pp and the trial reads out negative despite a true positive effect.
What actually moves the PoS number
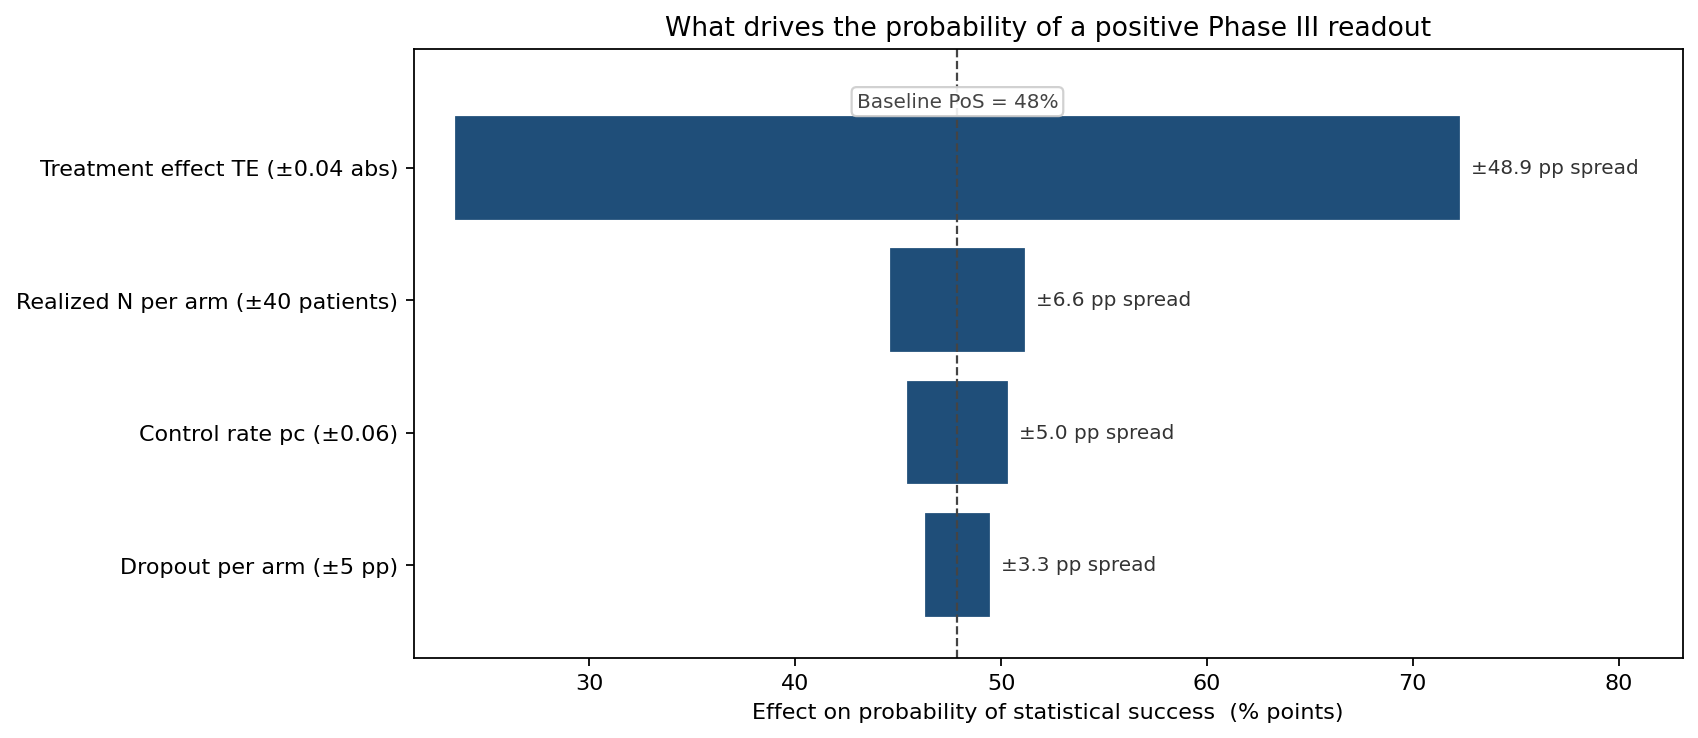
The treatment-effect prior dominates: tightening or widening TE by ±4 pp swings PoS by roughly 25 percentage points — an order of magnitude larger than any other lever. Realized-N variability moves PoS by about 3 pp, the control-rate prior by about 2.5 pp, and a ±5 pp shift in differential dropout by under 2 pp. The message for the trial team was unambiguous: the highest-marginal-value investment was not adding patients, it was reducing the prior uncertainty on TE through tighter biomarker enrichment or better Phase II analogues.
Adaptive interim — when conditional power earns its keep
The team also evaluated an adaptive design with an unblinded interim at 50% of the planned events. Conditional power (CP) is the probability the final readout is positive, given what has been observed so far. ModelRisk computed CP for every simulated interim outcome:
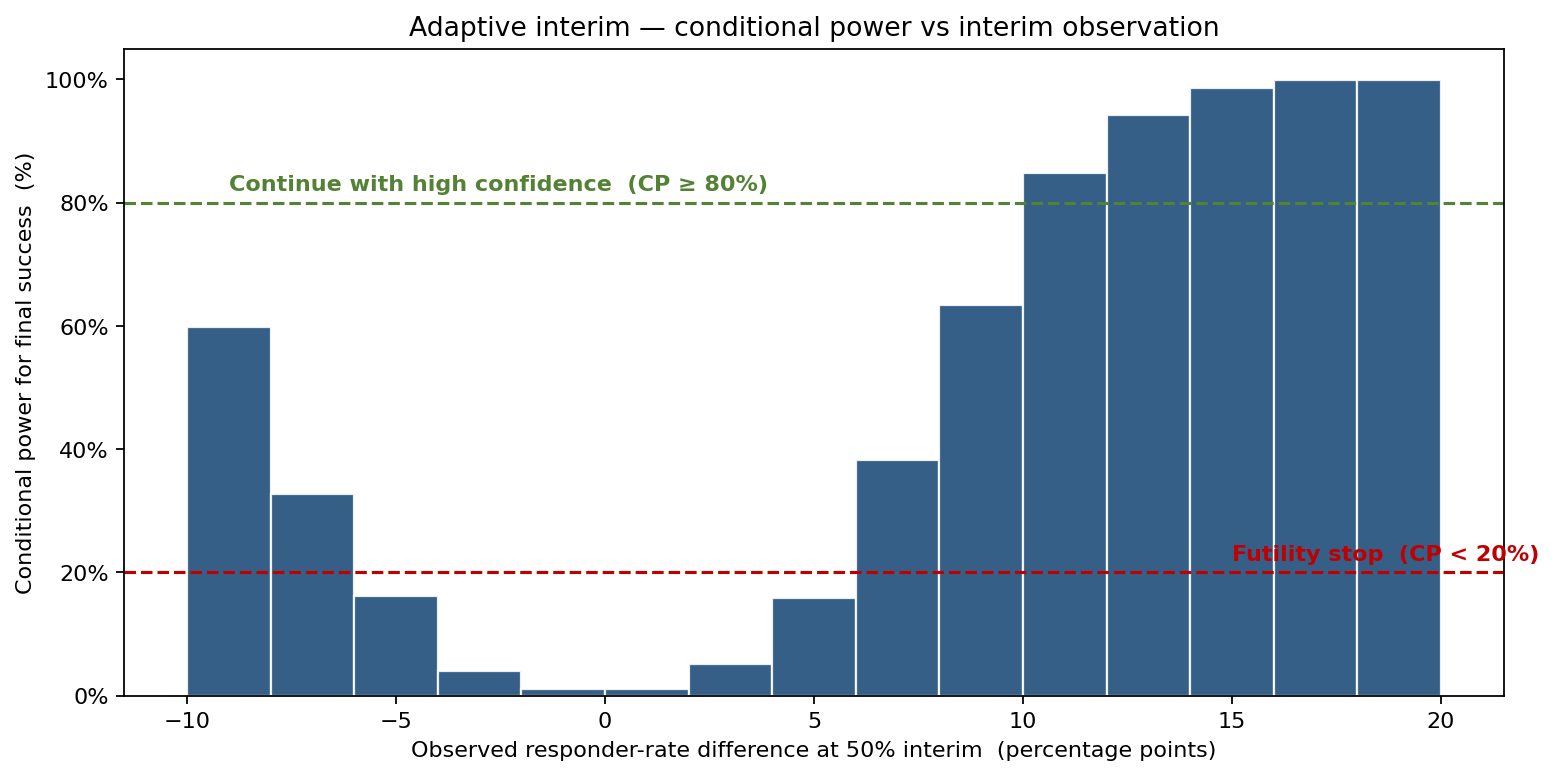
The chart drives the design rule. Trials where the interim observed difference sits below roughly 5 pp have CP under 20% — the futility-stop region. Trials above 11 pp have CP above 80% — continue. The middle band is where adaptive sample-size re-estimation actually adds value: bumping n by 25% in that zone, which the simulation also priced, lifted overall PoS from 48% to 55% at the cost of a 12% expected enrolment increase.
Three designs, three CDFs of treatment effect
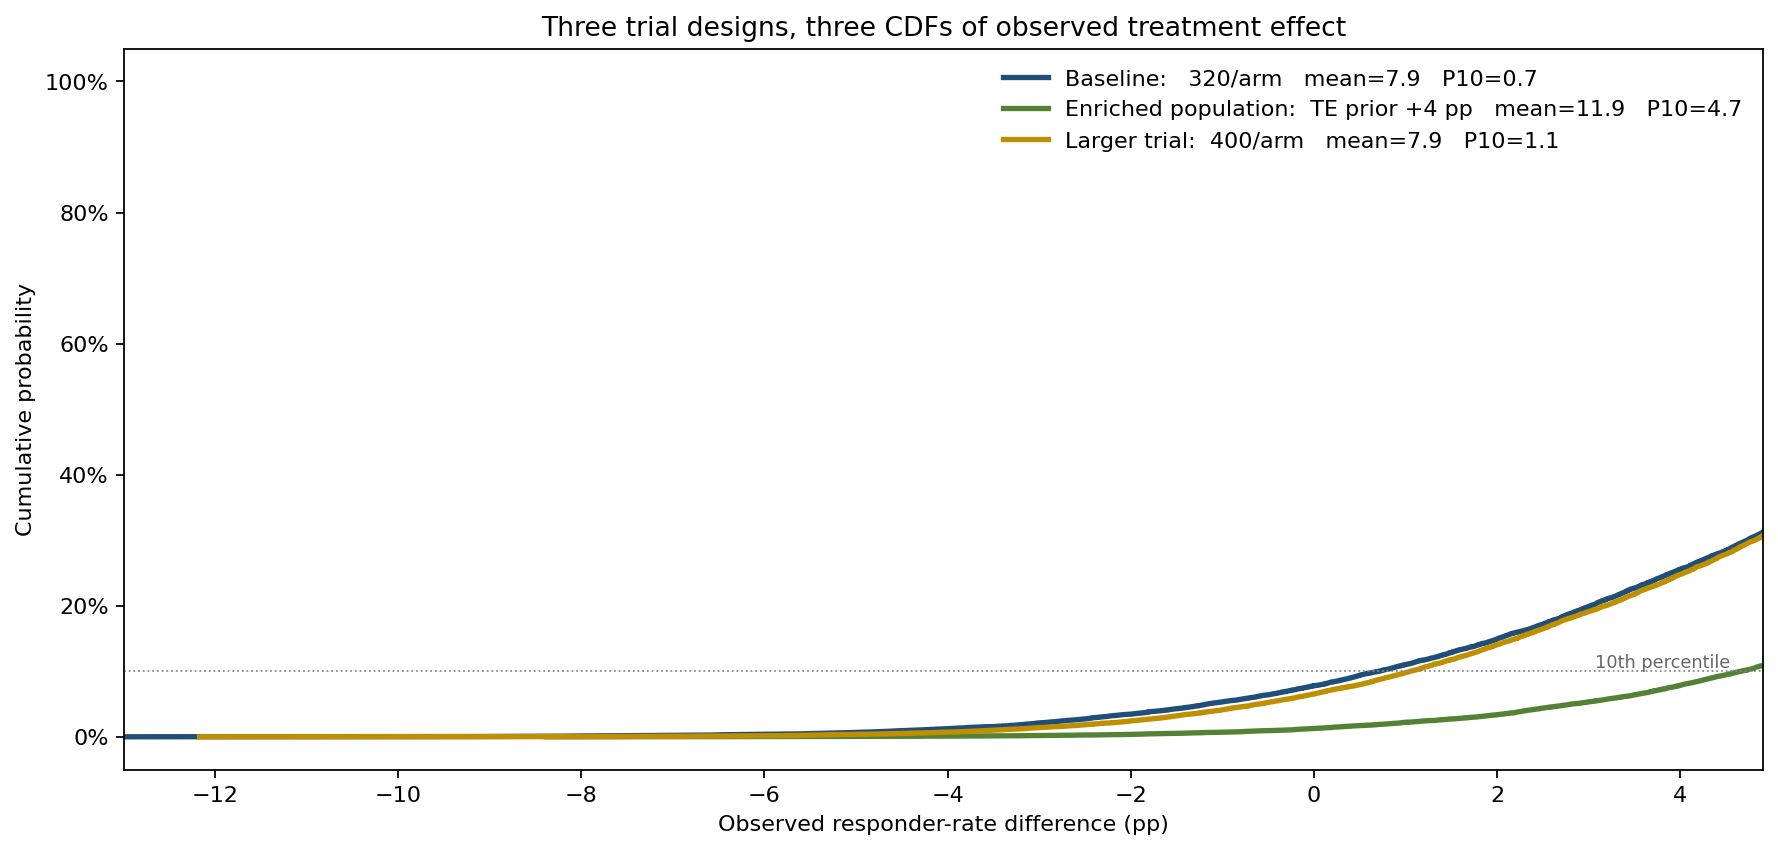
Re-running the simulator under three candidate designs gave the management team the trade-off explicitly. A larger trial (400 per arm, +25% spend) barely moves the mean observed effect — 7.8 pp versus the baseline 7.9 pp — and lifts PoS only to about 54%. A patient-enrichment strategy that adds 4 pp to the TE prior — by tightening eligibility to high-expression biomarker patients — shifts the entire CDF rightward (mean observed effect 11.9 pp) and lifts PoS to 74%, far more cost-effective than the larger trial.
What changed
- PoS revised from 86% (deterministic) to 48% (Monte Carlo) — communicated to the development committee with the underlying driver decomposition, not just the headline.
- Adaptive design with interim futility + SSR adopted, lifting PoS to 55% and adding expected NPV after re-enrolment cost.
- Enrichment strategy advanced over sample-size expansion — biomarker tightening lifted PoS to 74% while the +25% larger trial reached only about 54%, far more PoS per dollar from enrichment than from adding patients.
- Dropout-reduction targets set per site, with the simulation quantifying dropout as a real but second-order lever — a ±5 pp swing in differential dropout moves PoS by under 2 pp.
ModelRisk functionality used
- Beta and scaled-Beta priors for bounded inputs (control rate, treatment effect, dropout) — no negative or above-100% draws, unlike a Normal.
- Two-sample proportion test embedded in Excel so the same workbook running the simulation is the workbook the biostatistics reviewers audit.
- 60,000-iteration Monte Carlo with sample-size, dropout and arm-imbalance varied jointly — power-calc-style independence assumptions explicitly broken.
- Conditional-power computation at the 50% information fraction, used to set the futility threshold (CP < 20%) and sample-size re-estimation zone.
- Tornado driver decomposition that ranked TE prior, dropout, control rate and realized N by their contribution to PoS variance.
- Scenario CDF overlay for the three competing trial-design proposals, used in the executive briefing to land the enrichment recommendation.
Power calculators give one PoS. The trial gives one readout. The distance between them is what Monte Carlo simulation is built to measure — and once that distance is on the table, every design lever the trial team has is judged by how much of the gap it closes.